
Abstract
Forensic interventions aim to mitigate risk, yet research on change measured through repeated risk assessment is scarce, particularly regarding protective factors. This study examined changes in risk and protective factors during intervention and the impact of change on violent recidivism. Trajectories of 175 male justice involved youth with a history of violence were modeled using multilevel mixture modelling. Findings reveal that youths abstaining from violence displayed fewer risk factors and more protective factors at discharge. Assessments at discharge predicted recidivism. Change scores on several SAVRY/SAPROF-YV subscales over time demonstrated incremental predictive validity above and beyond assessments at discharge, emphasizing the necessity of personalized interventions and considering individual change alongside one’s overall risk level to inform more effective interventions. These insights advocate for balanced approaches informed by repeated assessments encompassing both risk and protective factors.
Youth violence risk assessment tools are typically used in judicial settings to assess the likelihood of reoffending among individuals with a history of violence. Based on the estimated level of violence risk, services are tailored to match the youth’s violence risk and needs. However, making risk management decisions based on a single estimate of violence risk is insufficient. Experts advise the periodic re-administration of risk assessment to capture changes in risk level over time (e.g., Douglas & Skeem, 2005). Research highlights the importance of dynamic risk and protective factors, which are modifiable and can change due to interventions or environmental influences, compared to static factors, which remain stable over time (Douglas & Skeem, 2005; Serin et al., 2016). For instance, dynamic risk factors such as substance abuse and peer relations can fluctuate significantly during interventions, underscoring the necessity for reassessment to capture these changes (Heilbrun et al., 2014). Such periodic evaluations not only refine risk assessments but also guide tailored interventions aimed at reducing recidivism. (Douglas & Skeem, 2005). Such reassessments are particularly valuable for evaluating stable dynamic risk factors, which reflect long-term patterns like persistent substance abuse or antisocial attitudes, and acute dynamic risk factors, which fluctuate rapidly in response to situational changes, such as heightened anger or interpersonal conflicts (Klepfisz et al., 2018). Stable dynamic factors provide insights into enduring behavioral patterns and guide long-term interventions, while acute dynamic factors are critical for managing immediate risks of violence (Douglas & Skeem, 2005).
Risk factors refer to characteristics or conditions that increase the likelihood of violent or delinquent behavior, such as peer delinquency, substance abuse, or low empathy (Bonta & Andrews, 2016). In contrast, protective factors are circumstances or personal attributes that reduce the likelihood of violent/delinquent behavior or mitigate the impact of risk factors, such as strong family bonds, positive social support, or effective coping skills (de Vries Robbé & Willis, 2017). Given the importance of periodic monitoring, the relationship between intra-individual changes in risk- and protective factors and violent recidivism is crucial (Viljoen, Shaffer, et al., 2017). However, little is known about how these factors develop over time within youth violence risk assessment tools. Furthermore, understanding how risk and protective factors change over time can inform the process of matching risk reduction strategies to youths’ evolving risk/needs level, which may enhance the effectiveness of interventions (Baglivio et al., 2017).
There have been numerous studies providing empirical evidence for the validity of juvenile risk assessment tools by examining the relationship between scores on risk assessment tools and recidivism (Schwalbe, 2007; Singh et al., 2011). The Structured Assessment of Violence Risk in Youth (SAVRY; Borum et al., 2006) is a widely used assessment tool specifically developed for justice involved youth with a history of violent behavior. There is a significant body of research on the predictive validity of the SAVRY. In two recent systematic reviews, it was found that SAVRY’s ability to predict future violence varies widely, with effect sizes ranging from negligible to large (Barboni et al., 2023; Koh et al., 2020). This variability in SAVRY’s predictive validity was not related to juvenile offender characteristics, the administration of the tool, or the measure of recidivism (Barboni et al., 2023). In regards to age, although the SAVRY was developed for use with adolescents up to age 18, several researchers studied its predictive validity in young adults (up to 25 years of age) and concluded that the SAVRY is also applicable in this age group (Kleeven et al., 2023; Vincent et al., 2019).
One advantage of the SAVRY is that it assesses both protective factors and risk factors. This is particularly important in adolescents, as researchers have emphasized that evaluating both risk and protective factors is crucial for a balanced appraisal of violence risk and mitigating risk (see for example Rennie & Dolan, 2010; Rogers, 2000). For example, Lodewijks et al. (2010) found that youth with higher levels of protective factors were significantly less likely to engage in violence, even when presenting with elevated risk. Additionally, protective factors are thought to increase young people’s motivation to change and inform positive oriented treatment goals (de Ruiter & Nicholls, 2011; de Vries Robbé & Willis, 2017). This underscores the significance of considering protective factors when using risk assessment to guide decision-making on risk reduction strategies. Nevertheless, when Dickens and O’Shea (2017) studied the protective factors of the SAVRY in their systematic review they concluded that while SAVRY’s protective factors were somewhat linked to desistance from reoffending, they did not offer incremental predictive validity over risk factors, suggesting room for improvement.
Based on the increasing clinical demand for a more profound focus on dynamic protective factors in juvenile risk assessment, and growing criticism towards the predominantly risk-only focus in risk assessment (Lösel & Farrington, 2012; Rogers, 2000; Shepherd et al., 2018), the Structured Assessment of Protective Factors for violence risk – Youth Version (SAPROF-YV; de Vries Robbé et al., 2015) was developed. The SAPROF-YV purely focuses on dynamic protective factors to complement predominantly risk-oriented juvenile risk assessment tools, such as the SAVRY or the Youth Level of Service/Case Management Inventory (YLS/CMI; Hoge & Andrews, 2011). A recent meta-analysis summarized five different studies that studied the incremental predictive validity of the SAPROF-YV over risk-oriented assessment tools (Burghart et al., 2023). The authors concluded that the SAPROF-YV significantly predicted violent and any reoffending after controlling for several risk-oriented assessment tools (including the SAVRY). In addition, a previous study examined the predictive validity of the SAPROF-YV in young adults and concluded that the predictive validity of the SAPROF-YV performed consistent with the adult SAPROF in this age group (Kleeven et al., 2023). Since the SAPROF-YV only includes dynamic protective factors and employs a seven-point rating scale to be able to monitor small improvements, this tool might be particularly suitable to map change on protective factors during supervision or trajectories through juvenile justice system.
The results above show that the scientific basis for the predictive validity of the SAVRY and SAPROF-YV is quite large. However, the vast majority of studies on these tools have focused on their predictive validity at single timepoints (Xu et al., 2020). Few empirical studies utilizing longitudinal research have examined whether and how dynamic risk or protective factors change during forensic interventions (Mulvey et al., 2016; Viljoen, Gray, Shaffer, Latzman, et al., 2017). The process by which protective factors within SAVRY and SAPROF-YV evolve alongside risk factors remains poorly understood. Therefore, this study will examine trajectories of justice involved youth by means of repeated assessments using the SAVRY, and the SAPROF-YV. The findings have practical and theoretical implications for understanding how risk and protective factors change during the trajectory in juvenile justice institutions and how these changes can guide more balanced and effective treatment efforts and risk reduction strategies.
A small body of research has studied the dynamic nature of the SAVRY and SAPROF-YV through change scores (Koh et al., 2021; Viljoen, Gray, Shaffer, Latzman, et al., 2017; Viljoen, Shaffer, et al., 2017). Taken together, studies found that the total scores on the SAVRY should change with 10–14%, and total scores on the SAPROF-YV should change with 16% to be likely reliable (i.e., change can likely be attributed to actual change rather than to measurement error). These studies also concluded that few participants showed reliable changes on the protective factors of the SAVRY, which suggests that the SAVRY protective factors may be less dynamic in nature, or less sensitive to measuring change over time due to their dichotomous rating structure. Given that the rating structure of the SAPROF-YV is more dynamic, one would expect that the SAPROF-YV would be more sensitive to measure change in protective factors. However, to date, only one study has examined changes in the SAPROF-YV and the SAVRY protective factors, and found no differences in the predictive validity of change scores on these measures (Koh et al., 2021). This highlights the need for more research to further investigate these findings and determine whether the SAPROF-YV and SAVRY protective factors can effectively capture change in protective factors over time.
Change scores only provide limited insight into how interventions have an influence on specific risk or protective factors (Norman et al., 1997). Measuring a mean change score between two time points does not take into account heterogeneity in change over time. Therefore, this method is not suited for measuring change within the juvenile justice population, as this is generally known to be a very heterogeneous population (Hilterman et al., 2019). There have been few studies examining heterogeneity in change trajectories of justice involved youth (Baglivio et al., 2017; Clarke et al., 2019; Hilterman et al., 2018; Mulvey et al., 2016). In these studies, very little attention has been focused on the role of protective factors. Hilterman et al. (2018) studied a large sample of youth in the Catalonian Juvenile Justice System with the SAVRY (using a gender sensitive factor structure of the SAVRY in which risk and protective factors were combined). They found that change trajectories of criminogenic risk/needs can be heterogeneous. The authors also suggest that in line with previous research (Viljoen, Gray, Shaffer, Latzman, et al., 2017; Viljoen, Shaffer, et al., 2017) the SAVRY might show limited sensitivity to measure change over time, as the time frame for coding the SAVRY items is oriented backward and comprises the conditions in the past 6/12 months. In another study, Baglivio et al. (2017) examined how the balance between risk and protective factors (measured using a buffer score: protective – risk factors with the residential positive achievement change tool [R-PACT]) changed during residential placement of youth under the Florida Department of Justice. These authors found similar results, in that trajectories of buffer scores are heterogeneous, and that individuals for whom risk factors increased relative to protective factors were more likely to recidivate. These studies offer important insights on how scores on risk assessment may vary over time, and how these changes vary between individuals. Yet, as these studies are predominantly risk focused and protective factors are not studied in conjunction to risk factors, they offer limited insight regarding how specific protective factors change during intervention in the presence of risk factors, and how these changes are related to reoffending.
Current Study
Taken together, there has been a small and inconsistent body of literature regarding changes on youth violence risk assessment. The majority of studies focused mainly on risk factors or investigated change through mean change-scores which can oversimplify the actual changes within a heterogeneous sample. The current study examines heterogeneity in juveniles’ trajectories in SAVRY and SAPROF-YV subscale scores over time during their trajectory in a juvenile justice institution. The following research questions will be examined in this study: (1) How do repeated SAVRY and SAPROF-YV subscale ratings change over time during trajectories in juvenile justice institutions? (2) Is there heterogeneity in these SAVRY and SAPROF-YV subscale changes during trajectories in juvenile justice institutions? (3) Does change in SAVRY and SAPROF-YV subscale ratings during trajectories in juvenile justice institutions provide incremental predictive validity for violent recidivism, over risk assessments at the end of the intervention?
A significant decrease over time on the dynamic risk subscales of the SAVRY (i.e., social/contextual, individual subscales), and a significant increase on the protective factors of the SAVRY and SAPROF-YV subscales was hypothesized. No change was expected for the SAVRY historical subscale. Heterogeneity in SAVRY and SAPROF-YV subscale trajectories was expected. Compared to recidivists, the subscale trajectories of non-recidivists were expected to have larger reductions in risk factors, and also larger improvements in protective factors. The change scores of the SAVRY and SAPROF-YV subscales were expected to have incremental predictive validity in the assessment of violence over the last performed risk assessment before discharge.
Method
Setting
This study was part of a larger study aimed at the empirical validation of the SAVRY and SAPROF-YV as risk assessment measures in juvenile justice institutions in the Netherlands (Kleeven et al., 2022). At the time of this study, there were 7 different juvenile justice institutions in the Netherlands. In these institutions, juveniles and young adults stay under various criminal law measures (such as juvenile detention, pre-trial custody, or mandatory treatment order). The length of stay is usually short (up to three months), but can reach up to two years for juvenile detention and up to seven years for the mandatory treatment order. All youth in juvenile justice institutions receive some form of treatment and are guided to help them reintegrate into society as successfully as possible. All youth follow the YOUTURN methodology (Hendriksen-Favier et al., 2010). Depending on the length of their trajectory, juveniles follow different treatment phases aimed at stabilization, motivation, personal development, resocialization, and aftercare. By means of accompanied or unaccompanied leaves, youth are gradually prepared for their return to society. Among all youth discharged from juvenile justice institutions, 57% are reconvicted for any reoffence within two years (Boschman et al., 2022).
Sample
For inclusion in this study, files of youth residing in juvenile justice institutions between January 2013 and May 2016 were reviewed (for an overview of inclusion and exclusion criteria see Figure 1). Files were drawn from a larger file study on risk assessment measures. In the current study, youth with multiple risk assessments during the study period were included, while youth for whom only one risk assessment could be performed were excluded. The sample included 175 males between 13 and 25 years old at the start of the intervention (M = 17.88, SD = 1.71). For each individual SAVRY and SAPROF-YV were coded retrospectively 2–8 times during the duration of the intervention (2 time points = 44%, 3 time points = 28%, 4 time points = 12%, 5 time points = 9%, 6 time point = 4%, 7 time points = 1%, 8 time points = 2%). Of the 175 youth, 120 (68.5%) served a juvenile detention sentence, 43 (24.6%) were sentenced under a mandatory treatment order, 9 (5.1%) remained in pre-trial custody, and 3 (1.7%) served an adult detention order executed in a juvenile justice institution. The duration of trajectories varied between 81 days and 6.33 years (M = 506.15 days, SD = 493.80 days). All youth included in this study had at least one formal conviction for previous violent offending. Flowchart inclusion and exclusion criteria.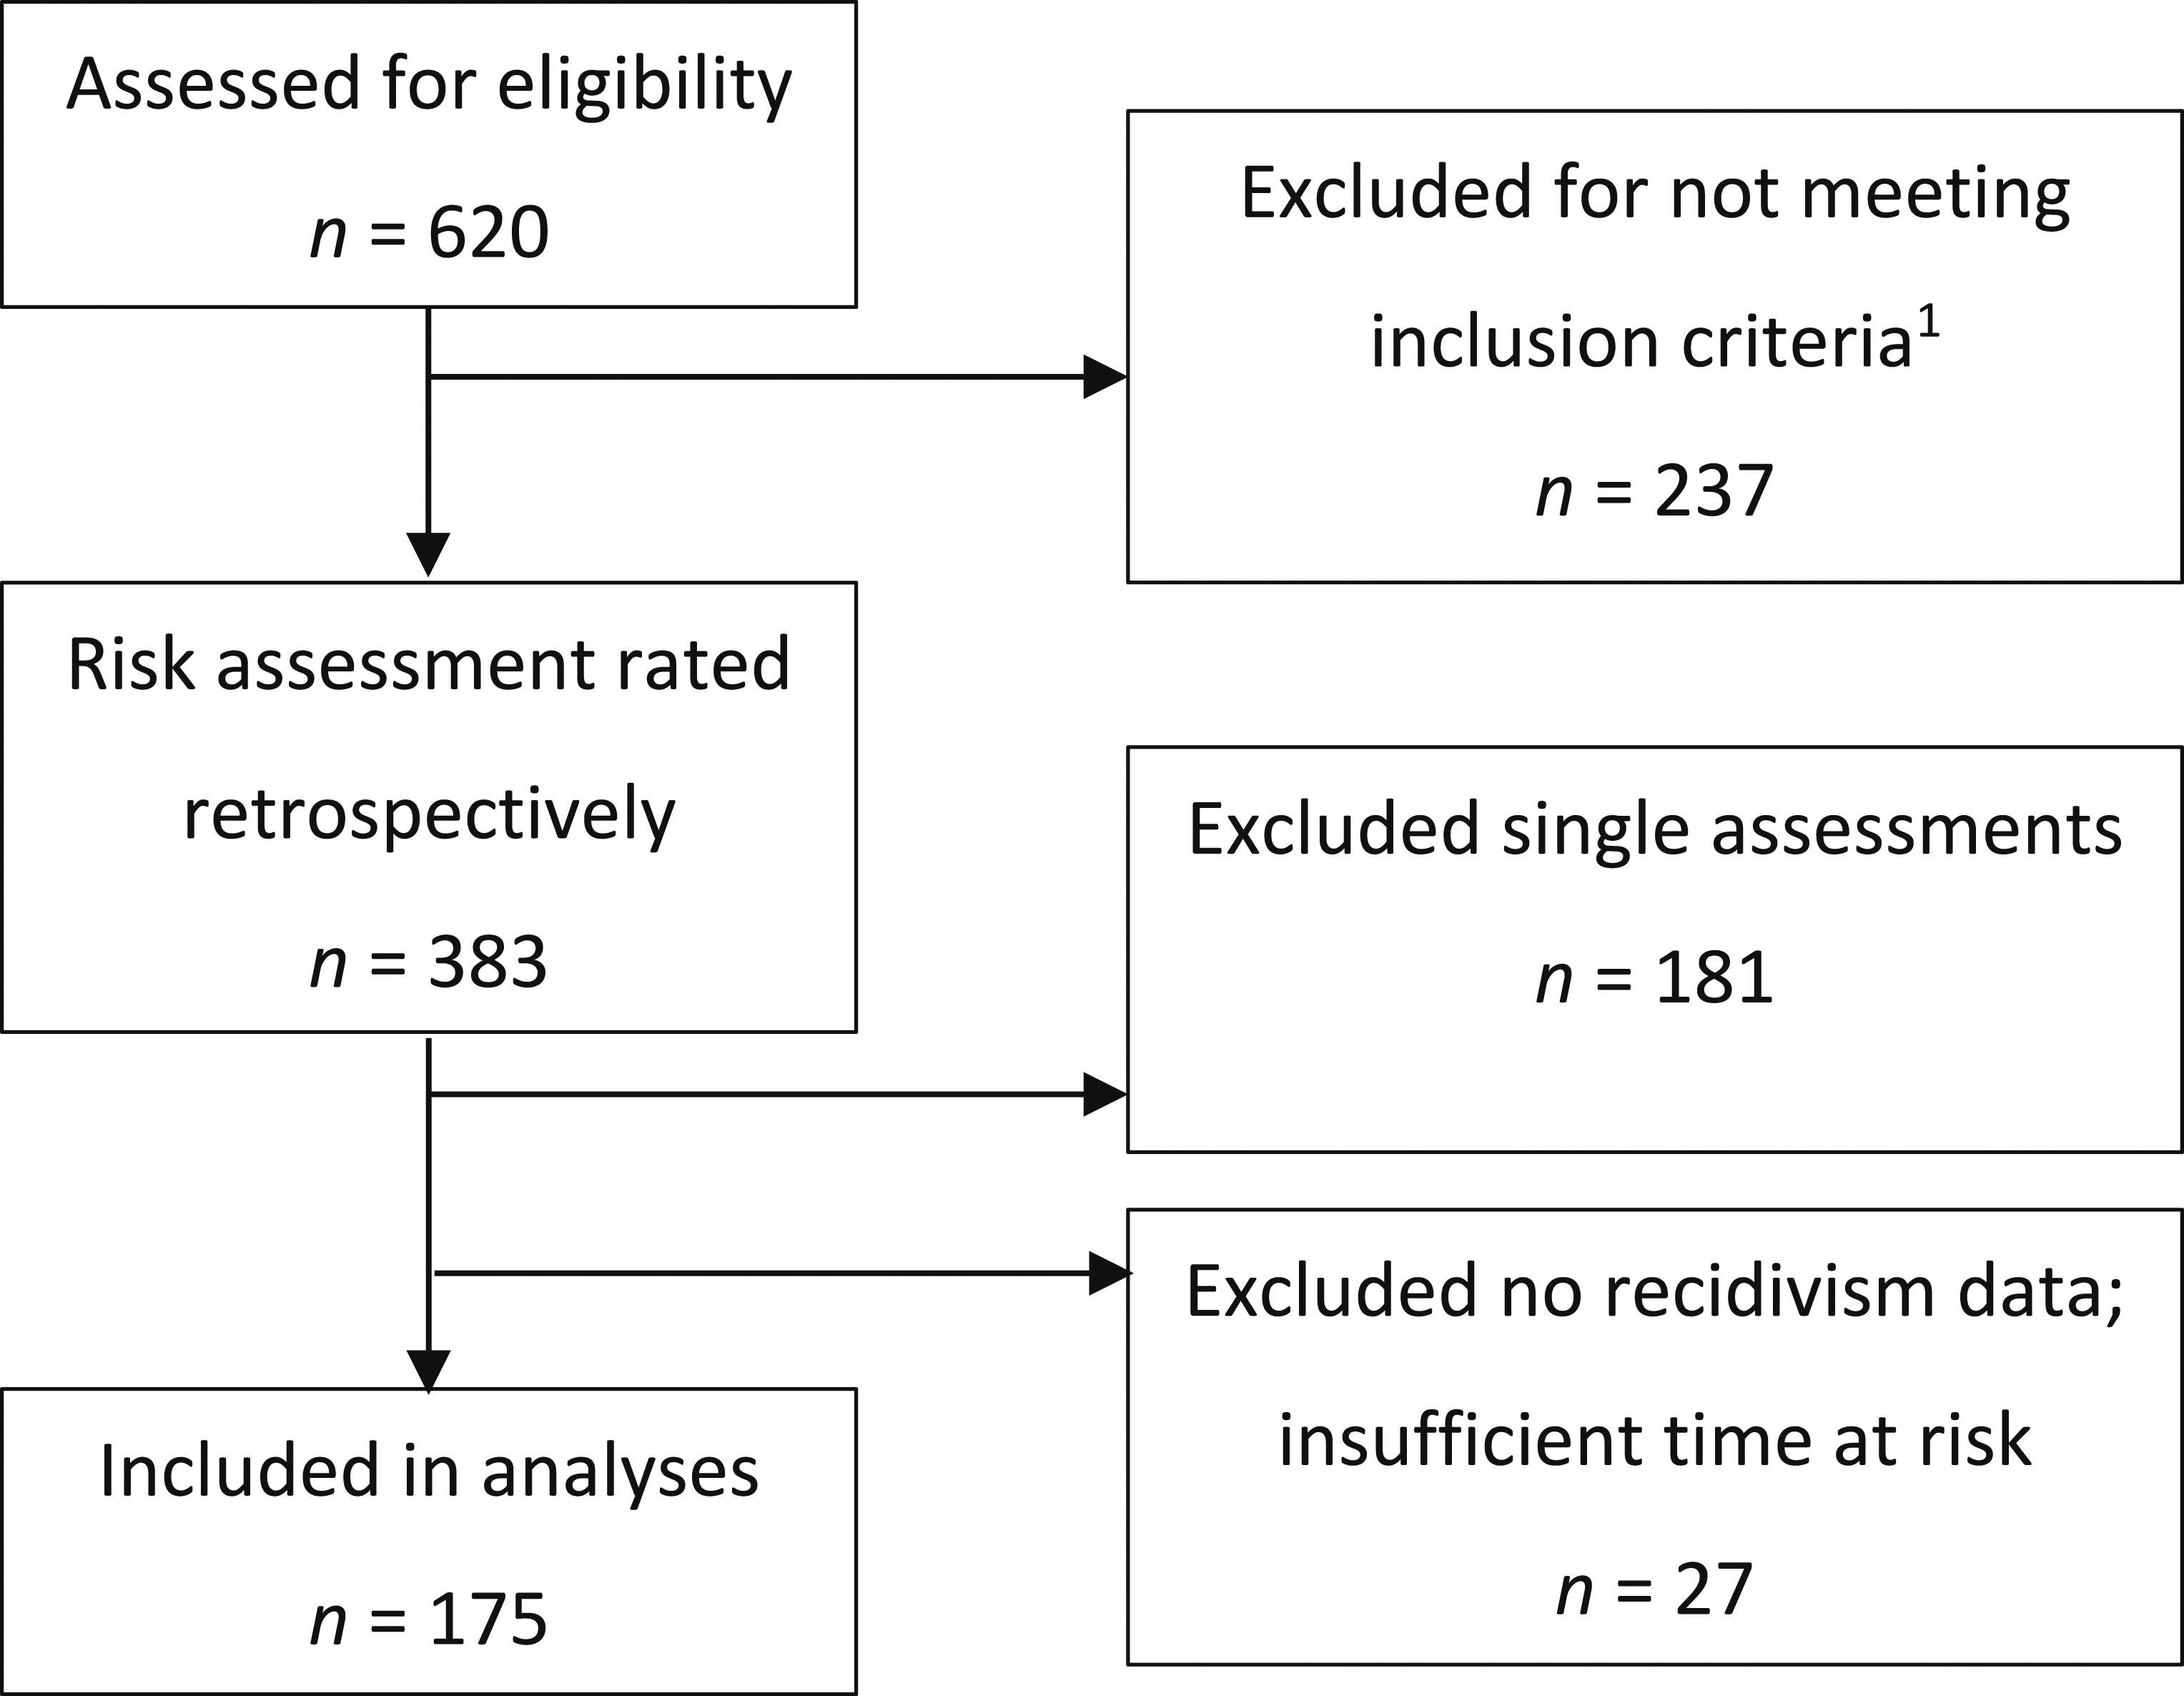
Measures
SAVRY
Overview SAVRY Items.
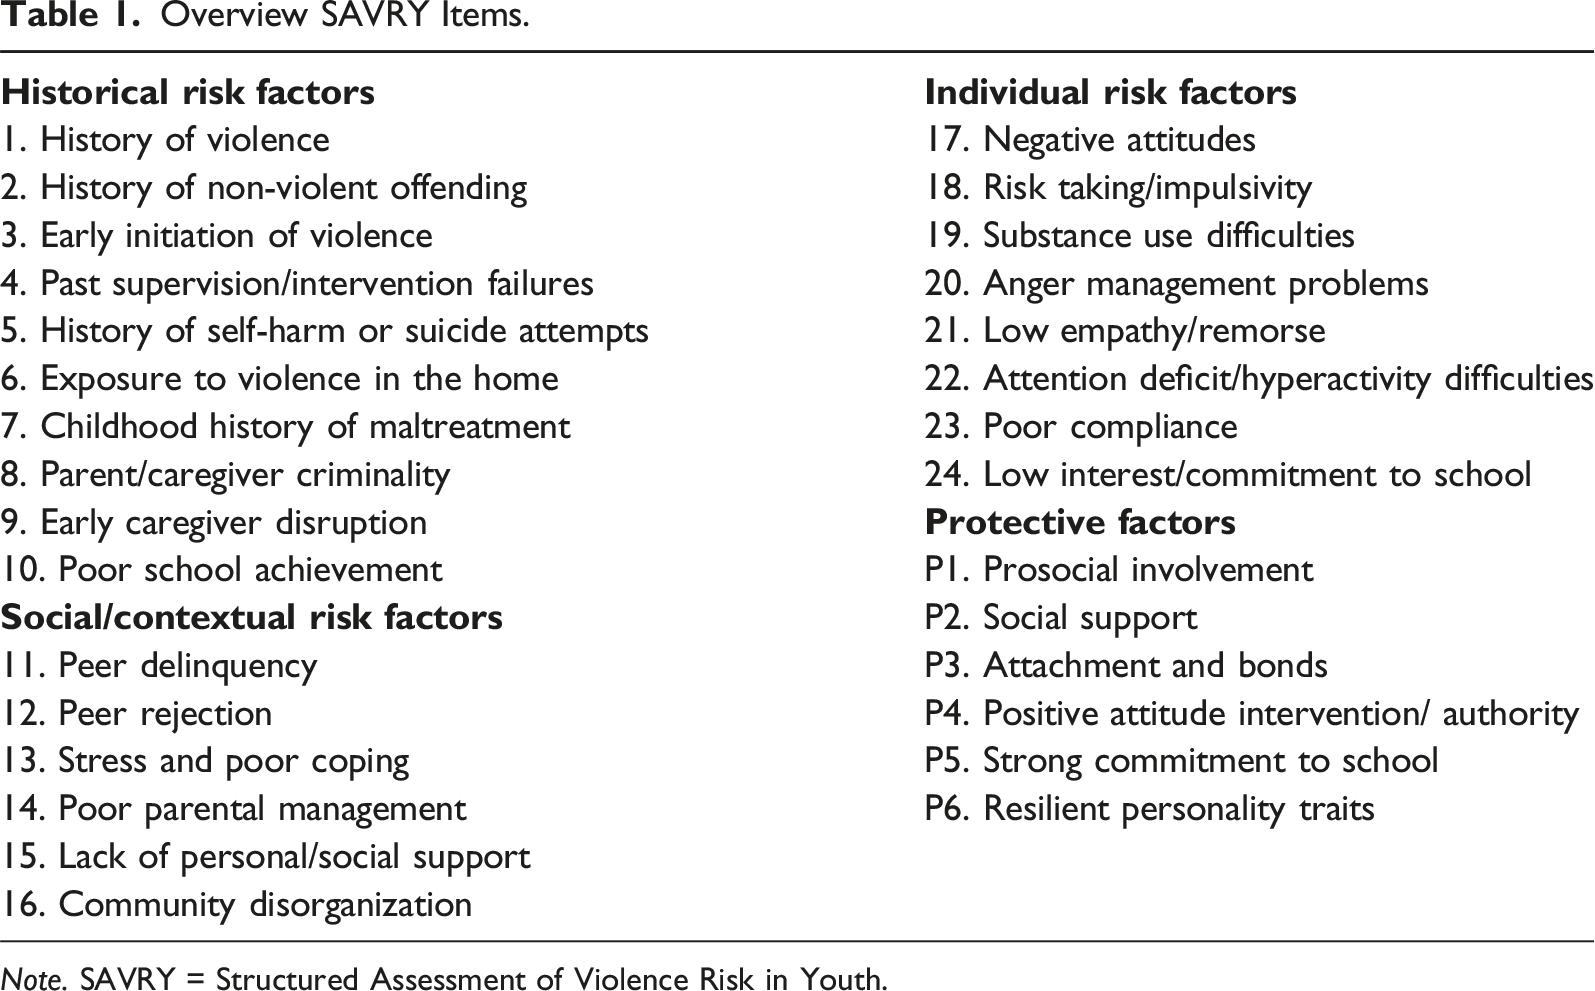
Note. SAVRY = Structured Assessment of Violence Risk in Youth.
For the purpose of the current study, subscale scores were formulated by adding up the risk or protective factors within a subscale. These subscale scores were then standardized by dividing them by the maximum possible score on the corresponding subscale, resulting in subscale scores ranging from 0 to 1 where 1 is the maximum possible score reflecting the highest level of risk factors or highest protection. Note that although this procedure does not reflect the method used in clinical practice, standardization facilitates comparison and interpretation between assessment tools and scales. Off all the risk and protective factors in the SAVRY that were rated in this study 0.30% of the items was missing. These missing items were imputed prior to formulating the subscale scores using three imputations in the Statistical Package for the Social Sciences (SPSS) version 28.
SAPROF-YV
Overview SAPROF-YV Items.
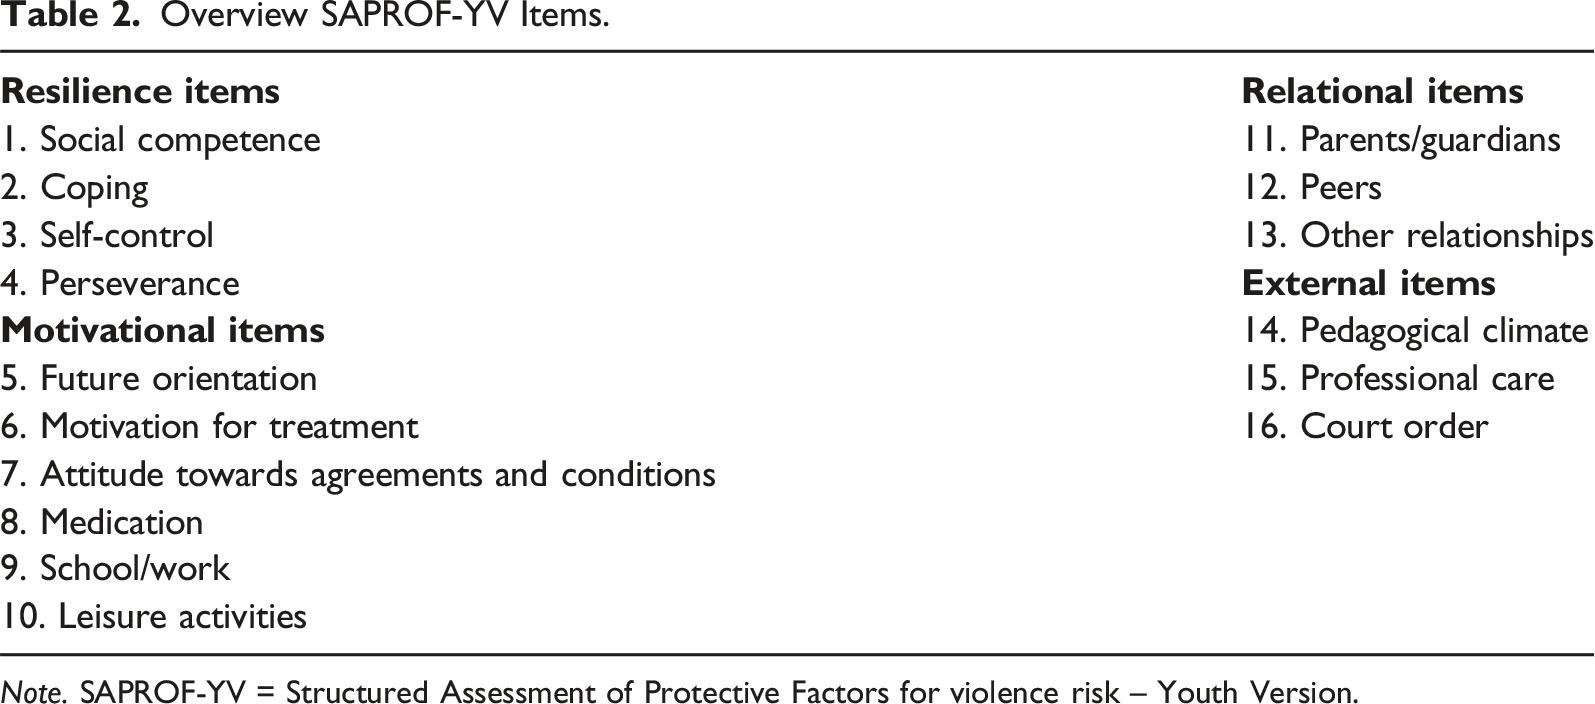
Note. SAPROF-YV = Structured Assessment of Protective Factors for violence risk – Youth Version.
Recidivism
Official recidivism data were obtained from criminal records in the Judicial Documentation register of the Dutch Ministry of Justice. In this study, a follow-up period of at least 32 months after discharge was available for all individuals (range 32–66 months, M = 47 months). Recidivism data were retrieved on February 1, 2019 for all individuals in this study. A fixed follow-up period of 24 months was employed in this study. New violent offenses committed after the release date that led to official judicial convictions were classified as convictions for violent offenses based on the following definition: Any (attempted) act intended to cause physical or psychological harm to others. Of the 175 individuals in this study, 54 (30.9%) showed at least one new violent offense during the follow-up period.
Procedure
This study utilized archival case file information from electronic case files in juvenile justice institutions. Risk assessment tools were retrospectively coded by a team of 21 research assistants (Master students Psychology or Criminology). The files contained a wide range of information, including (i) screening of psychosocial problems (self-report questionnaires such as MAYSI-2, SDQ); (ii) treatment plans and treatment evaluations (a treatment plan was usually drawn up during the first month of the intervention and evaluated approximately every 4–6 months); (iii) incident reports (e.g., physical or verbal violence, positive urine checks for substance use, possession of contraband); (iv) daily reports by group workers regarding the juvenile’s functioning and interactions with parents/guardians; (v) supervised and unsupervised leave plans and evaluations (including a recent SAVRY assessment completed by the therapist); (vi) evaluations regarding the extramural phase of the treatment order (Supervision and Training Plan; STP plan), which generally also included information on risk level (i.e., a recent SAVRY completed by the therapist), information regarding participation in school/work, living situation, and the nature and intensity of the provided treatment/support in this last treatment phase. Additionally, the research team had access to the juveniles’ judicial files, which provided information on criminal history and judicial (pre-trial) reports regarding criminal cases (e.g., police reports, court verdicts, psychological reports, and probation services records).
Risk assessments were rated 2–8 times for each juvenile, with the number of assessments determined by the number of treatment plans/evaluations documented in the files. Because treatment plans and evaluations were not conducted at uniform intervals, the time between assessments varied across participants. For each time point, all other file information was sorted chronologically, and reports were assigned to the appropriate time point based on their creation date. All file information up to the first time point was included in the first assessment, all information between the first time point and second time point was used for the second assessment, and so on. To promote blind assessment as much as possible, the sorting process was completed by a different member of the research team than the researcher responsible for rating the risk assessment tools. Recidivism data were coded separately by another member of the research team after completion of the SAVRY and SAPROF-YV ratings.
Prior to data collection, all research assistants completed a two-day training on the use of the SAVRY and SAPROF-YV. They also underwent a two-week training by the principal investigator on the use of the file system and study procedures, during which they rated a minimum of three additional practice cases in consensus. This rigorous training ensured consistent application of the coding process and assessment tools.
In order to assess the interrater reliability the files of 18 randomly chosen cases (a total of 46 assessments) were assessed by two randomly chosen research assistants in alternating pairs. For these cases, assessments were first rated independently and subsequently a consensus rating was composed for each of the assessment time points. The independently rated assessments were used to calculate the interrater reliability and the consensus ratings were used in the main analyses. Interrater reliability was assessed using a Intraclass Correlation Coefficient (ICC) with a random two-way model, and absolute agreement. Single measures ICC’s were .92 (excellent) for the SAVRY historical subscale, .73 (good) for the SAVRY social/contextual subscale, .87 (excellent) for the SAVRY individual subscale, .82 (excellent) for the SAVRY protective subscale, .61 (good) for the SAPROF-YV resilience subscale, .62 (good) for the SAPROF-YV motivational subscale, .85 (excellent) for the SAPROF-YV relational subscale and .65 (good) for the SAPROF-YV external subscale (see Fleiss, 1986 for how ICC’s are classified). The interrater reliabilities in the current study were in line with previous studies showing that the ICC for SAVRY and SAPROF-YV subscales ranged from moderate to good (Burghart et al., 2023; Hilterman et al., 2014).
Statistical Analyses
Repeated measures of SAVRY and SAPROF-YV subscale ratings were analyzed using Linear Mixed Model (LMM) analysis in SPSS version 28, following Heck et al. (2014) and Singer et al. (2003).
Since this study relied on file information, the timing between treatment evaluations was not standardized, leading to variability in the intervals between assessments. LMM is well suited for handling unbalanced longitudinal data, as they account both for differences in the number of observations between participants and the timing of assessments (e.g., the number and spacing between measurements may vary; Heck et al., 2014; Shek & Ma, 2011; Singer et al., 2003). Time was included as a continuous variable in the analyses. Time was assigned a value of zero for assessments coded at the end of the intervention, and previous assessments were assigned by calculating the difference in years from the final assessment (e.g., assessments coded 365 days prior to release were coded as −1.00). The intercepts indicated the average SAVRY/SAPROF-YV subscale score at the end of the intervention. Slopes indicated the average rate of change in subscale ratings within one year in juvenile justice institutions.
Mean SAVRY and SAPROF-YV Trajectories
To address the first research question, we composed separate models for the SAVRY and SAPROF-YV subscales. In all models a linear trajectory was assumed, as advised by Raudenbush and Bryk (2002) as 44% had two measurements. In the first models (models a) we included a fixed intercept and fixed slope. In these models a group average intercept and slope were estimated, as well as the variance in intercepts between individuals. Subsequently, we composed the models in which we included a fixed intercept, fixed slope, and random component for both the intercepts and slopes (models b). These models included an intercept and slope for a typical person in the sample (group average), and the variance around these intercepts and slopes between individuals. We compared model fit of the different models (models a and b) using −2 log likelihood (i.e., likelihood ratio test). The likelihood ratio test has been developed to make a comparison between nested models. A significant likelihood ratio test indicates superior model fit relative to the first model.
Heterogeneity in Trajectories and Incremental Predictive Validity
When the final models were selected we used the random components of the models as a measure to assess heterogeneity in growth parameters to answer research question two. For the third research question, the estimated intercepts and slopes for each individual were used in a stepwise logistic regression analyses with violent recidivism as outcome. In the first step of the logistic regression, we added the individually estimated intercepts, and in the second step the individually estimated slopes.
Results
Model Selection
Model Fit Indices Linear Mixed Models.
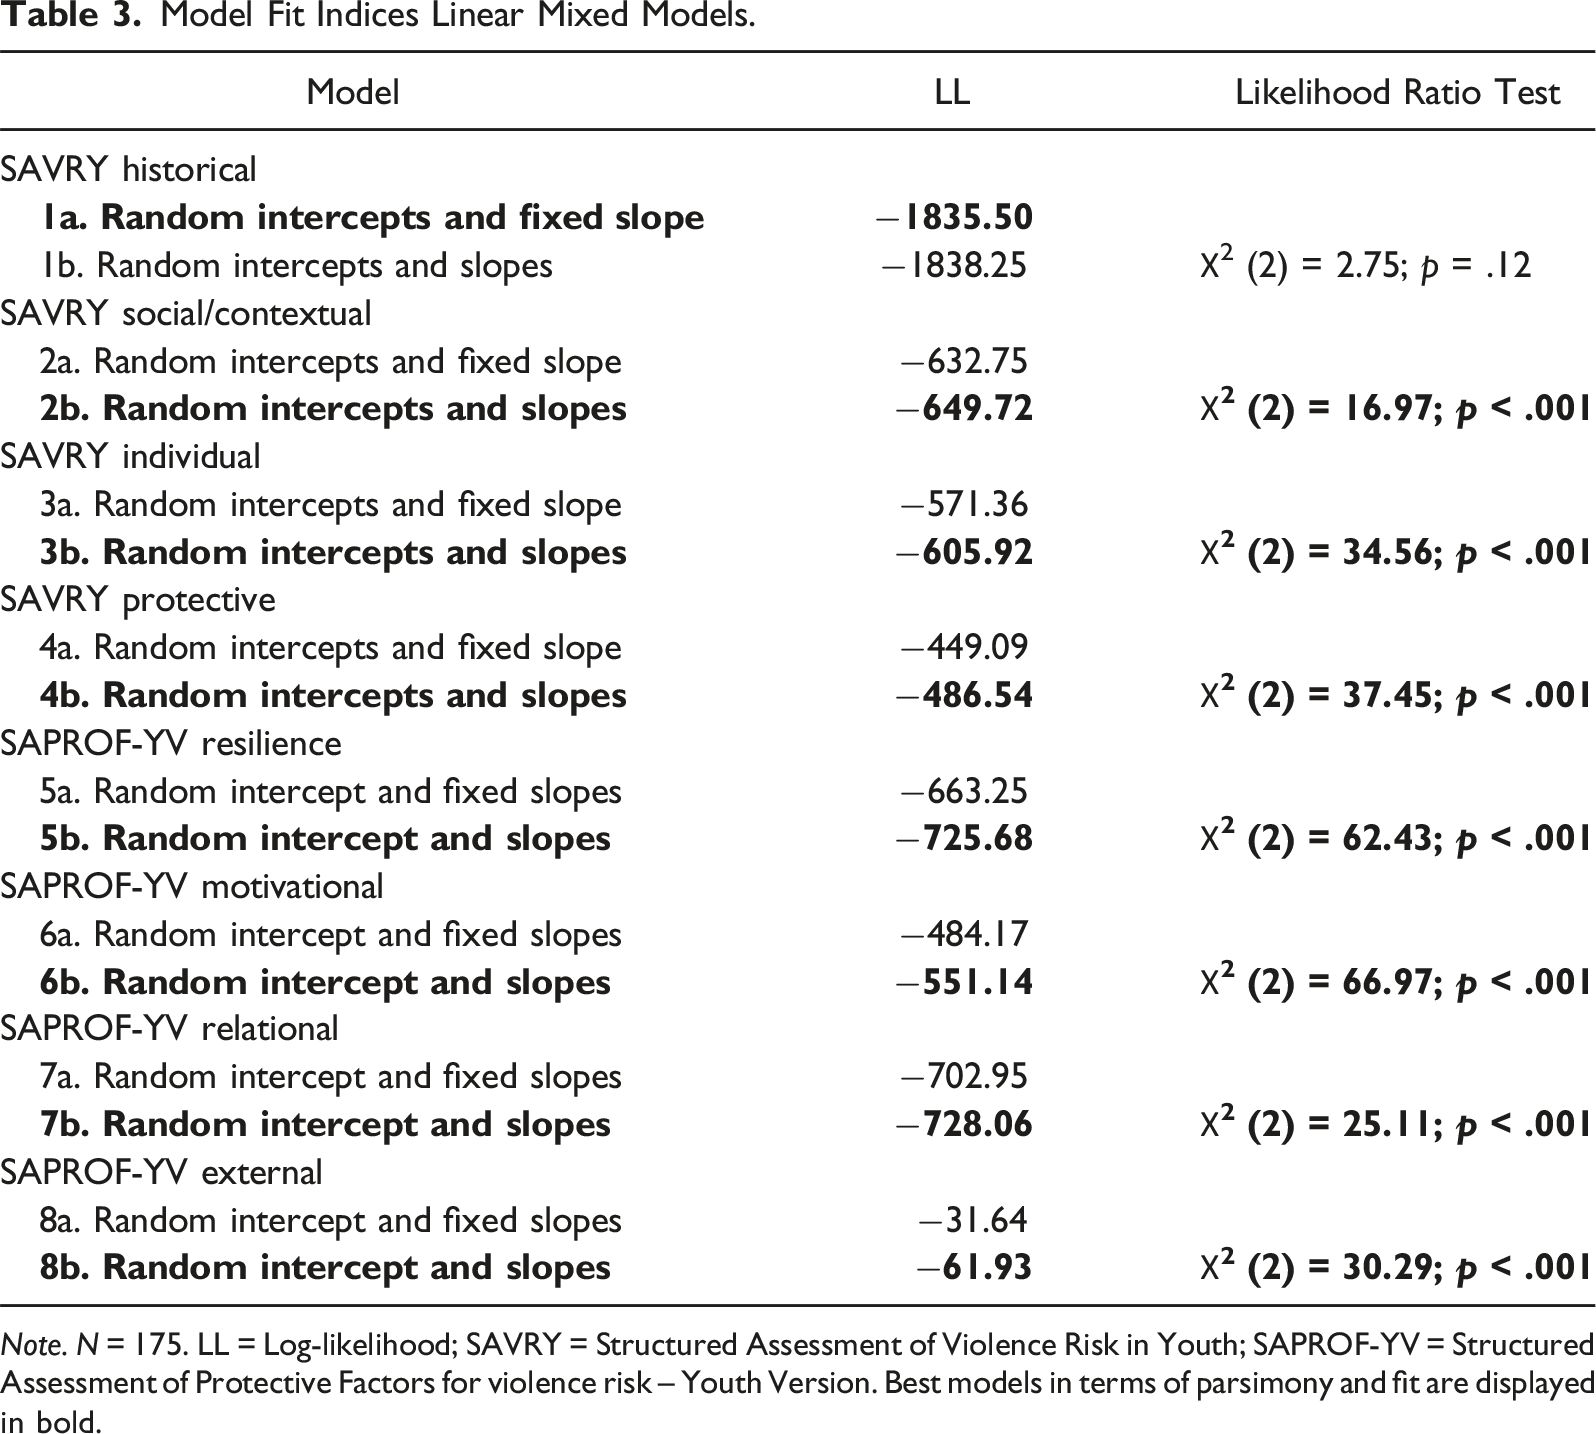
Note. N = 175. LL = Log-likelihood; SAVRY = Structured Assessment of Violence Risk in Youth; SAPROF-YV = Structured Assessment of Protective Factors for violence risk – Youth Version. Best models in terms of parsimony and fit are displayed in bold.
Mean SAVRY and SAPROF-YV Trajectories
Figure 2 presents the mean SAVRY and SAPROF-YV subscale trajectories. On average, the SAVRY historical subscale increased with 0.002 per year (SE = 0.001, p = .02), the SAVRY social/contextual subscale remained stable during trajectories in juvenile justice (β = −0.002, SE = 0.01, p = .84), the SAVRY individual subscale decreased with 0.06 per year (SE = 0.01, p < .001), and the SAVRY protective subscale increased with 0.06 per year (SE = 0.01, p < .001). On average, the SAROF-YV resilience subscale increased with 0.11 per year (SE = 0.01, p < .001), the SAPROF-YV motivational subscale increased with 0.12 per year (SE = 0.01, p < .001), the SAPROF-YV relational subscale increased with 0.05 per year (SE = 0.01, p < .001), and the SAPROF-YV external subscale increased with 0.16 per year (SE = 0.01, p < .001). Mean SAVRY and SAPROF-YV trajectories.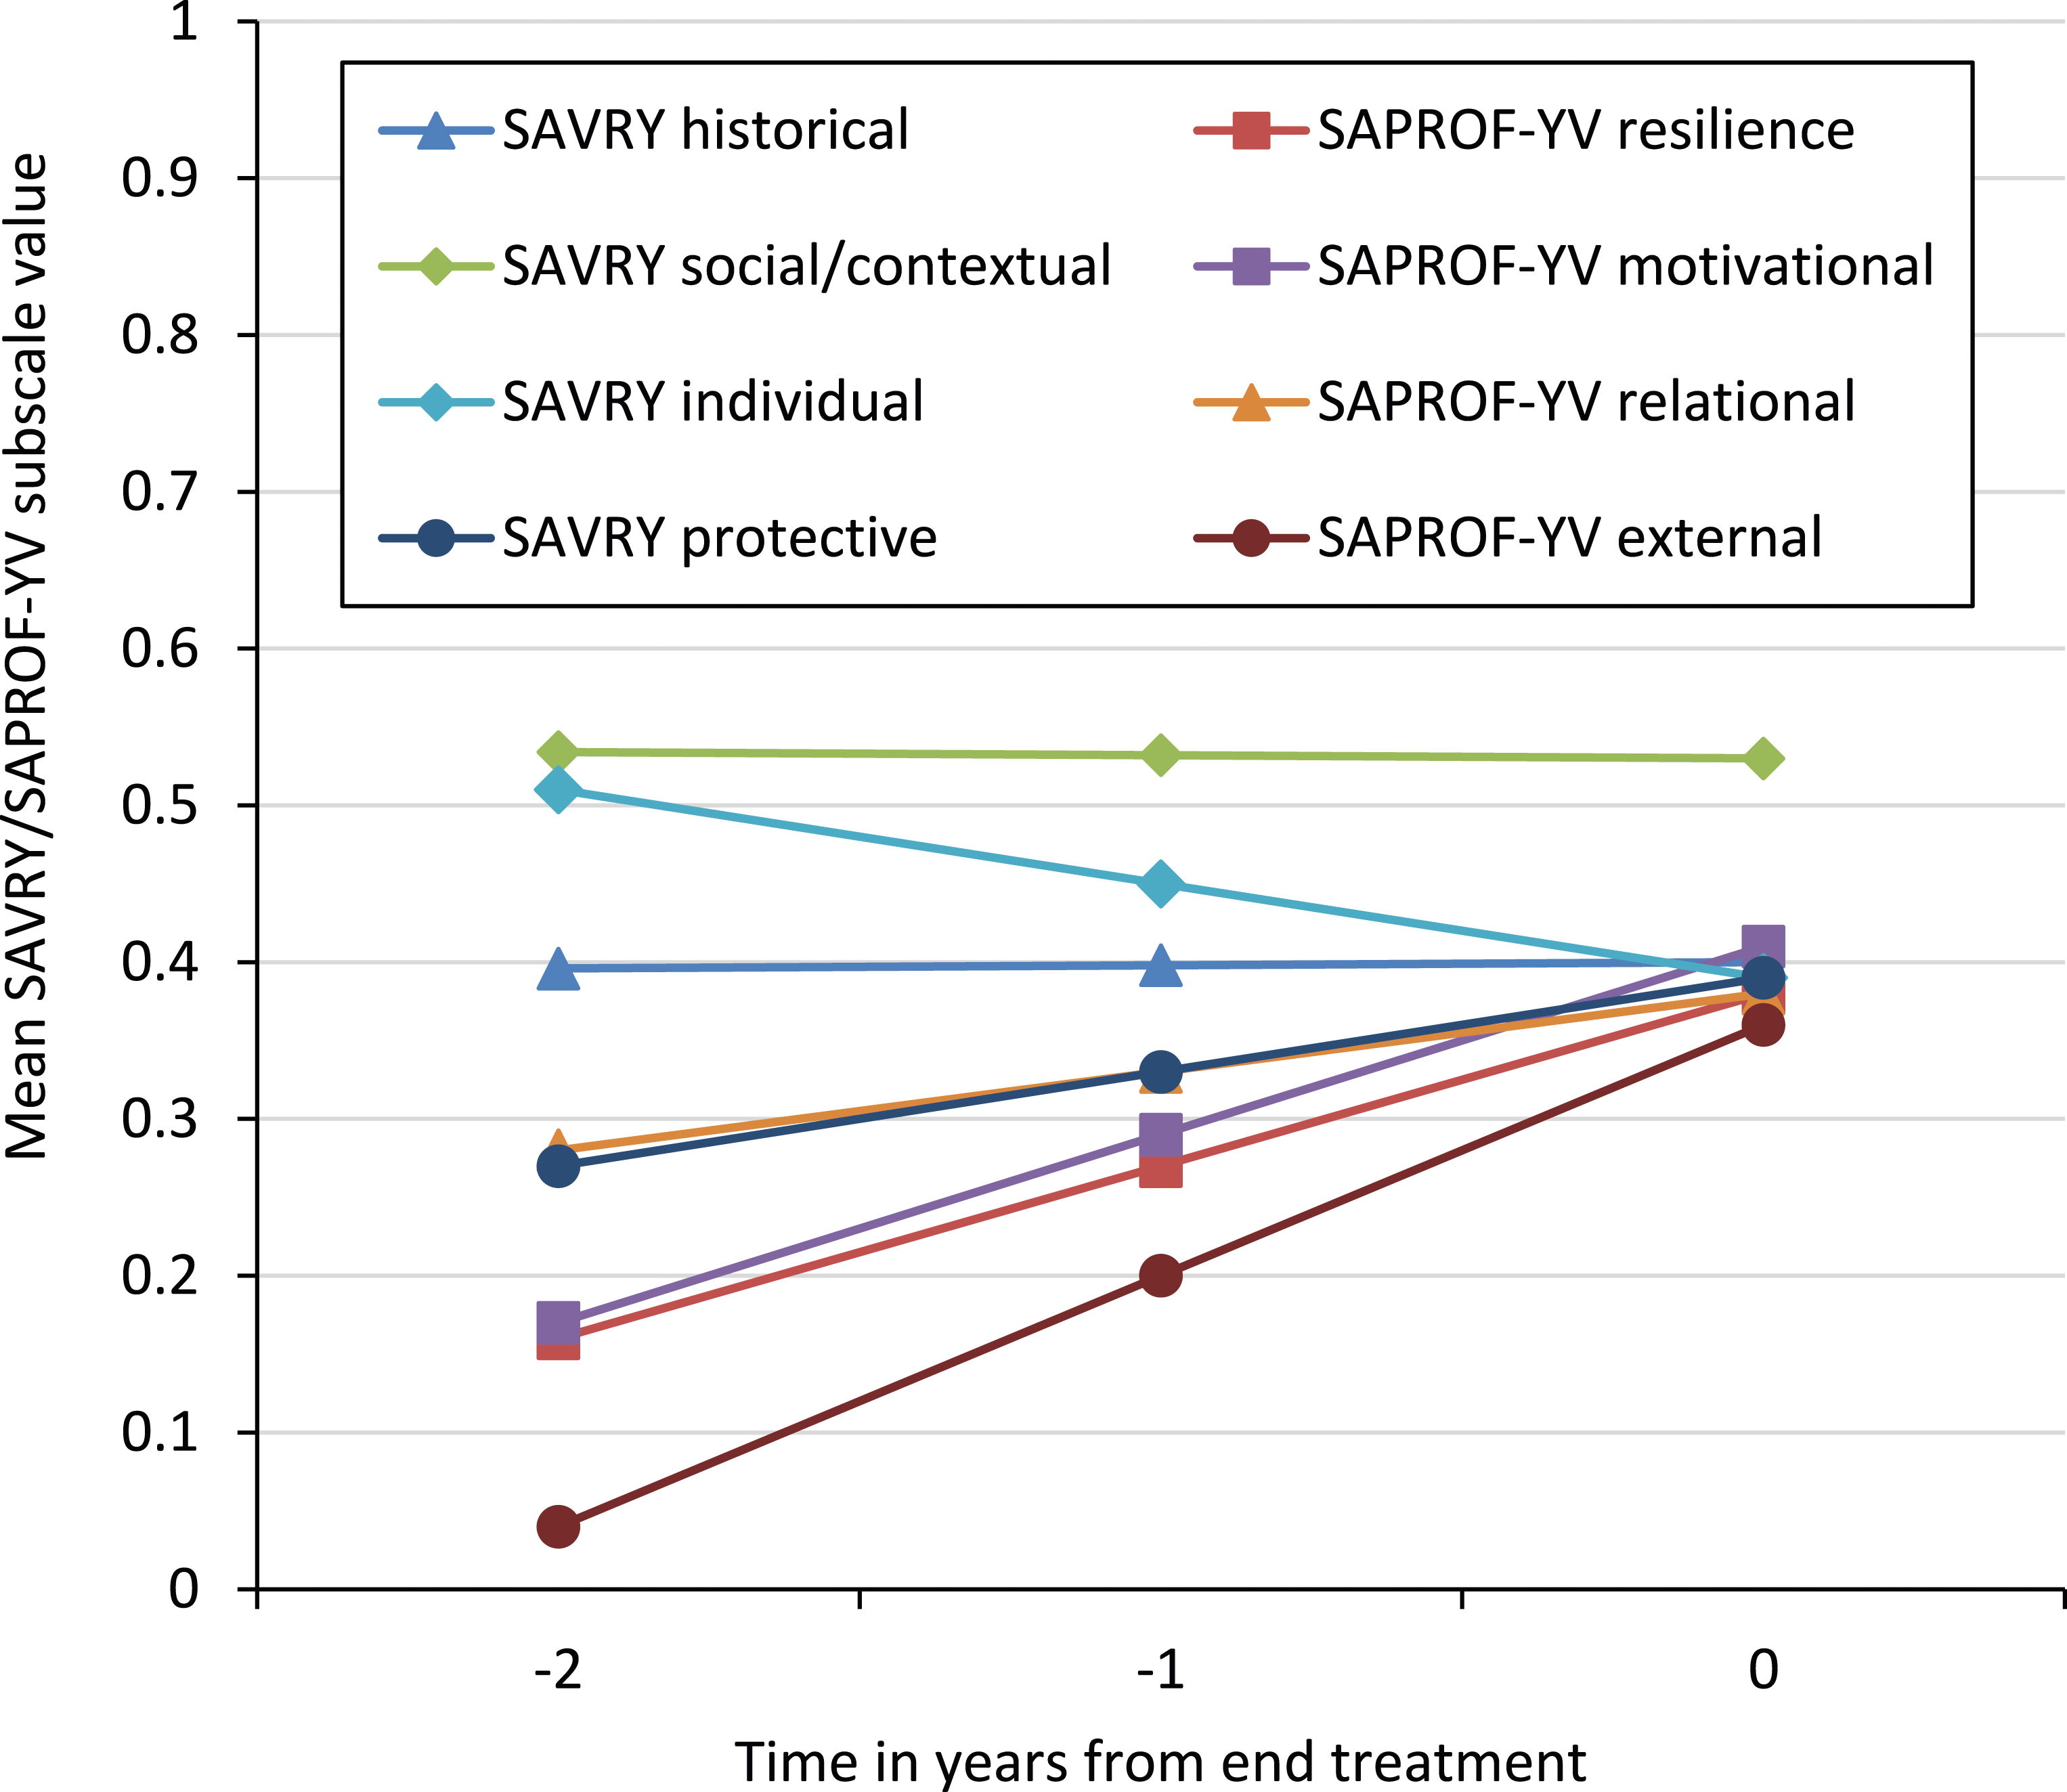
Heterogeneity in SAVRY and SAPROF-YV Trajectories
Variation in SAVRY/SAPROF-YV Subscale Trajectories Between Individuals.
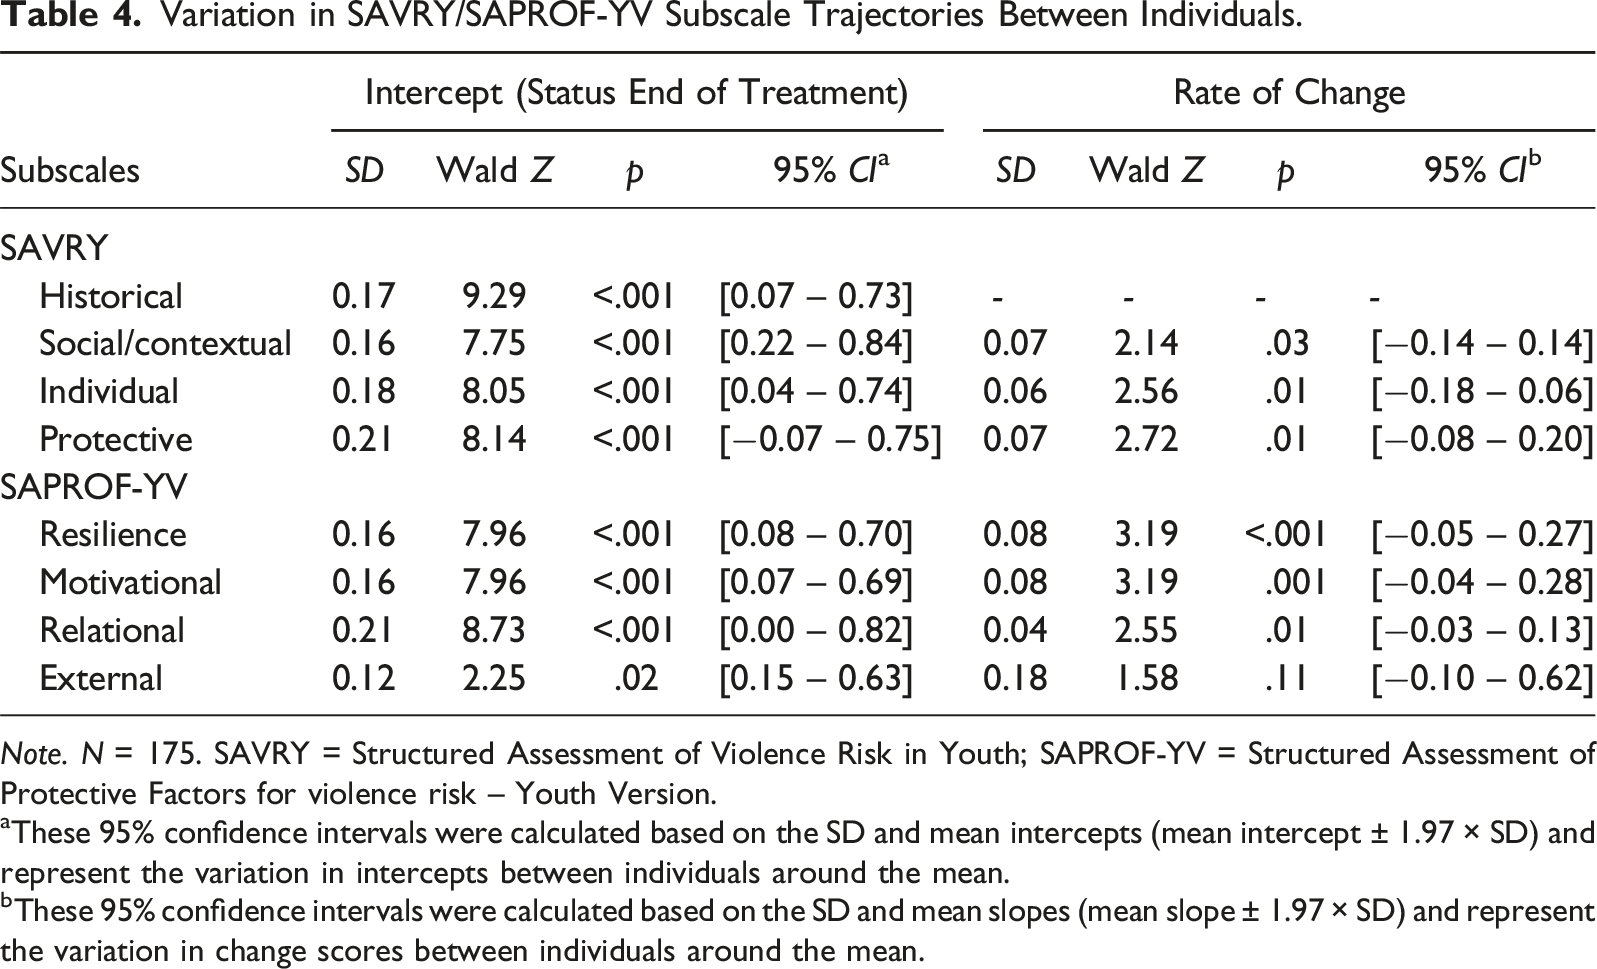
Note. N = 175. SAVRY = Structured Assessment of Violence Risk in Youth; SAPROF-YV = Structured Assessment of Protective Factors for violence risk – Youth Version.
aThese 95% confidence intervals were calculated based on the SD and mean intercepts (mean intercept ± 1.97 × SD) and represent the variation in intercepts between individuals around the mean.
bThese 95% confidence intervals were calculated based on the SD and mean slopes (mean slope ± 1.97 × SD) and represent the variation in change scores between individuals around the mean.
Incremental Predictive Validity of Change on SAVRY and SAPROF-YV Subscales
Results Logistic Regression SAVRY and SAPROF-YV Subscales Predicting 2-Year Violent Recidivism.
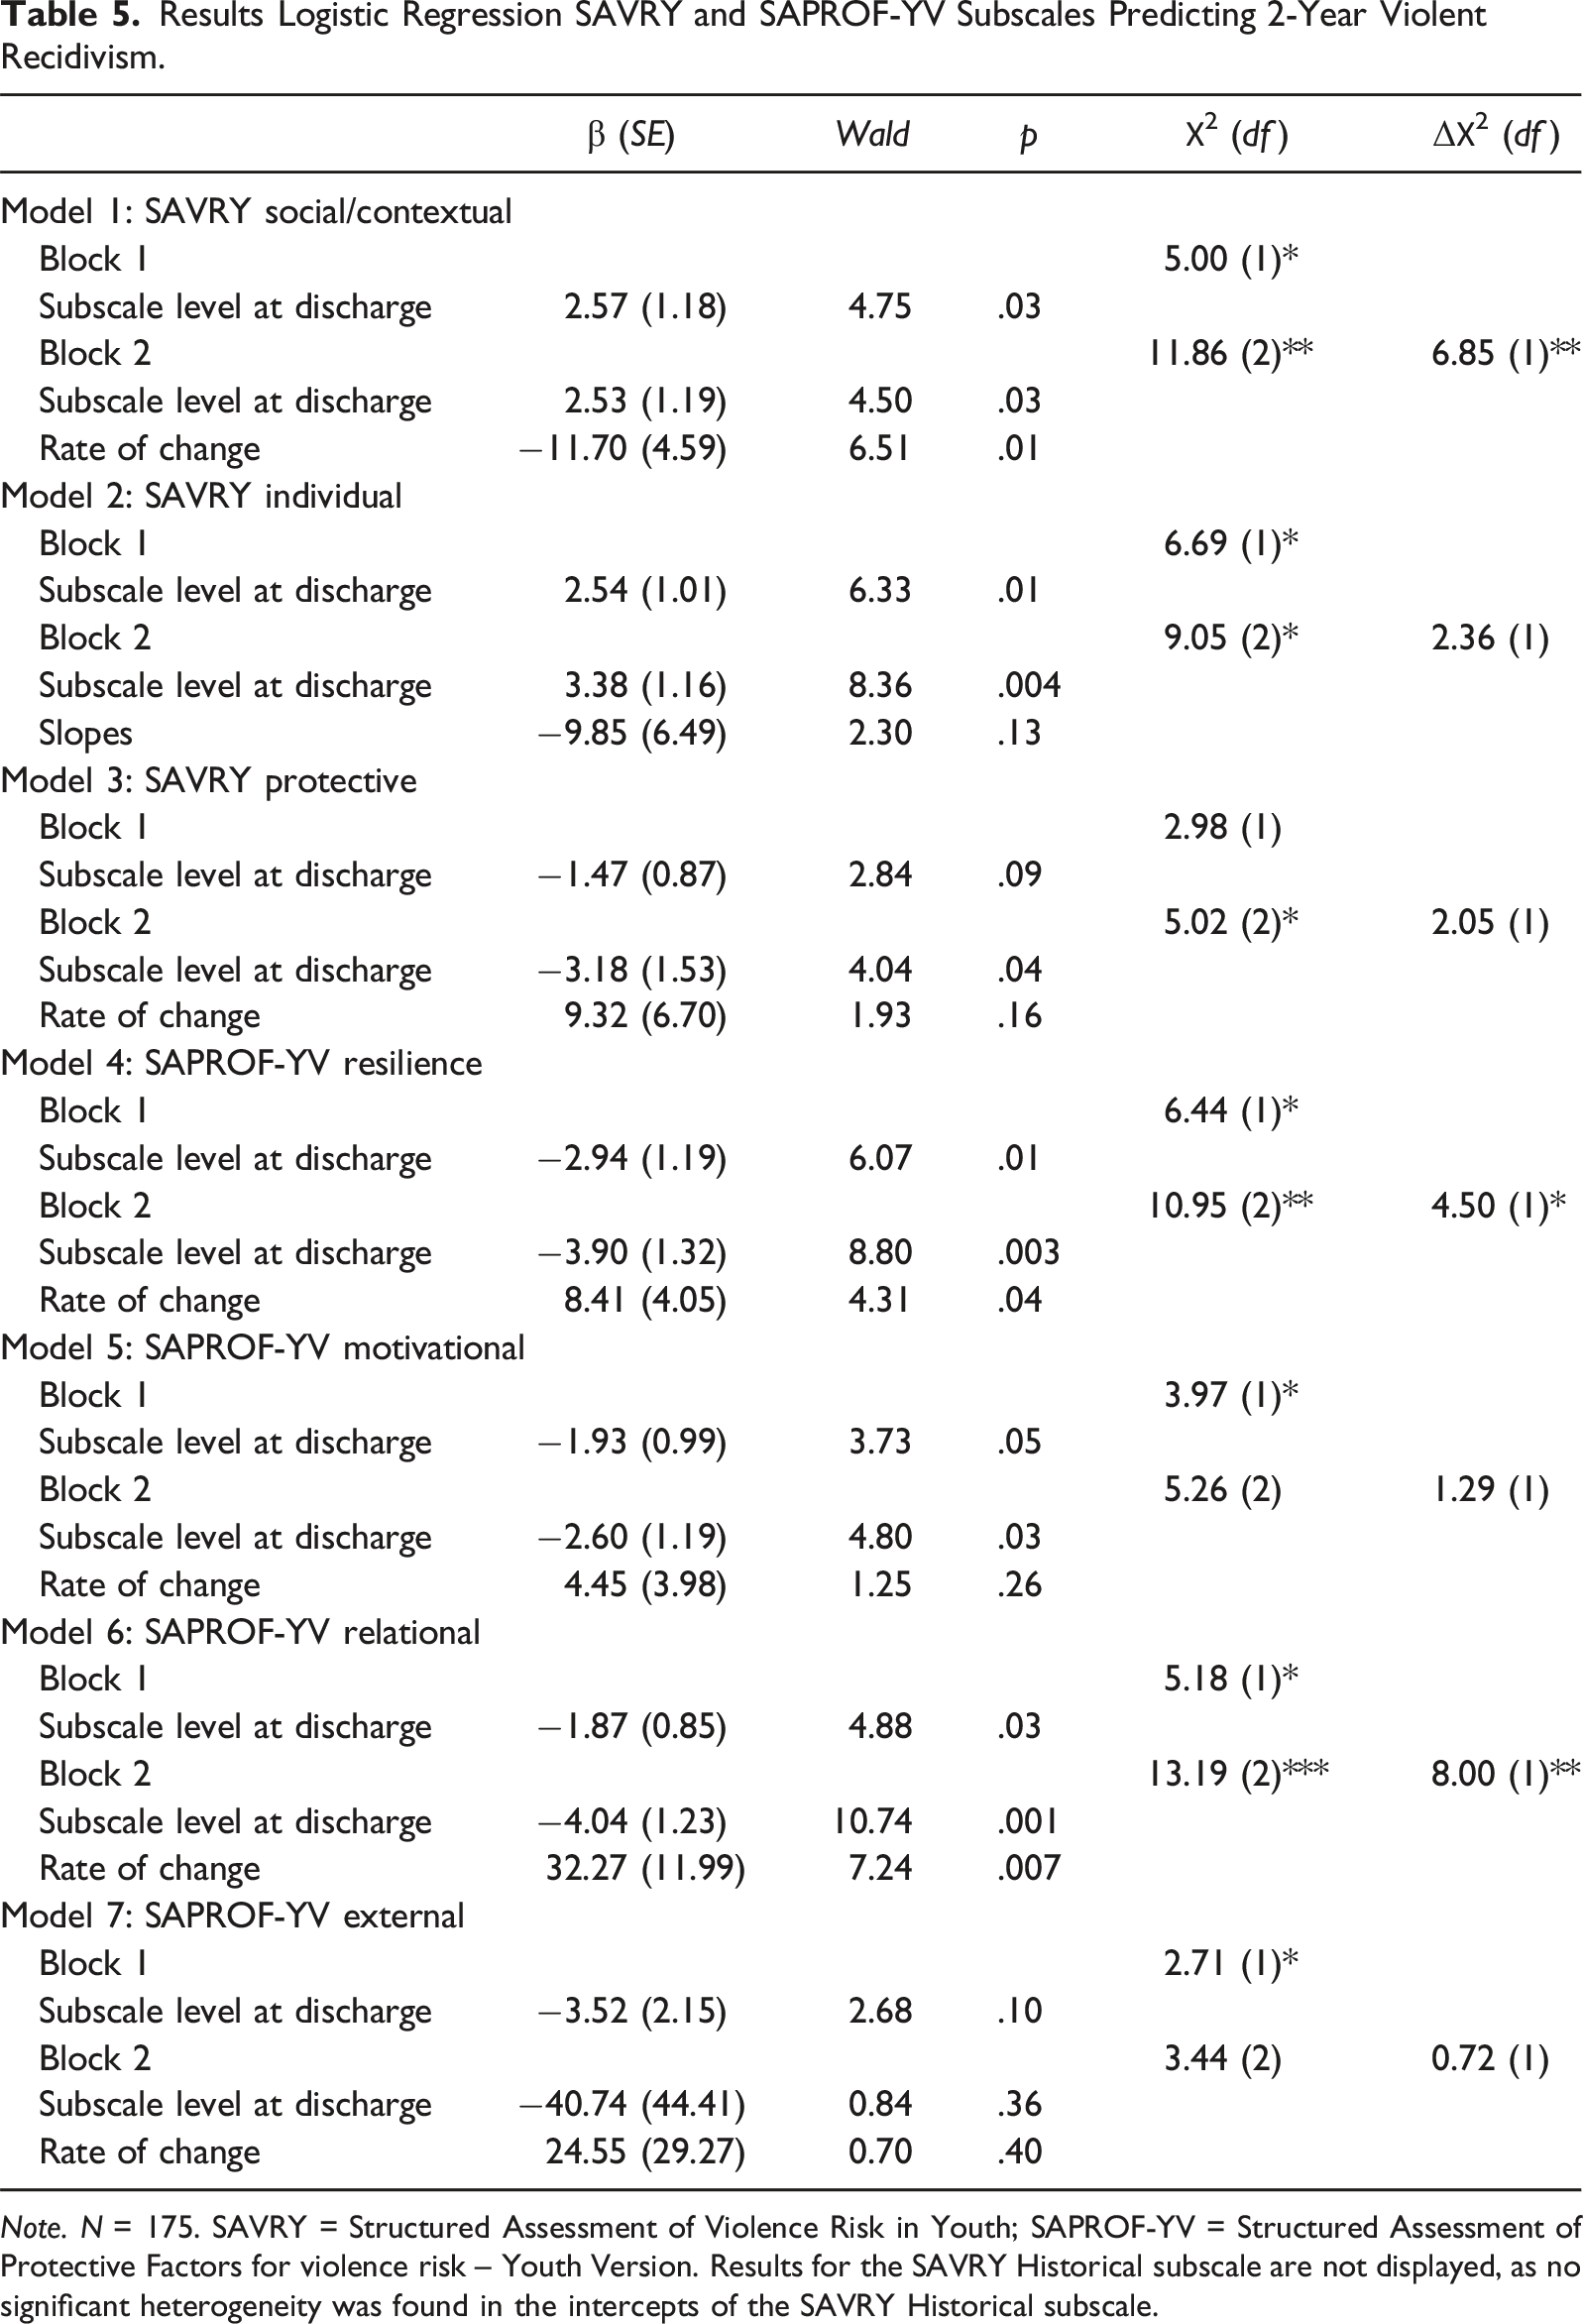
Note. N = 175. SAVRY = Structured Assessment of Violence Risk in Youth; SAPROF-YV = Structured Assessment of Protective Factors for violence risk – Youth Version. Results for the SAVRY Historical subscale are not displayed, as no significant heterogeneity was found in the intercepts of the SAVRY Historical subscale.
Discussion
The primary objective of this study was to deepen our understanding of monitoring individual change by repeatedly assessing youth with violence risk assessment tools encompassing both risk and protective factors. Prior studies that examined change trajectories on juvenile risk assessment tools mainly included risk factors, while protective factors were overwhelmingly ignored. This study examined individual change trajectories on repeated subscale assessment scores of the SAPROF-YV, in relation to changes on the SAVRY, in a heterogeneous sample of juveniles and young adults admitted to juvenile justice institutions in the Netherlands. The initial aim of this study was to examine how ratings on subscales of the SAVRY and SAPROF-YV change during trajectories in juvenile justice institutions. Further, we examined whether heterogeneity in these change trajectories could be found, and whether change ratings provided incremental predictive validity over single time-point risk assessments at discharge. The results of this study suggested that on average dynamic risk factors decreased while dynamic protective factors increased over the course of the intervention, yet the variation of this change between individuals was large. Change of several subscales provided incremental predictive validity over single assessment ratings at discharge when predicting violent recidivism after release.
Mean SAVRY and SAPROF-YV Trajectories
The findings of this study indicated that the subscale assessment ratings of the SAVRY and SAPROF-YV are changeable during trajectories in juvenile justice institutions. On group-average the dynamic SAVRY risk factors decreased during the intervention, while the SAVRY and SAPROF-YV protective factors increased during the intervention. These changes suggest an overall decline in risk level during intervention, which could be a result of effective treatment and risk management strategies (e.g., interventions following the RNR principles) or normal developmental maturation (Viljoen et al., 2012; Vincent et al., 2012). Alternatively, changes in subscale ratings during intervention could represent changes in the assessors perception of the youth (Shook & Sarri, 2007). For instance, the findings indicated that the SAVRY historical risk factors slightly worsened over time, as observed in previous research (Hilterman et al., 2018). Factors such as early initiation of violence, childhood maltreatment, and caregiver disruption were notably higher at the second assessment, possibly due to assessors having more comprehensive information about the juvenile’s history (Hilterman et al., 2014). However, perceptions can also change for the positive when youth demonstrate improved behavior. Regardless of the underlying cause of changes in risk and protection level during intervention, these results imply that repeated assessments are necessary to make an accurate estimation of risk/need level.
Based on the mean trajectories it can be concluded that on group level the SAVRY risk factors together decreased with 1 point per year (corresponding to a change in one risk factor from high to moderate in one year), and the SAVRY protective factors together increased with 0.4 point per year (corresponding to a change of one protective factor from absent to present in 2.5 years). The SAPROF-YV protective factors together increased with 10 points per year at group level (roughly corresponding to a change of three protective factors from moderately to clearly present in one year). This level of average change appears consistent with previous studies examining alterations in these risk assessment tools (Hilterman et al., 2018; Koh et al., 2021; Viljoen, Gray, Shaffer, Bhanwer, et al., 2017; Viljoen, Gray, Shaffer, Latzman, et al., 2017). Some of these studies investigated the degree of change necessary on the tool to confidently assert the meaningfulness of such changes, recognizing that all assessment tools inherently possess a degree of imprecision (e.g., reliable change; Koh et al., 2021; Viljoen, Gray, Shaffer, Bhanwer, et al., 2017). They determined that changes smaller than 10–14% on the SAVRY and 16% on the SAPROF-YV should be interpreted with caution, as they could potentially be attributable to measurement errors.
The group-average change per year appears to be relatively modest, possibly due to heterogeneity in trajectories of youth in juvenile justice institutions, as indicated by Hilterman et al., 2018, with some showing progress while others regress. This is particularly evident in the SAVRY social/contextual risk factors, where, on average, there is no significant change, but the variation is substantial, with approximately half of the sample showing improvement and the other half showing deterioration in social/contextual risk factors. Further, the modest changes (particularly in SAVRY subscales) aligns with the notion that the SAVRY might not fully capture changes occurring in clinical practice, a suggestion supported by prior studies (Hilterman et al., 2018; Koh et al., 2021; Viljoen, Gray, Shaffer, Latzman, et al., 2017; Viljoen, Shaffer, et al., 2017). Viljoen, Shaffer, et al. (2017) propose that the backwards rating of dynamic factors in the SAVRY (i.e., dynamic risk and protective factors are assessed based on past behavior) could limit its sensitivity to change and advocate for shortening the timeframe to capture more recent behavior. Moreover, Hilterman et al. (2018) suggest estimating SAVRY dynamic factors with future orientation, similar to the SAPROF-YV, potentially enhancing its dynamic properties. This is supported by the current study’s findings, showing higher change scores of SAPROF-YV compared to SAVRY (comparison of all the estimated SAVRY and SAPROF-YV slopes indicated that the slopes of the SAPROF-YV were significantly larger than the SAVRY slopes; t (1398) = 23.17, p < .001), suggesting greater sensitivity to change and suitability for repeated assessments.
Heterogeneity in SAVRY and SAPROF-YV Trajectories
An important finding in the current study was that SAVRY/SAPROF-YV subscale trajectories varied considerably between individuals (e.g., change scores for the SAVRY social/contextual subscale varied between −0.17 and 0.17, while SAVRY social/contextual subscale levels at discharge varied between 0.22 and 0.82). In line with previous studies (Hilterman et al., 2018; Kitzmiller et al., 2022), these results demonstrate that youth in juvenile justice institutions not only show different risk levels, they also change in different ways. Managing this heterogeneous group calls for a personalized approach. Different youths require different treatment and risk reduction strategies, which also requires staff with different areas of expertise or a variety of staff training offerings. Moreover, the heterogeneity in change scores implies that risk level should be re-evaluated regularly to monitor individual progress in different risk and protective areas over time which may prompt further tailoring treatment and risk reduction strategies.
With the exception of the SAVRY historical and SAPROF-YV external subscales, the amount of variation in change scores and in risk/protection levels at discharge was similar for the different SAVRY and SAPROF-YV subscales. For the SAPROF-YV external subscale, no significant heterogeneity in change scores and protection level at discharge was found. This suggests that youth in the current sample followed a similar SAPROF-YV external trajectory with almost no external protection at the start of the intervention, and increased levels of external protective factors at release. These results initially appear unexpected because it is generally anticipated that SAPROF-YV external factors would exhibit a decreasing trend as youth develop positively during interventions. That is to say, external protective factors (such as court order and pedagogical climate) diminish as they become less fitting/necessary with youth’s progress, as risk/need levels decrease. However, in the current study, all SAPROF-YV assessments were rated for an equal context, namely for the hypothetical situation outside in society. This approach was chosen to facilitate the comparison of different measurements and to disentangle changes in protection from shifts in context. However, this entails that external protective factors increase when (aftercare) measures for external protection in society are implemented. In essence, these results indicate that upon discharge, youth exhibit a shift in degree of external protection likely influenced by an intensive aftercare trajectory which is implemented at the end of the intervention.
Incremental Predictive Validity Change SAVRY/SAPROF-YV Subscales
Next, the predictive validity of change scores in relation to risk level at discharge was analyzed, by examining the incremental predictive validity of change over assessment scores at discharge. Specifically, we compared models that included only the estimated subscale levels at discharge to models that incorporated both the discharge levels and the change scores from the SAVRY and SAPROF-YV subscales. This analysis revealed that change scores from certain SAVRY and SAPROF-YV subscales, namely the SAVRY social/contextual, SAPROF-YV resilience, and SAPROF-YV relational subscales, provided incremental predictive validity over the corresponding subscale ratings at discharge. Thus, for these subscales, the addition of change scores significantly enhanced the prediction of violence risk at discharge. These findings underscore the importance of focusing on dynamic risk and protective factors in repeated risk assessment, particularly those related to interpersonal relations, resilience and contextual factors. Notably, two of the subscales showing incremental validity (SAVRY social/contextual and SAPROF-YV relational subscale) are associated with interactions with others. This aligns with previous work (Baglivio et al., 2017), which emphasizes the role of systemic interventions, such as family-centered approaches and building prosocial and supportive networks, in enhancing successful outcomes for justice involved youth.
Implications
Findings show that changes occur on the subscales of the SAVRY and SAPROF-YV during trajectories in juvenile justice institutions, yet the extent of these changes can vary greatly from person to person. These results, together with the finding that change on at least three subscales shows to significantly contribute to the prediction of recidivism, demonstrate important implications for repeated risk assessment. First, this implies that risk assessments have a fairly short expiry date, and re-assessments should be carried out at least every six months and whenever substantial changes occur (such as treatment completion, change of environment, or new steps in the reintegration process) to make the most accurate estimation of risk/need level (Viljoen, Gray, Shaffer, Bhanwer, et al., 2017).
Secondly, these findings suggest that changes in risk and protective levels during intervention could inform treatment efforts or risk reduction strategies, and that highlighting or visualizing changes in risk and protective factors should be integrated into the intervention process. Assessments conducted at the onset of interventions should inform initial treatment goals and risk reduction strategies. Ideally, youth and parents should also explicitly be engaged in this process through shared decision-making and self-report of the most critical risk and protective factors. However, it is crucial that evaluation efforts do not end here. Periodic reassessments are necessary to ascertain whether progress is being made towards intervention goals. A clear visual representation of repeated assessments can assist practitioners, youth, and parents in comprehensively presenting this information, likely enhancing engagement and motivation. For example progress on treatment goals could be displayed in clear graphs in case files. Criminogenic areas showing little to no improvement may indicate the necessity for new intervention goals or adjustments in risk reduction strategies. Furthermore, displaying changes in risk assessment can also illuminate changes in youth attributable to normal development, life events, or changes as a (direct or indirect) effect of intervention strategies (e.g., the buffering effect of protective factors).
Thirdly, the diversity in change trajectories underscores the necessity for a broad spectrum of treatment offerings and varying intensities of interventions. Studies have criticized the criminal justice system for frequently adopting a “one size fits all” approach (e.g., Taxman & Marlowe, 2006). Tailored treatment programming and case management are essential for effectively reducing recidivism rates among youth. It has become evident that youth do not exhibit uniform trajectories during trajectories in juvenile justice institutions, with some showing improvement while others display little to no progress or even deteriorating trajectories. The observation that dynamic risk factors increased over time for some youth during their trajectory, or protective factors declined over time, is concerning and carries significant policy and practice implications. It is imperative to accurately identify low-risk youth before placing them in secure juvenile justice settings and to divert them away from the criminal justice system, thereby preventing unnecessary exposure to higher-risk individuals and potentially mitigating adverse effects (Lowenkamp et al., 2016).
In addition to these clinical implications, the results of this study also offer several recommendations for future research. It is advisable for subsequent studies to independently and repeatedly assess risk factors and protective factors during interventions, and to explore the relationship between them. This contributes to a better understanding of how protective factors relate to risk factors and which protective factors have a buffering effect on certain risk factors. Future research could also investigate whether changes observed in risk assessment during intervention vary systematically by race/ethnicity (see Kitzmiller et al., 2022), or if other characteristics such as demographic characteristics (e.g., gender), initial risk profile at the start of intervention, or offense type, facilitate or inhibit the trajectories of risk and protective factors. Given the heterogeneity observed, future studies that investigate change in risk levels should not only focus on average changes but also take into account heterogeneity. It is important to study profiles of youth with similar risk/need trajectories and/or similar risk profiles (e.g., Kleeven et al., 2024), as these findings could inform agencies whether their types of services and treatment efforts align with the changes observed in risk/need levels within their population.
Strengths and Limitations
One of the strengths of this study is its unique focus on protective factors with repeated measurements, aligning with holistic and strengths-based perspectives regarding interventions for justice involved youth. Furthermore, this study included a national sample of justice-involved youth, encompassing all juvenile justice institutions in the Netherlands. Despite these strengths, the current study also showed several limitations. First, a retrospective study design was employed, which complicated the measurement of actual changes in dynamic risk and protective factors as they occurred during intervention. Rather, the changes observed in the current study reflect changes that were noted by practitioners and were documented in patient files. Further, the current sample size was relatively small. Although the sample size provided sufficient power for the analyses, this possibly impacted the generalizability of this study and the possibility to further differentiate between subgroup of individuals with specific risk profiles. Finally, the limited number of measurements per individual only allowed linear trajectories to be modeled in this study. This linear approach probably presents a simplified view of reality. It is possible that in reality the presence of risk and protective factors fluctuates over time for an individual during their trajectory, which was missed with the current methodology. Future prospective studies are advised in which risk assessment tools are repeatedly rated by practitioners in the field, with at least three or more measurements per individual for a large group of youth. When this repeated risk assessment process is accurately implemented in treatment practice, and assessments are used to inform and evaluate treatment efforts, it becomes possible to examine the extent to which change on risk assessment can measure meaningful progress during treatment and the relation thereof with the absence of violent recidivism. Moreover, such studies could investigate the effectiveness of specific interventions for accomplishing positive change on specific domains, which in turn could inform future treatment efforts. Examining risk assessment trajectories prospectively also allows the examination of the extent to which treatment programs address specific risk or protective factors, which is currently unclear (see Klepfisz et al., 2018).
Conclusion
In conclusion, trajectories based on repeated SAVRY and SAPROF-YV assessments are heterogeneous, yet mapping change on certain risk and protective factors seems to add, at least in part, significant power to the prediction of violent recidivism. Based on these results it is recommended that risk and protective factors for violence are repeatedly assessed in clinical practice in order to maintain up-to-date evaluations and monitor individual change to inform intervention efforts. Future prospective studies are needed to further examine heterogeneity in change trajectories of risk and protective factors during intervention in relation to individual risk profiles, requiring multiple repeated assessments per individual for a large sample of youth. Moreover, these studies could address how specific treatment efforts contribute to positive change for subgroups of individuals with specific problems or strengths, in order to gain further insights to enhance individually tailored interventions for justice involved youth.
Footnotes
Acknowledgments
This study was part of a larger project aimed at studying risk assessment within the Dutch juvenile justice system. Results regarding parts of this dataset are published in separate manuscripts, each focusing on a specific theme. Previous manuscripts focused on the predictive validity of juvenile risk assessment tools (Kleeven et al., 2022, 2023) and profiles based on assessment ratings (Kleeven et al., 2024). We would like to thank all Juvenile Justice Institutions for participating in the current study.
Declaration of Conflicting Interests
The author(s) declared the following potential conflicts of interest with respect to the research, authorship, and/or publication of this article: Co-authors de Vries Robbé and Hilterman are also authors of the SAPROF-YV, which could be viewed as a conflict of interest.
Funding
The author(s) disclosed receipt of the following financial support for the research, authorship, and/or publication of this article: This project was supported in part by grants from the Dutch Ministry of Justice and Security, the Academic Collaborative Youth at Risk (AWRJ), and the VU University Medical Center Department of Child- and Adolescent Psychiatry.