
Abstract
Despite efforts to incorporate protective factors or ‘strengths’ in applied risk assessments for criminal reoffending, there has been limited progress towards a consensus regarding what is meant by such terms, what effects predictors can exert, or how to describe such effects. This proof of concept study was undertaken to address those issues. A structured professional judgment tool was used to create lower and higher historical/static risk groups with a sample of 273 justice-involved male youth with sexual offenses followed over a fixed 3-year period. Using risk and protective poles to create pairs of dichotomous variables from trichotomously rated risk and protective items, risk-based exacerbation and risk-based protective effects were found. These varied in terms of whether the effect on the outcome of a new violent (including sexual) offense was larger, smaller, or absent for youth at higher or lower historical/static risk. Some of these potentially dynamic dichotomous variables were shown to have a protective (or risk) effect after controlling for both historical/static risk and that same item’s risk (or protective) effect. Some moderated the association between historical/static risk and recidivism, strengthening or reducing it. Terms for these effects and implications of incorporating strengths in research and applied practice were considered.
The once nascent evidence base for protective factors in applied risk assessment practices in forensic mental health, adult corrections, and youth justice has been growing in the past two decades (de Ruiter & Nicolls, 2011; Fortune & Ward, 2017; Langton, 2020; Langton & Worling, 2015). But the primary focus has been on the direct association between desistance from crime as a discrete outcome (the absence of a new offense) and scores on a variable purported to be a protective factor or ‘strength.’ Beyond that, there is a lack of consensus about what kind of effects protective factors or ‘strengths’ might be expected to exert. Nor is there agreement on how these effects on recidivism in applied risk assessment practices can be demonstrated or how best to describe them (Langton et al., 2022). This study involved the adoption of an approach used in criminological research to demonstrate distinct types of effects for strengths. It was undertaken to test whether trichotomous items of the sort used in applied forensic assessment practices exert various types of effects.
Items from the Structured Assessment of Violence Risk in Youth (SAVRY; Borum et al., 2006), a structured professional judgment (SPJ) tool, were selected for the study because these items tap historical/static risk as well as constructs intended to be dynamic and operationalized as either risk factors or protective factors. The validity of the SAVRY in predicting types of recidivism is well established (see Borum et al., 2021), with studies indicating predictive validity with samples of various ethnicities and from various geographical regions (cf. Ortega-Campos et al., 2017; Shepherd et al., 2014; Woods, 2013). Focusing first on groups of lower or higher historical/static risk in the present study’s sample of justice-involved youth, the methodology described by Farrington et al. (2016) was used to test for risk-based protective, risk, or mixed effects for constructs tapped by SAVRY items (these types of effects and the methodology are described below). Then analyses were undertaken to test whether distinct protective (and risk) variables had incremental validity over both historical/static risk and their corresponding risk (or protective) variable. Finally, formal tests of moderation were carried out to determine if these variables moderated the association between historical/static risk and recidivism, strengthening it (essentially exacerbating the risk effect already present in the static index) or reducing it (representing an interactive protective effect). In what follows, the inclusive term ‘strength’ is used to refer to variables that exert one or more types of effect (e.g., a main or direct effect, a risk-based effect, or an interactive/moderating effect) that lowers the likelihood of reoffending.
The evidence base supports a focus in applied forensic assessment practices on the direct effect of strengths in lowering the rate of recidivism, particularly practices representing the SPJ approach. Frequently this involves summing of item ratings or a simple counting of multiple purported strengths for a cumulative effect. That evidence base attests to the promise of higher predictive accuracy. It also has the potential to improve clinical utility for service planning and targeted interventions in contrast to an exclusive reliance on assessment tools comprised only of risk factors (Langton et al., 2022). But a major problem with this focus on a direct effect for strengths is that it does not provide a clear or compelling answer to the fundamental question about what strengths actually are. It also ignores the possibility that there are additional types of effects that strengths may exert that would be important to demonstrate with applied forensic assessment practices. If the field is to move beyond a focus on a simple direct effect for strengths, it will be necessary to investigate the possible effects of a strength in conjunction with a validated index of risk. It will also be necessary to consider possible conceptualizations of strength as more than simply the converse of a risk factor, that is, the opposite pole to that of risk along a single dimension for a construct or domain. The present study was undertaken for this purpose.
The Approach of Farrington and Colleagues to Investigating Strengths
In contrast to the current state in applied forensic assessment practices, progress in the field of criminology offers both a terminology and a data analytic approach to demonstrating the different ways that a variable can function as a strength. Of particular note in this regard is the work of Farrington and his colleagues using the longitudinal datasets from the Cambridge Study in Delinquent Development (CSDD) and the Pittsburg Youth Study (e.g., Farrington et al., 2008; Farrington et al., 2016; Farrington & Ttofi, 2011; Jolliffe et al., 2016). To illustrate, Farrington et al. (2016) first divided focal variables’ scores into a top quartile, middle half, and bottom quartile. Then they calculated pairs of odds ratios (OR) by creating dichotomous variables from these trichotomies: a risk OR using scores in the ‘worst’ quartile, expected to be associated with increased likelihood of offending, and the remaining scores combined; and a promotive OR using scores in the ‘best’ quartile, expected to be associated with a reduced likelihood of offending, and the remaining scores combined, with an OR ≥1.7 considered “substantial” (Farrington et al., 2016, p. 66). As well as these pairs of ORs, an increase or decrease in percentage points ≥10 from the base rate of convictions at the end of the follow-up period was used to determine whether each variable was a risk factor, promotive factor, or a mixed factor (that is, both poles shown to exert an effect). All three types were found in both datasets. The same methodological approach is adopted in the present proof of concept study.
The trichotomization of the variables and then their dichotomization to calculate pairs of ORs for each variable was important. As Farrington et al. (2016) explained, “This makes it easy to study interaction effects, to identify persons with multiple risk factors, to specify how outcomes vary with the number of risk factors, and to communicate results to policy makers and practitioners as well as to researchers (Farrington & Loeber, 2000). Dichotomization also deals with the problem of nonlinear relationships, does not necessarily result in a decrease in the measured strength of associations, and the order of importance of risk factors is usually similar in dichotomous and continuous analyses” (p. 63; see also Farrington, 1997). In light of this, for this proof of concept study, dichotomization of trichotomous variables was adopted and tests of moderation restricted to two-way interactions.
Only three studies have been reported in the peer-reviewed literature that have involved the adoption of this approach explicitly to investigate possible risk, promotive, or mixed factors with SPJ tools used in applied forensic assessment practice with adjudicated samples. Langton et al. (2024) reported risk, promotive, and mixed effects on different types of recidivism among justice-involved youth using pairs of dichotomized variables for items from the Structured Assessment of PROtective Factors (SAPROF; de Vogel et al., 2012), even though these items were all operationalized by the tool developers as protective factors. Langton, Ranjit, and Worling (2023) reported risk, promotive, and mixed effects on types of recidivism with justice-involved youth using pairs of dichotomized variables for the Risk Factor items of the SAVRY and promotive and mixed effects for its Protective Factor items. Li et al. (2019) used pairs of dichotomous variables for items from the Youth Level of Service/Case Management Inventory (YLS/CMI 2.0; Hoge & Andrews, 2011) and the Structured Assessment of PROtective Factors – Youth Version (SAPROF-YV; de Vries Robbé et al., 2015). Their findings also suggested risk, promotive, and mixed effects, this time for a more inclusive outcome of probation success/failure, among justice-involved youth.
As well as their risk, promotive, and mixed factors, Farrington et al. (2016) examined strength effects of the same variables with subsets within the CSDD dataset of risk-absent (or low risk) and risk-present (or high risk) youth, using variables in that dataset shown to be risk factors to create the subsets. In this way, they were able to demonstrate that some variables in the risk-present (or high risk) subset of youth functioned as protective factors (‘protective’ rather than promotive because they were now exerting an effect in a risk-defined/risk-present group); these they labeled “risk-based protective factor[s]” (p. 64) (see also Farrington & Ttofi, 2011; Jolliffe et al., 2016). Farrington et al. didn’t examine risk effects within these subsets but they did test for interactions between various combinations of risks and strengths, and they were able to demonstrate that some strengths moderated the effect of certain risks (reducing the association); these they labelled “interactive protective factor[s]” (p. 64).
To date, no studies with adjudicated samples of either adults or adolescents have explicitly adopted the approach of Farrington and his colleagues to investigate risk-based protective effects and interactive protective effects specifically on a new criminal offense outcome using SPJ tools of the sort employed in applied forensic assessment practices. But three studies merit critical discussion here because item or total scores on assessment tools used in applied forensic practice were analyzed in each, and results reported in each can be revisited in terms of tests for risk-based protective effects and interactive protective effects.
Studies of Risk-Based Effects With SPJ Items and Item Totals
In their investigation with three samples of justice-involved male youth in the Netherlands (ns of 111 followed up for between 1 and 35 months; 66 followed up for between 7 and 43 months; and 47 followed up for between 3 and 28 months), Lodewijks et al. (2010) compared the rates of violent recidivism in pairs of subsets in each sample. The subsets were created in each of the three samples by using various counts of individual SAVRY protective factor items (e.g., all absent or one or more present) and a median split on the summed total of SAVRY Social/Contextual and Individual/Clinical Risk Factor items (a dichotomy which represents the ‘risk base’ for the purpose of the present discussion although the authors did not explicitly use that term). They found statistically significant differences between rates of recidivism in the absent versus present protective factors subsets among those in the higher risk group in all three samples and between the zero-or-one versus two-or-more protective factors subsets among those in the lower risk group in two of the three samples.
These findings are consistent with a risk-based protective effect but not an interactive protective effect, to use Farrington et al.’s (2016) term, because a statistical test for moderation was not reported. They demonstrate that strengths effects may vary across groups at different levels of risk (here, dichotomized from a summed total for a continuous variable). But neither a fixed follow-up period nor survival analyses were used to manage the unequal follow-up times within the samples. Unfortunately, it is not possible on the basis of these data to discern which conceptually distinct strengths exerted the effects given the use of counts/categories of combined protective factors, leaving implications for targeted interventions less clear.
de Vries Robbé et al. (2013) used fixed follow-up periods of 1 and 3 years and an average long-term follow-up of 11.1 years with their sample of Dutch adult male forensic psychiatric patients. Using case files, the Historical Clinical Risk-20’s (HCR-20; Webster et al., 1997) final risk judgment (an ordinal rating of low, moderate or high) was used as the ‘risk base’ for these patients (but, again, the authors did not explicitly use that term). The SAPROF’s final protection judgment (also an ordinal rating of low, moderate, or high) was also made to test for protective effects. Although results were not discussed in terms of ‘risk-based effects,’ the findings were consistent with risk-based protective effects. On the basis of ORs, moderate or high protection judgments were found to exert a protective effect for the moderate risk group (n = 103) in terms of conviction for a new violent (including sexual) offense over all three follow-up periods. A similar pattern was found with the moderate protection judgment for the high risk group (n = 54).
Although survival analyses were not reported by de Vries Robbé et al. (2013) for the long-term follow-up despite its unequal times at risk within the sample, the use of fixed follow-up times in that study is notable. As well as findings that can be revisited as evidence of risk-based effects, de Vries Robbé et al. reported three statistical tests of moderation, one for each follow-up period. These represent tests for what Farrington et al. (2016) described as an interactive protective factor. For one period, the 3-year follow-up, the interaction term for summed totals for the HCR-20 and the SAPROF was statistically significant. But the interaction wasn’t formally probed or depicted to determine if a protective effect was evident, and post hoc testing indicated multicollinearity. In any case, as with the study by Lodewijks et al. (2010) using the SAVRY, de Vries Robbé et al.’s use of summed totals and summary judgment ratings mean that it is not possible to determine which items, and their underlying constructs or domains, account for the effects. So conceptual clarity is lacking about which strengths exert what effects on or in the presence of which risks.
The study by Li et al. (2019), mentioned above, is the only study in the peer-reviewed literature to have explicitly adopted the approach of Farrington and his colleagues to test for risk-based and interactive protective effects. But their outcome was probation success/failure, a more inclusive outcome than a specific new criminal offense outcome. As was the case with Farrington et al.’s (2016) risk-based analyses, Li et al.’s analyses were focused on positive effects of strengths only (“boost[ing]” the effect of a strength base or “buffering” the effect of a risk base; p. 204). The sample was 701 adolescents on probation in Singapore, 87% of whom were male, 6% of whom had a sexual offense. The tools used were the SAPROF-YV and the YLS/CMI. The length of the follow-up period was not reported. Li et al. used a Protective Factor, the Pedagogical Climate (PC) item from the SAPROF-YV, to form a risk base as well as a strength base, having established on the basis of this item’s risk and promotive ORs, that it exerted a mixed effect for probation success/failure in the full sample. For the low PC-strength youth (the risk base), Li et al. reported a statistically significant buffering effect for seven of 11 SAPROF-YV items and four of eight YLS/CMI domain scores. This is consistent with what Farrington et al. (2016) described as a risk-based protective factor and what Langton et al. (2022) described as a risk-based strength (protective) effect. For the high PC-strength youth, Li et al. reported statistically significant booster effects for ten of 11 SAPROF-YV items and for seven of eight YLS/CMI domain scores. This is consistent with what Langton et al. (2022) described as a strength-based strength (enhancement) effect. Tests of moderation to identify Farrington et al.’s interactive protective factors were not statistically significant.
Li et al.’s (2019) study is important because of their adoption of Farrington et al.’s (2016) approach to investigating strengths and because of their item-level and domain-level analyses, which represents a step forward in terms of conceptual clarity about which strengths exert a protective effect in the presence of a clearly operationalized risk or strength. But it remains the case that no studies have yet explicitly adopted Farrington et al.’s approach to investigate the potential range of effects that strengths and risks exert over violent recidivism in the presence of an established index of risk. The present study is designed to do this, and central to this investigation are tests of whether strengths and risks have incremental validity and/or serve a moderating function. There are studies that have reported results of tests of incremental validity and of moderation with tool totals and it is important to explain how the tests undertaken in the present study should be understood in relation to that work.
Incremental Validity and Tests of Moderation With Applied Forensic Assessment Tools
A small but growing number of studies have included formal tests of the incremental validity of an index of strength over an index of risk, with mixed findings reported (cf. Chu et al., 2016; de Vries Robbé et al., 2013; Eisenberg et al., 2022; Kleeven et al., 2022; Klein et al., 2015; Langton, Awrey, & Worling, 2023; Soderstrom et al., 2020; Van der Put & Asscher, 2015). Studies have also included formal tests of interactions to determine if an index of strength moderates the association between an index of risk and a criminal recidivism outcome, again with mixed findings reported (cf. Brown et al., 2020; de Vries Robbé et al., 2013; Langton, Awrey, & Worling, 2023; Li et al., 2019; Lowder et al., 2017; Soderstrom et al., 2020). Asking whether an index of strength accounts for a unique portion of the variance in predicting a criminal recidivism outcome beyond that accounted for by an index of risk with a sample requires a formal test of incremental validity, which Farrington et al. (2016) did not explicitly consider. It is not the same question as whether an index of strength exerts an effect for a distinct risk-defined/risk-present subset within a sample, involving a test for a risk-based effect, which Farrington and his colleagues did explicitly consider (although, beyond their focus on strengths, they did not consider whether various risks exert an effect for a distinct risk-defined/risk-present subset within a sample). Further, investigating a risk-based effect in a subset within a sample is not the same as asking whether an index of strength moderates the association between an index of risk and violent recidivism with the sample. This requires a formal test of moderation, which Farrington and his colleagues did explicitly consider although they used ANOVAs for the purpose. They did not consider whether such interactions had incremental validity over an established index of risk, which is certainly a relevant consideration in research informing applied forensic assessment practices. Addressing each of these questions in a single investigation, as was undertaken in the present study, has the potential to more fully elucidate the potential range of effects on violent recidivism that strengths and risks might be shown to have with justice-involved youth.
Method
Participants
The sample has been described elsewhere (Langton, Ranjit, & Worling, 2023). It consisted of 273 male adolescents from a major urban area in Southern Ontario. These youth had been referred between 2003 and 2014 for specialized assessment services for youth who had sexually abused others. All were at risk to reoffend for a fixed follow-up period of three years. Of these, 8% had one or more prior convictions for a violent (nonsexual) offense. Two percent had two or more prior convictions for a sexual offense, 14% had one prior sexual offense conviction, and 84% had no prior conviction for a sexual offense. Twenty two percent had five or more prior acts of nonviolent offending, 44% had one to five, and 34% had none. The mean age when the follow-up period started was 15.93 years old (SD = 1.54 years; range = 12.30–18.91 years old; all had committed their index offense while under 18 years of age). Data on ethnic origins were available for 131 of these 273 participants; using Statistics Canada categories, 47% of these were of European origin, 16% were of Caribbean origin, 13% were of African origin (Central, North, South, East, West), 10% were of Asian origin (South, East and South East, West Central and Middle Eastern), 8% were of Latin, Central and South American origin, and 6% were of First Nations, Indigenous, Inuit, or Métis origin. Ethnicity and other diversity issues are not further investigated in this study but are examined in a separate study in preparation.
Procedure
Research ethics clearance was secured from the first author’s institutional affiliations and permissions obtained from the relevant government ministries. Three research assistants (RAs), all senior undergraduate students, were trained over a 2-week period by the first and second authors to rate/code all independent variables. The RAs then independently rated all variables for 23 archived cases, none of which had been used in training, for the purposes of calculating indices of inter-rater reliability. The archived case files for the sample were accessed and the RAs participated in weekly group supervision sessions for the duration of their work. The files contained all available assessment reports written by professionals involved in each case as well as school and police/court documentation. Almost all cases had only one comprehensive mental health-and-risk assessment report completed with the youth, and all youth were in the community at the time of that assessment. It was the date of that report that was used as the start of the at-risk period. Only those materials on file before the beginning of the follow-up period at risk for re-offense were included in the version of each case file prepared for coding. No information about recidivism outcomes was contained in these files.
Measures
The 24 SAVRY Risk Factor items were rated for participants’ cases, per the manual (Borum et al., 2006). The criterion-anchored trichotomous ordinal scale of 0, 1, or 2 was used: zero was construed as the ‘best’ rating for a Risk Factor item, and 2 construed as the ‘worst’ rating. For the six Protective Factor items, the criterion-anchored dichotomy was used: 2 represented ‘Present,’ which was the ‘best’ rating; zero represented ‘Absent,’ which was the ‘worst’ rating; with 1 representing an additional ‘Possibly or partially present’ rating to make these items trichotomous also. For the purposes of the present study, the summed total of the 10 Historical Risk Factor items (history of violence; history of nonviolence; early initiation of violence; past supervision/intervention failures; history of self-harm or suicide attempts; exposure to violence in the home; childhood history of maltreatment; parental/caregiver criminality; early caregiver disruption; poor school achievement) was used to generate the dichotomous risk base variable, and the effects of each of the ten Risk Factor items from the Social/Contextual Risk Factors set and the Individual/Clinical Risk Factors set were tested along with two of the Protective Factors items. These 12 items were selected on the basis of their ORs; to reduce the likelihood of a Type I error, analyses were undertaken with only those SAVRY items for which the protective OR or the risk OR was ≥2.48 for the sample, per findings with this sample reported by Langton, Ranjit, and Worling (2023). An OR of 2.48 corresponds to a Cohen’s d effect size of 0.50 using Lenhard and Lenhard (2016). Items for which any cell count was zero were excluded.
Intraclass correlation coefficients (ICC) were calculated to check inter-rater reliability using a subset of 23 participants’ cases, coded independently by three raters: the single measures consistency ICC for a two-way random effects model for the Historical Risk Factor items summed total was .82 (in the range described as ‘excellent’ by Cicchetti, 1994). Of the twelve individual items selected based on their established predictive validity with this sample, the single measures absolute ICCs for a two-way random effects model for ICCs for eight fell in the range described as ‘good’ by Cicchetti (Risk Factor items #11, 15, 16, 18, 20–22, and Protective Factor item #P3: ICCs from .60 to .72), with those for two falling in the ‘fair’ range (Risk Factor items #23, and 24; ICCs of .47 and .42), and the ICCs for two in the ‘poor’ range (Risk Factor #17, and Protective Factor item #P4; ICCs of .38).
Outcome
Four official sources of information were used to generate as comprehensive a measure of official outcomes as possible: The Canadian Police Information Centre records, a national database of criminal convictions provided by the Royal Canadian Mounted Police; data from both the youth and adult offender tracking information systems provided by the Ministry of Community Safety and Correctional Services; and case files provided by the Ministry of Children and Youth Services. Outcomes were dichotomously coded. New offenses were coded if documented in the follow-up period as convictions in any of the first three sources or an officially confirmed new incident in the fourth source. A new violent (including sexual) offense was used as the dependent variable in the analyses described below because the SAVRY was designed for the purpose of assessing risk of this outcome.
Data Analytic Strategy
To investigate risk-based effects, two sets of logistic regression analyses were run, one set with participants with Historical Risk Factors summed scores ≤50th percentile (≤8, M = 5.30, SD = 1.94; the ‘lower risk’ group) and the other set with participants with Historical Risk Factors summed scores >50th percentile (≥9, M = 11.53, SD = 2.24; the ‘higher risk’ group). Calculated for each set were the risk ORs and protective ORs for each of 12 items; this involved changing each item’s three possible ratings into a dichotomy. For the risk OR: the ‘worst’ rating versus the other two ratings combined as the ‘rest.’ For the protective OR: the ‘best’ rating versus the other two ratings combined as the ‘rest.’ The labeling of effects was informed by Farrington et al.’s (2016) two rules of thumb: ORs ≥ 1.7 and new offense rates ≥10 percentage points different from base rates. But, to minimize the impact of floor effects due to low base rates, greater emphasis was placed in the present study on the ORs, with percentage point differences that differed from the base rates by < 10 percentage points taken into consideration.
To investigate incremental validity and interaction effects, hierarchical logistic regression models were tested; the dichotomous Historical Risk Factor variable, split at the 50th percentile, was entered in step 1; the dichotomous variable to calculate the protective OR (or risk OR in a separate model) for each selected item was entered in the second step of separate models; and the dichotomous variable to calculate the risk OR (or protective OR in a separate model) for each selected item was entered in the third step of each model. In an alternate third step, the interaction between the dichotomous Historical Risk Factor variable and the dichotomous variable to calculate the protective OR (or risk OR) was entered. Receiver Operating Characteristic (ROC) analyses were undertaken to generate Areas Under the Curve (AUC) to demonstrate the predictive accuracy of the dichotomous Historical Risk Factor variable as the risk base, and as an index of predictive accuracy for each step in each of the hierarchical logistic regression models. No statistical correction was employed to reduce Type I errors but effect sizes were emphasized throughout.
Results
Among the 273 adolescents, 18% of 268 of these adolescents committed a new violent (including sexual) offense in the fixed 3-year follow-up period. The number of adolescents is slightly lower than the total sample size because, for some adolescents, their conviction counted in a distinct category of offense (for example, a conviction for a drug crime) resulted in less than three years of time at risk and therefore their exclusion (because of time spent back in custody, per a custodial sentence for the drug crime) from analyses with the focal category of a new violent (including sexual) offense. The AUC for the dichotomous Historical Risk Factor variable was .66, p < .001, 95% CI [.58, .73], corresponding to a Cohen’s d effect size in the medium range (per Rice & Harris, 2005). Multicollinearity was not an issue, with VIFs for all dichotomous variables ≤1.44.
Risk-Based Effects
Protective and Risk Effects of Dichotomized SAVRY Items for a New Violent (Including Sexual) Offense Using the Dichotomized Historical/Static Risk Factors Variable as the Risk Base.
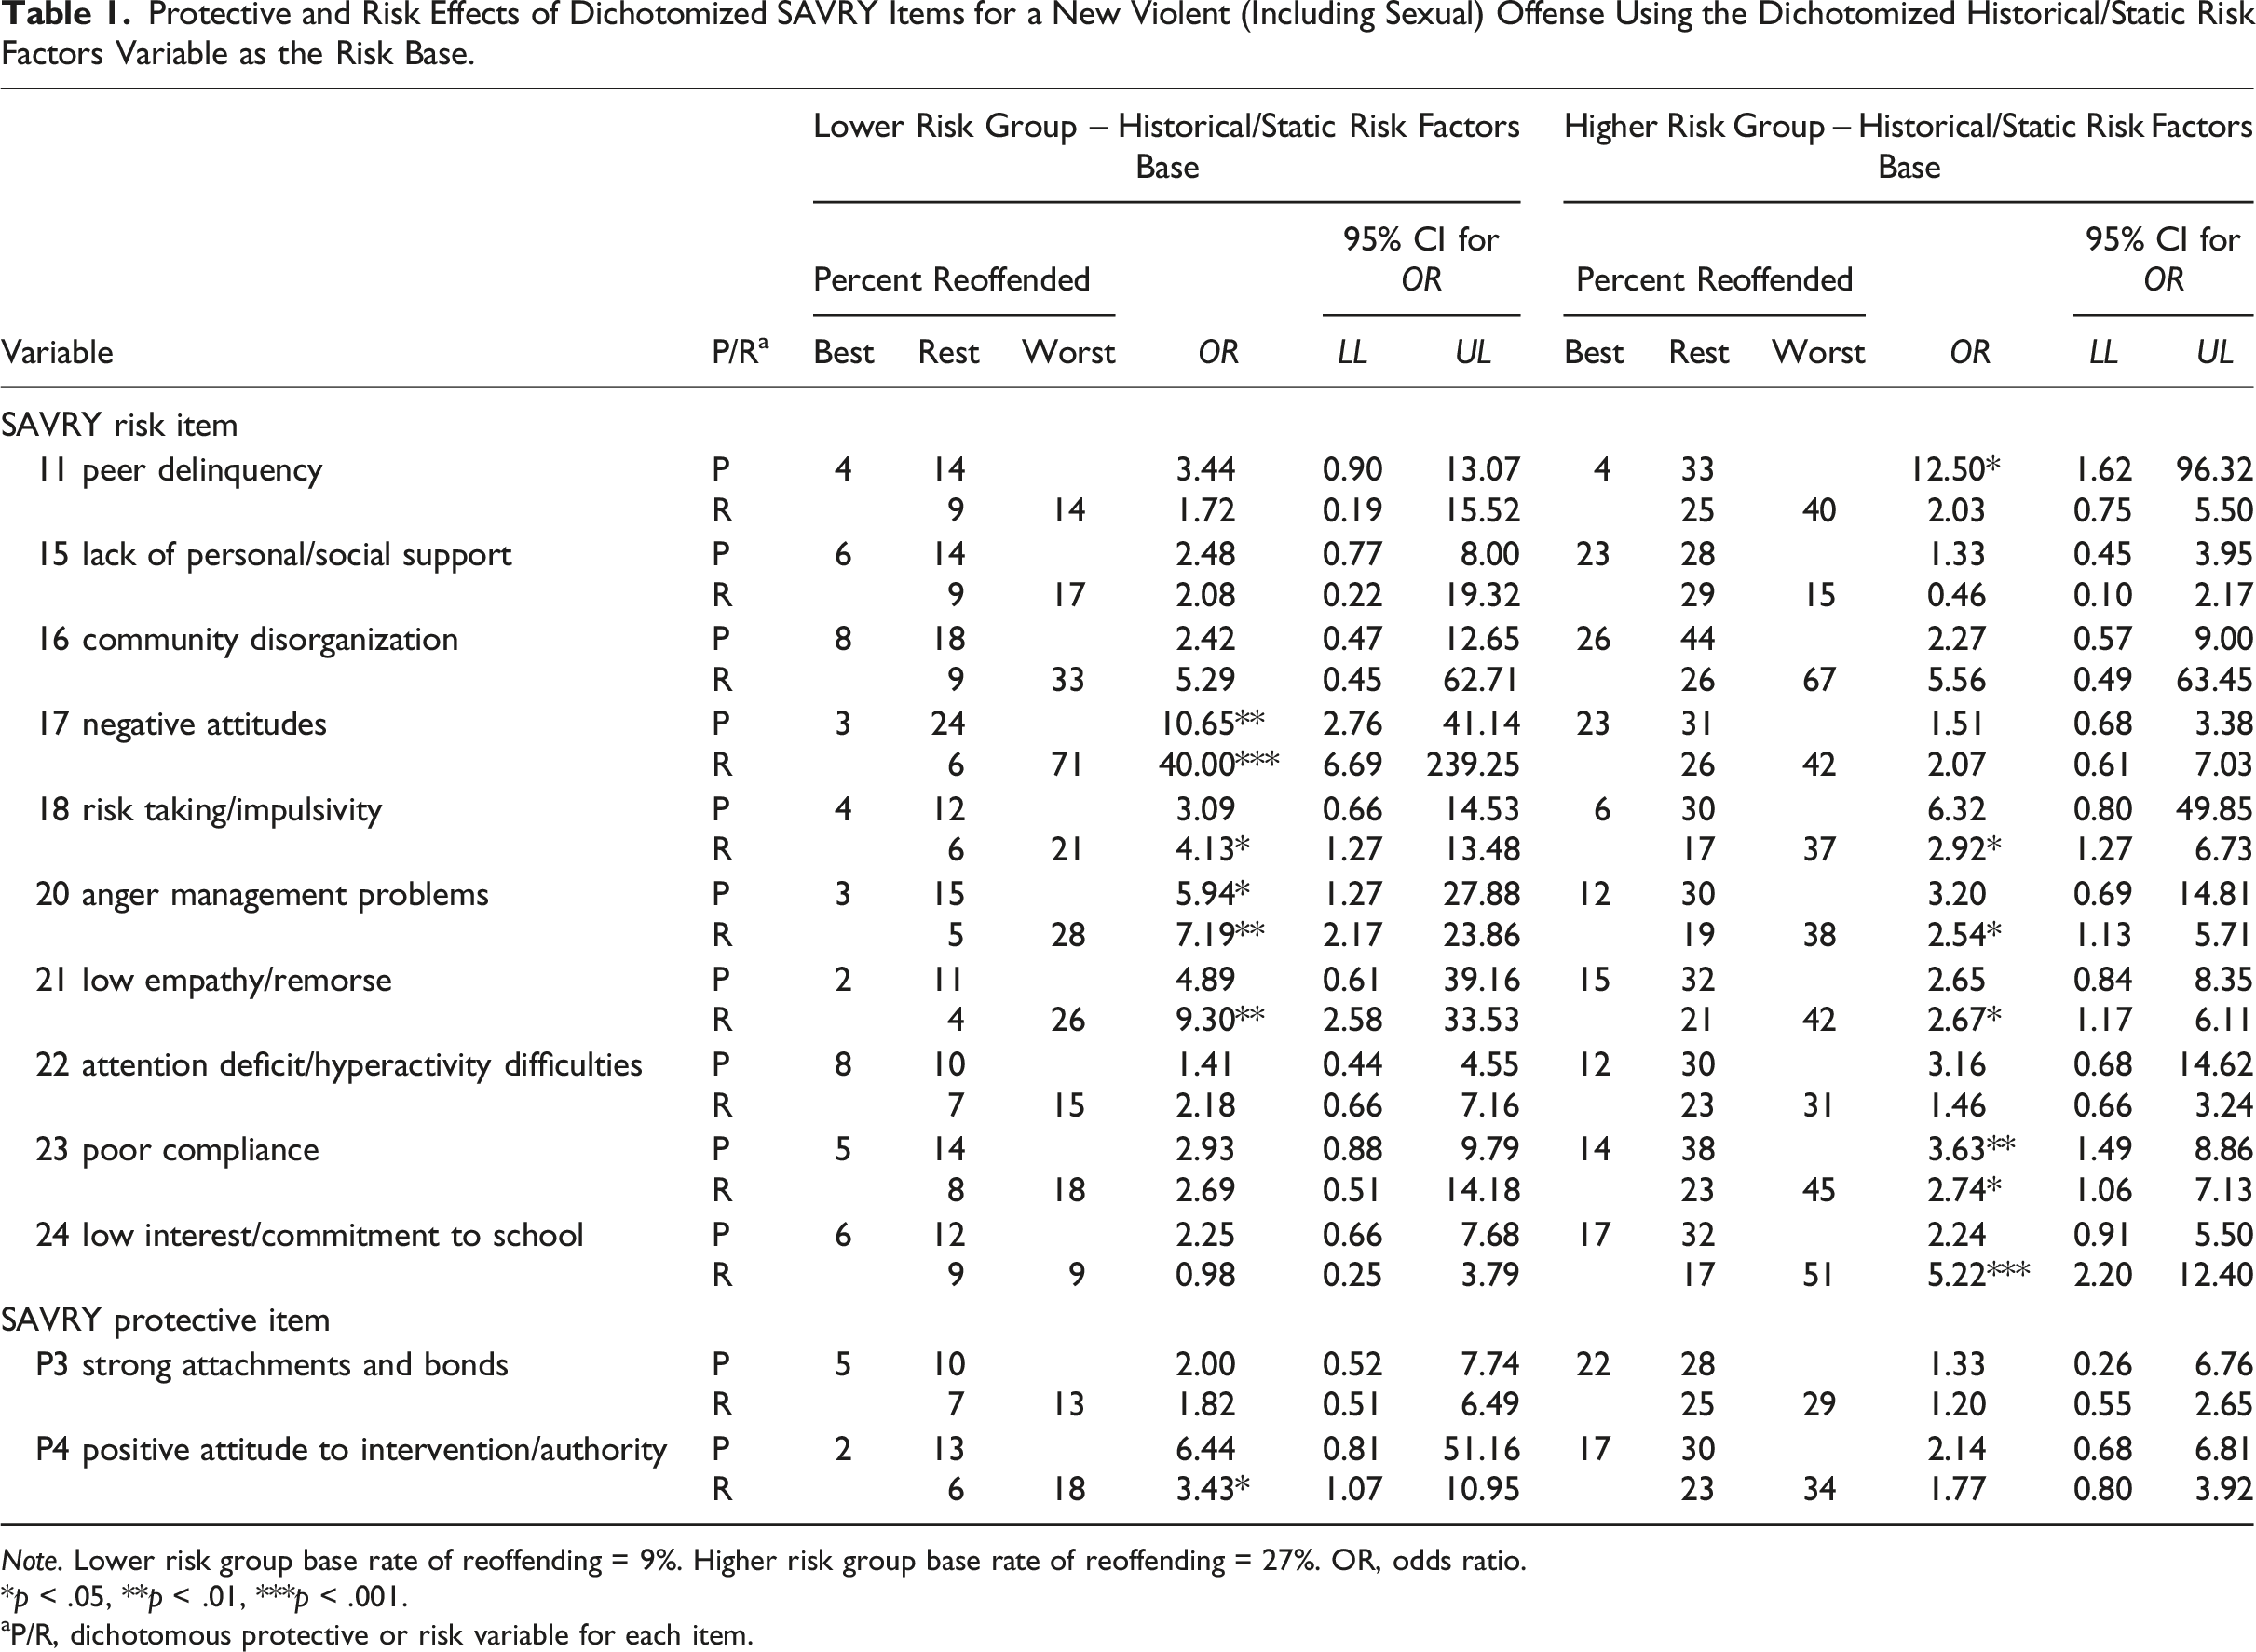
Note. Lower risk group base rate of reoffending = 9%. Higher risk group base rate of reoffending = 27%. OR, odds ratio.
*p < .05, **p < .01, ***p < .001.
aP/R, dichotomous protective or risk variable for each item.
Lower Historical Risk Base
Among the youth in the lower historical/static risk group, the base rate for a new violent (including sexual) offense was 9%. Ten of the 12 items investigated could be described as exerting a mixed effect in this lower risk group on the basis of their pairs of risk and promotive ORs ≥ 1.7. However, for two of these (#16, Community Disorganization; and #17, Negative Attitudes), the rates of new offending associated with the ‘best’ and ‘rest’ scores suggested that the protective effect component of this mixed effect, inferred on the basis of the protective OR, might be due largely to the notable increase from the base rate of 9% evident among those with the ‘rest’ scores on these items. Item 22, Attention Deficit/Hyperactivity Difficulties, was found to have a risk (exacerbation) effect on the basis of only its risk OR ≥1.7. Item 24, Low Interest/Commitment to School, was found to have a strength (protective) effect on the basis of its protective OR ≥1.7.
Higher Historical Risk Base
Among the youth in the higher historical/static risk group, the base rate for a new violent (including sexual) offense was 27%. Eight of the items investigated had a higher risk-based mixed effect. However, for one of these (#16, Community Disorganization), the rates of new offending associated with the ‘best’ and ‘rest’ scores suggested that the protective effect component of this mixed effect, inferred on the basis of the protective OR, might be due to the notable increase from the base rate of 27% evident among those with the ‘rest’ scores on this item. Of the remaining four items, #22, Attention Deficit/Hyperactivity Difficulties, had a strength (protective) effect in the higher risk group, in contrast to a risk (exacerbation) effect in the lower risk group; #17, Negative Attitudes, had a risk (exacerbation) effect in the higher risk group, in contrast to its mixed effect in the lower risk group; #P3, Strong Attachments and Bonds, was found to have no effect among the higher risk group, in contrast to its mixed effect among the lower risk group; and #15, Lack of Personal/Social Support, could be described as exerting a risk (paradoxical) effect in the higher risk group, in contrast to its mixed effect in the lower risk group.
Incremental Validity
Second Step in Prediction Models: Entry of Protective or Risk Variables
Protection
Changes in Chi-Square and Associated Effect Sizes for the Addition of Dichotomized SAVRY Items and Interaction Terms in Separate Hierarchical Regression Models Predicting a New Violent Offense.
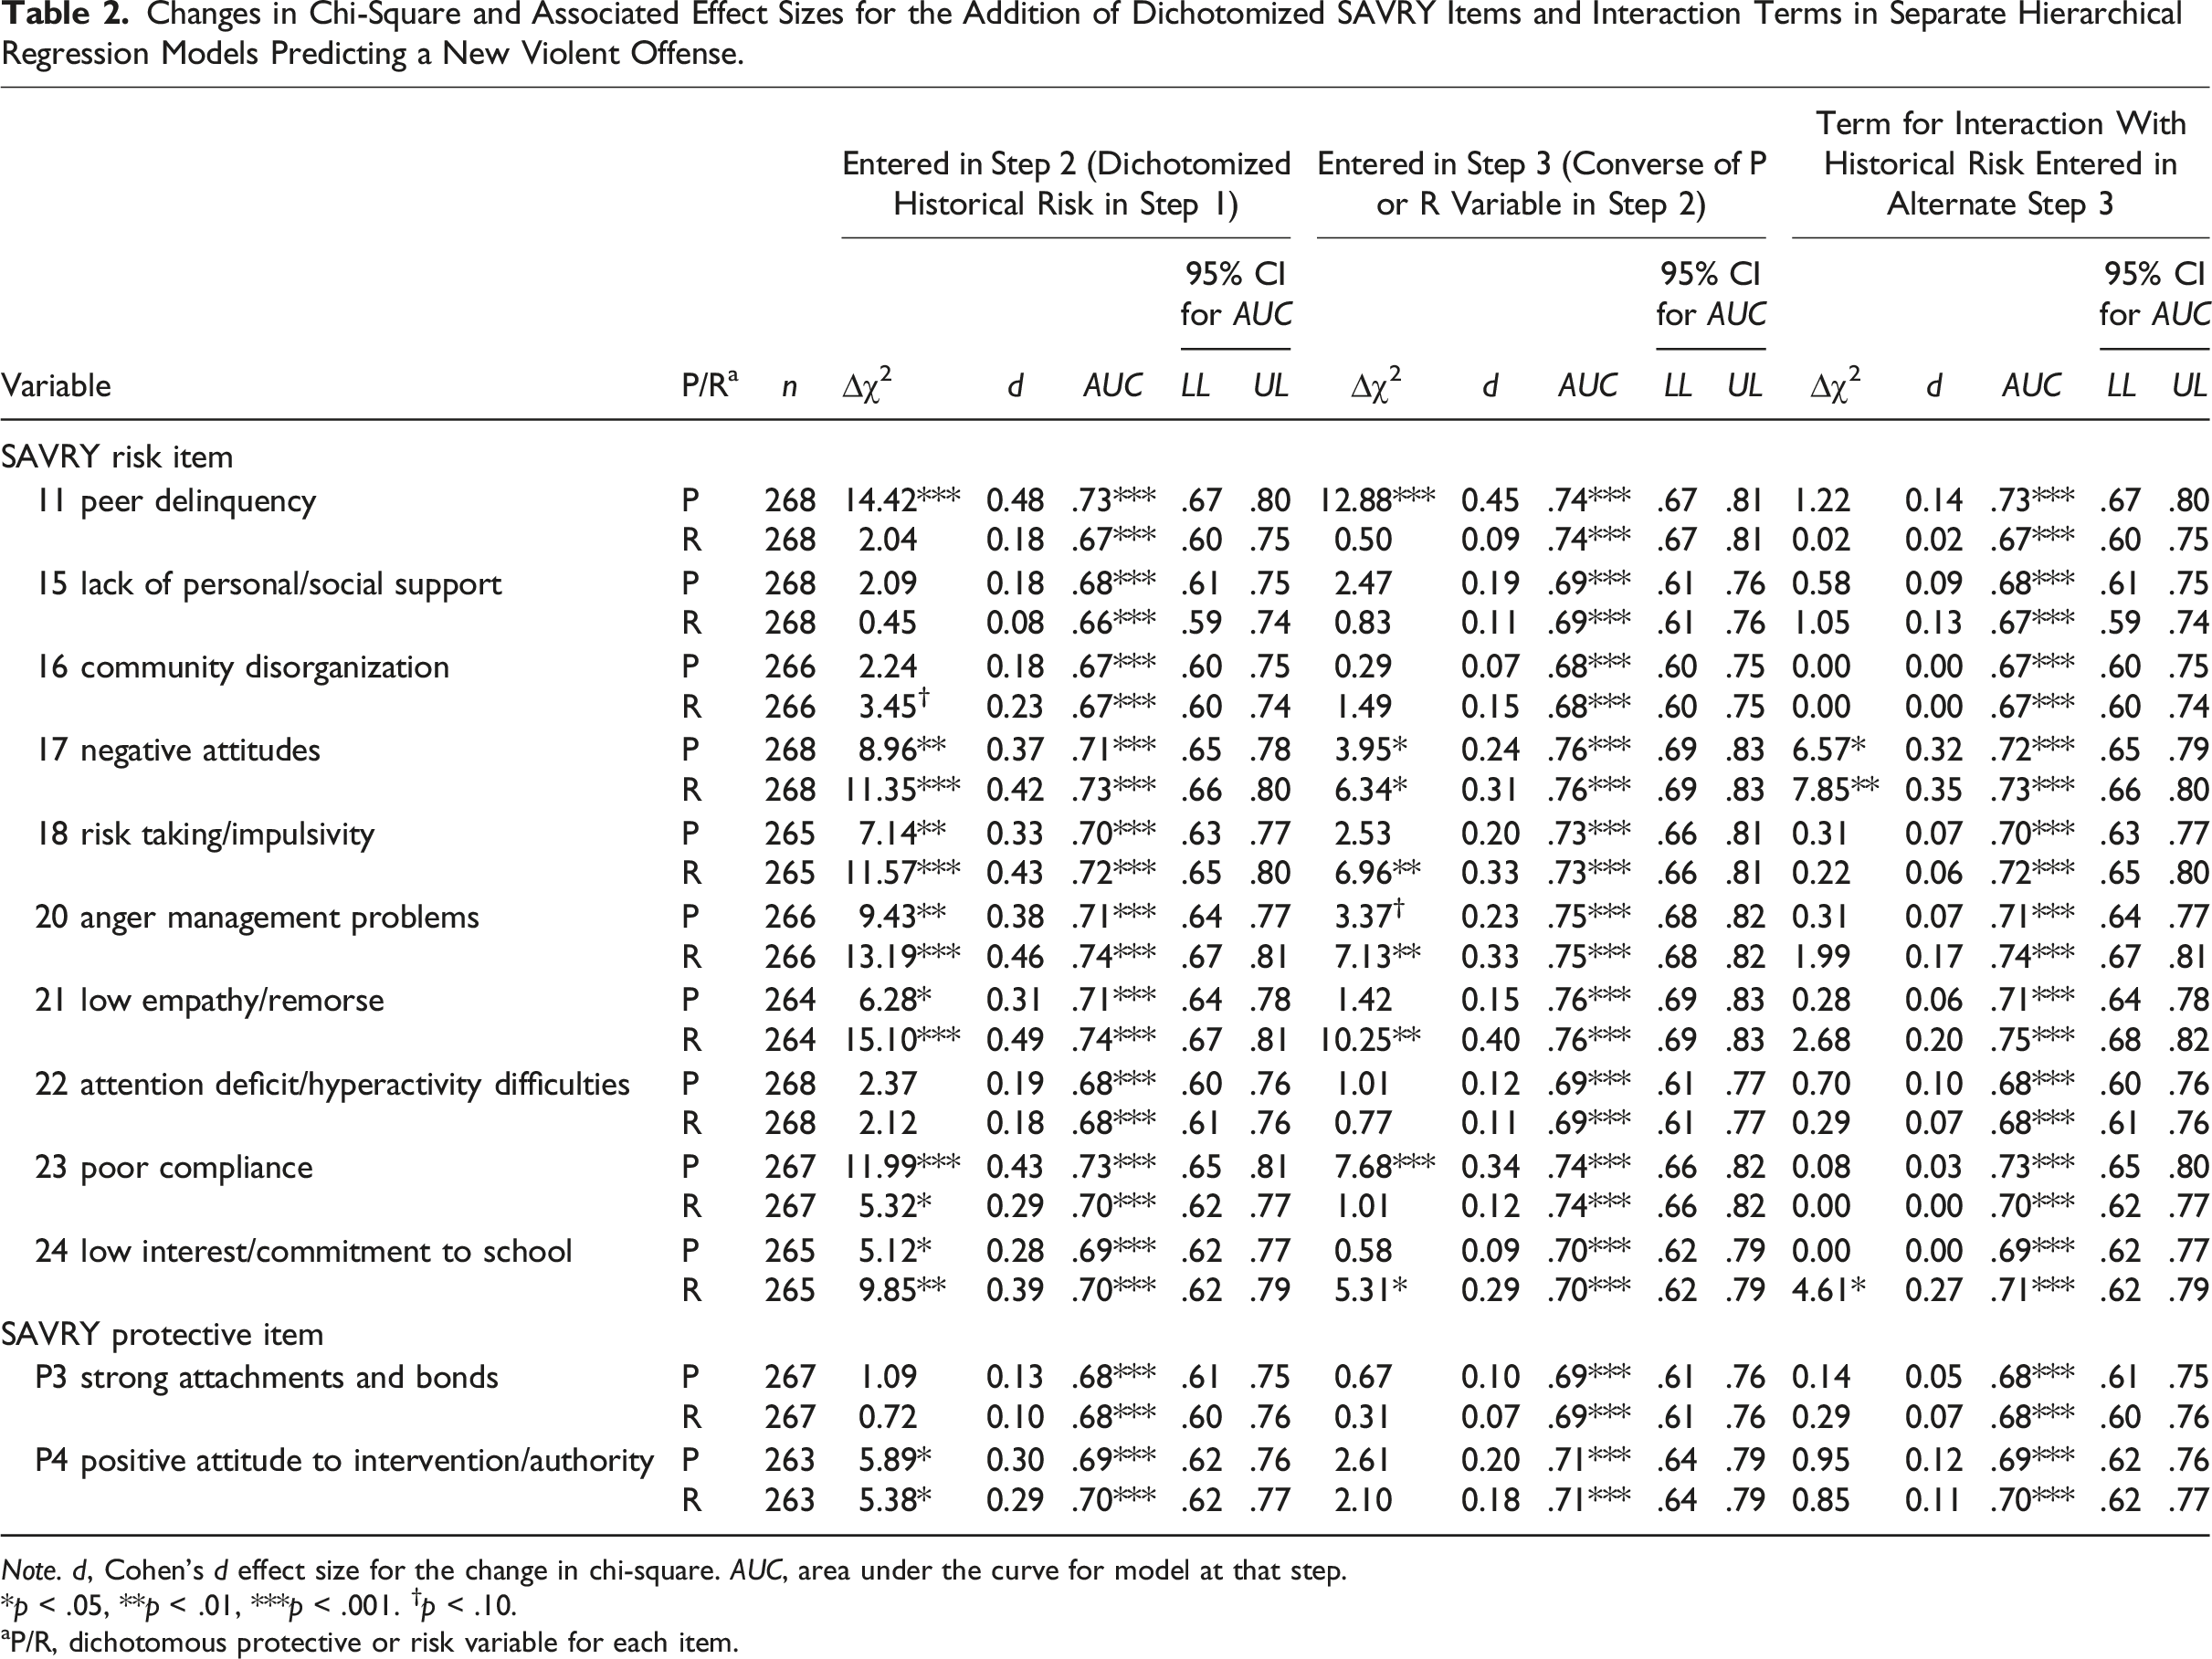
Note. d, Cohen’s d effect size for the change in chi-square. AUC, area under the curve for model at that step.
*p < .05, **p < .01, ***p < .001. †p < .10.
aP/R, dichotomous protective or risk variable for each item.
AUCs, representing an effect size for each step in each model, were calculated using the saved probabilities at each step of the hierarchical logistic regression models. AUCs for step 2 in the models were in the medium to large effect size range, with the entry of the strength in three models (those with either #11, Peer Delinquency, #17, Negative Attitudes or #23 Poor Compliance entered in step 2) resulting in a change from the medium effect size associated with step 1 to a large effect size associated with step 2 (see column of AUC values for models 1a, 4a, and 9a in Supplemental Tables 1, 4, and 9). The Cohen’s d effect size for the improvement in predictive accuracy from step 1 to 2 with the entry in the separate models of each of the same eight items was ≥0.23 (see first column of d values for the models 1a, 4a to 7a, 9a, 10a, and 12a in Supplemental Table 13); statistically significant improvements in predictive accuracy were found from step 1 to 2 in the same models (Supplemental Table 13).
Risk
For seven of these same eight items, the entry of the dichotomous variable to test each’s risk OR in a second step of separate models already containing the dichotomous Historical Risk Factors variable was statistically significant (#17, Negative Attitudes; #18, Risk Taking/Impulsivity; #20, Anger Management; #21, Low Empathy/Remorse; #23, Poor Compliance; #24, Low Interest/Commitment to School; P4, Positive Attitude to Intervention/Authority; see first column of ∆χ2 values for rows denoted ‘R’ in Table 2 and also column of ∆χ2 values for step 2 of models 4b to 7b, 9b, 10b, and 12b in Supplemental Tables 4–7, 9, 10, and 12). For seven of these same eight items and a different eighth (#16, Community Disorganization), the Cohen’s d effect size associated with the ∆χ2 resulting from the entry of the dichotomous variable to test each’s risk OR ranged from 0.23 to 0.49 (see first column of d values for rows denoted ‘R’ in Table 2 and also column of d values for step 2 of models 3b to 7b, 9b, 10b, and 12b in Supplemental Tables 3–7, 9, 10, and 12).
AUCs for step 2 in the models were in the medium to large effect size range, with the entry of the risk in four models (those with either #17, Negative Attitudes, #18, Risk Taking/Impulsivity, #20, Anger Management, or #21 Low Empathy/Remorse entered in step 2) resulting in a change from the medium effect size associated with step 1 to a large effect size associated with step 2 (see column of AUC values for models 4b to 7b in Supplemental Tables 4–7). The Cohen’s d effect size for the improvement in predictive accuracy from step 1 to 2 with the entry in the separate models of each of the same seven items was ≥0.25 (see first column of d values for the models 4b to 7b, 9b, 10b, and 12b in Supplemental Table 13); statistically significant improvements in predictive accuracy were found from step 1 to 2 in the same models (Supplemental Table 13).
Third Step in Prediction Models: Entry of Protective or Risk Variables
Protection
For six items, the Cohen’s d effect size associated with the ∆χ2 resulting from the entry of the dichotomous variable to test the incremental validity of each’s protective OR in a third step of the models already containing the dichotomous Historical Risk Factors variable and the dichotomous variable to test its risk OR was ≥0.20 (#11, Peer Delinquency; #17, Negative Attitudes; #18, Risk Taking/Impulsivity; #20, Anger Management; #23, Poor Compliance; P4, Positive Attitude to Intervention/Authority; see second column of d values for rows denoted ‘P’ in Table 2; see also column of d values for step 3 of models 1b, 4b to 6b, 9b, and 12b in Supplemental Tables 1, 4–6, 9, and 12). For three of these, the ∆χ2 was statistically significant also (#11, Peer Delinquency; #17, Negative Attitudes; #23, Poor Compliance; see second column of ∆χ2 values for rows denoted ‘P’ in Table 2 and also column of ∆χ2 values for step 3 of models 1b, 4b, and 9b in Supplemental Tables 1, 4 and 9).
AUCs for step 3 in the models were in the medium to large effect size range, with the entry of the strength in two models (those with either #11, Peer Delinquency or #23, Poor Compliance entered in step 3) resulting in a change from the medium effect size associated with step 2 to a large effect size associated with step 3 (see column of AUC values for models 1b and 9b in Supplemental Tables 1 and 9). The Cohen’s d effect size for the improvement in predictive accuracy from step 2 to 3 with the entry in the separate models of three items was ≥0.21 (#11, Peer Delinquency; #17, Negative Attitudes; #23, Poor Compliance; see second column of d values for models 1b, 4b, and 9b in Supplemental Table 13); statistically significant improvements in predictive accuracy were found from step 2 to 3 in the same models (Supplemental Table 13).
Risk
For five items, the Cohen’s d effect size associated with the ∆χ2 resulting from the entry of the dichotomous variable to test the incremental validity of each’s risk OR in a third step of the models already containing the dichotomous Historical Risk Factors variable and the dichotomous variable to test its protective OR was ≥0.29 (#17, Negative Attitudes; #18, Risk Taking/Impulsivity; #20, Anger Management; #21, Low Empathy/Remorse; #24, Low Interest/Commitment to School; see second column of d values for rows denoted ‘R’ in Table 2; see also column of d values for step 3 of models 4a to 7a, and 10a in Supplemental Tables 4–7, and 10). For these five, the ∆χ2 was statistically significant also (see second column of ∆χ2 values for rows denoted ‘R’ in Table 2 and also column of ∆χ2 values for step 3 of models 4a to 7a and 10a in Supplemental Tables 4–7 and 10).
AUCs for step 3 in the models were in the medium to large effect size range, with the entry of the risk in three models (those with either #18, Risk Taking/Impulsivity, #20 Anger Management, or #21, Low Empathy/Remorse entered in step 3) resulting in a change from the medium effect size associated with step 2 to a large effect size associated with step 3 (see column of AUC values for models 5a to 7a in Supplemental Tables 5–7). The Cohen’s d effect size for the improvement in predictive accuracy from step 2 to 3 with the entry in separate models of three items was ≥0.21 (#17, Negative Attitudes; #20, Anger Management; #21, Low Empathy/Remorse; see second column of d values for models 4a, 6a, and 7a in Supplemental Table 13); statistically significant improvements in predictive accuracy were found from step 2 to 3 in the same models (Supplemental Table 13).
Alternate Third Step in Prediction Models: Tests of Moderation
Protective Interactions
The interaction term for the dichotomous Historical Risk Factors variable and the dichotomous variable to test item 17’s (Negative Attitudes) protective OR in an alternate third step of the model was a statistically significant predictor as was the ∆χ2 resulting from its entry (see third column of ∆χ2 values for rows denoted ‘P’ in Table 2 and also the ∆χ2 value for alternate step 3 of model 4a in Supplemental Table 4), with a Cohen’s d effect size associated with the ∆χ2 resulting from its entry of 0.32 (see third column of d values for row denoted ‘P’ for this item in Table 2; see also column of d values for alternate step 3 of model 4a in Supplemental Table 4). The interaction is evident in Figure 1A. For no other interaction terms with dichotomous variables to test protective ORs was the effect size d for the ∆χ2 resulting from its entry >0.14, and no ∆χ2 resulting from the addition of other interaction terms was statistically significant. But the protective ORs for the lower and higher historical risk groups and the associated recidivism rates for item 11, Peer Delinquency, and for item 18, Risk Taking/Impulsivity, were consistent with an interactive protective effect (see Table 1 and Figure 1B and C). Percent with a new violent (including sexual) offense for example SAVRY social/contextual and individual/clinical dichotomized variables at two levels of SAVRY historical/static risk. Note. The base rates for a new violent (including sexual) offense for the higher and lower historical/static risk groups were 27% and 9%, respectively. Panel 1B used with permission of John Wiley and Sons Ltd., from “Risk and strength variables in recidivism-desistance prediction research with applied assessment practices: Toward a nomenclature for their effects” (p. 113) by Langton et al. (2022), in C. M. Langton & J. R. Worling (Eds.), Facilitating desistance from aggression and crime: Theory, research, and strength-based practices (https://doi.org/10.1002/9781119166504). Copyright 2022 by John Wiley and Sons Ltd. Adapted with permission conveyed through Copyright Clearance Center, Inc.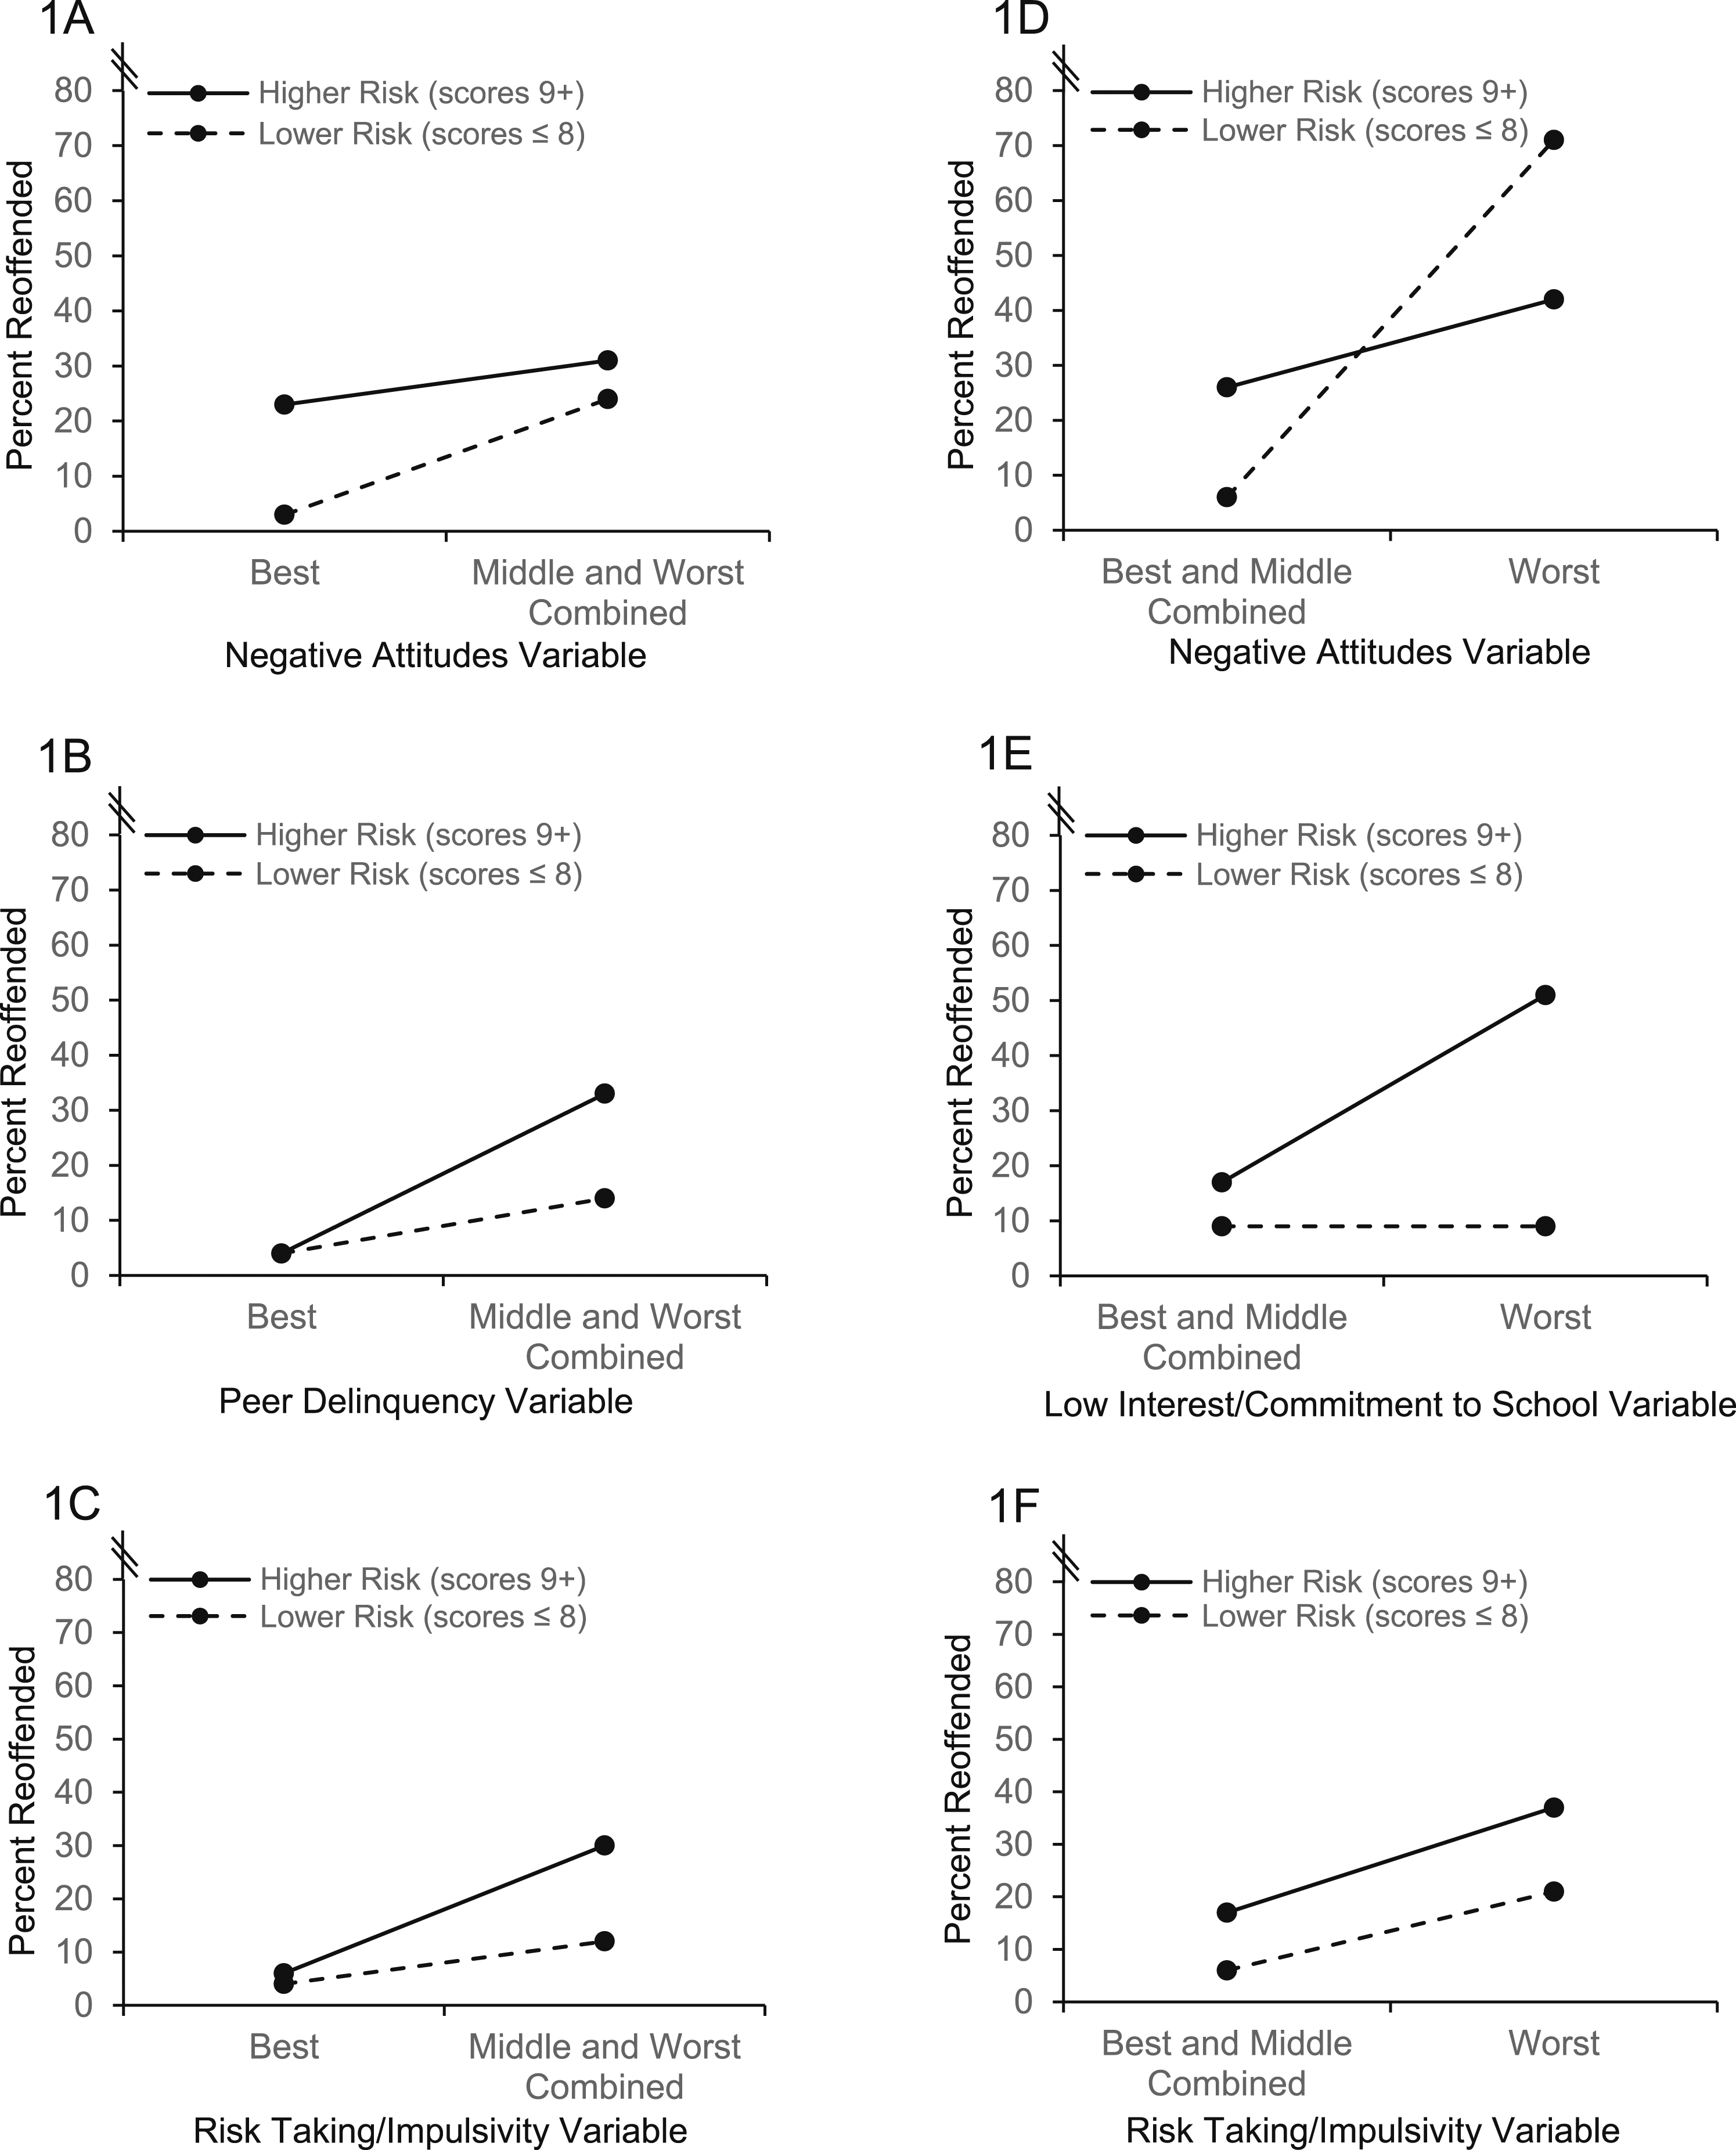
AUCs for the alternate step 3s testing the interaction terms in models 1a to 12a were in the medium to large effect size range (see third column of AUC values in Table 2 and column of AUC values for these models in Supplemental Tables 1–12). For none of these interaction terms, entered in an alternative step 3, was the Cohen’s d effect size for the improvement in predictive accuracy from step 2 (the entry of the strength itself) > 0.02 (see third column of d values in models 1a to 12a in Supplemental Table 13); notably, AUCs for models with the interaction term entered in an alternative step 3 were uniformly lower than the AUCs for models with the risk entered in a step 3 (see column of AUC values in models 1a to 12a in Supplemental Table 13).
Risk Interactions
For three of the items investigated, the Cohen’s d effect size associated with the ∆χ2 resulting from the entry of the interaction term for the dichotomous Historical Risk Factors variable and the dichotomous variable to test its risk OR in a third step of separate models was ≥0.20 (#17, Negative Attitudes, #21, Low Empathy/Remorse, #24, Low Interest/Commitment to School; see third column of d values for rows denoted ‘R’ in Table 2; see also column of d values for step 3 of models 4b, 7b, and 10b in Supplemental Tables 4, 7, and 10). For items 17 and 24, the interaction term in the alternate step 3 and the ∆χ2 resulting from the entry of each in separate models was statistically significant (see third column of ∆χ2 values for rows denoted ‘R’ in Table 2 and also column of ∆χ2 values for alternate step 3 of model 4b and 10b in Supplemental Tables 4 and 10). These interactions are evident in Figure 1D and E. By way of contrast, the main effects, but no interaction, for the dichotomous Historical Risk Factors variable and the dichotomous variable to test the risk OR for item 18, Risk Taking/Impulsivity, is shown in Figure 1F. The risk exacerbation effect of item 18 is clearly evident at both lower and higher levels of historical risk. For no other interaction terms was the effect size d for the ∆χ2 resulting from its addition in the small to medium range, and no ∆χ2 resulting from the addition of other interaction terms was statistically significant.
AUCs for the alternate step 3s testing the interaction terms in models 1b to 12b were in the medium to large effect size range (see third column of AUC values in Table 2 and column of AUC values for these models in Supplemental Tables 1–12). For none of these interaction terms, entered in an alternative step 3, was the Cohen’s d effect size for the improvement in predictive accuracy from step 2 (the entry of the risk itself) > 0.14 (see third column of d values in models 1b to 12b in Supplemental Table 13); notably, AUCs for models with the interaction term entered in an alternative step 3 were lower than the AUCs for models with the strength entered in a step 3, with the single exception of model 10b, for item 24, Low Interest/Commitment to School (see column of AUC values in models 1b to 12b in Supplemental Table 13).
Discussion
Complex Nature of Strengths
By adapting and expanding an approach from the criminological literature, the present study’s systematic investigation of potential effects of strengths and risks build on those reported by Langton, Ranjit, and Worling (2023). In that first proof of concept study, main effects on violent recidivism in a sample of justice-involved youth that were risk, mixed, and promotive in nature were demonstrated using SAVRY items operationalized as Risk Factors, and mixed and promotive effects were demonstrated using SAVRY items operationalized as Protective Factors. For this second proof of concept study, the same sample was used as was the same pool of trichotomous items comprising the SAVRY SPJ tool, once again dichotomized to create strength and risk variables. In this second proof of concept study, these variables were shown to exert risk-based risk, mixed, protective, paradoxical, and exacerbation effects for two groups within the sample representing different levels of historical/static risk. These group-specific findings were augmented by stringent tests of incremental validity of the same dichotomous protective (and risk) variables over historical/static risk and their own obverse dichotomous risk (and protective) variables using the full sample, as well as tests of moderation using the full sample, the latter producing a range of interactions.
Thus, consistent with what Langton et al. (2022) showed using the data reported for the CSDD dataset from the field of criminology, findings from the present proof of concept study and the earlier proof of concept study (Langton, Ranjit, & Worling, 2023) show that multiple contrasting conceptualizations of what a strength or ‘protective factor’ represents in the pertinent criminological and psychological literatures can each be correct. Correct, because items comprising forensic assessment tools used in applied practice that are operationalized to tap a strength in a specific construct or domain can have a main effect on recidivism. They lower the likelihood of a new offense, in contrast to variables intended to tap risk, which can be shown to increase that likelihood. Correct, as well, because variables can be shown to exert both promotive and risk effects on the basis of their two poles at either end of a single continuum (per Farrington et al., 2016). Also correct because variables can be shown to exert one of a range of distinct types of risk-based effect among discrete groups within a sample or population (per Farrington et al., 2016) representing different levels of clearly operationalized risk of recidivism. These effects can be protective in nature, lowering the likelihood of a new offense below that expected based on the risk present. They can also be exacerbating, raising the likelihood of a new offense above that expected based on the risk present. Or they can be mixed, doing both on the basis of the variables’ two poles.
Distinct from those main effects (demonstrated with sample-level analyses), and risk-based effects (demonstrated with groups of distinct risk levels within a sample), the same strength variable can have incremental validity over its own obverse risk variable and vice versa (again, demonstrated with sample-level analyses). Arguably, tests of incremental validity are the most widely represented example of findings with applied significance for forensic assessment practices in the literature. But findings of incremental validity alone afford little conclusive elucidation about the nature of strength in this work, not least because some operationalizations of strengths may be best construed as simply the extension of the range covered for a construct by an item operationalized as a risk (Harris & Rice, 2015).
For some variables, various possible types of interactions can also be demonstrated with sample-level analyses, as reported here and with the CSDD dataset (Langton et al., 2022). This provides impetus for greater attention to interactions in future research, distinct from simply additive effects (Farrington, 1997). Of these, a moderating role for strengths, ameliorating or ‘protecting’ against the adverse effect of a risk that is present (per Brennan et al., 1997; Farrington et al., 2016), is clearly of applied significance. So too are interactions between two risks resulting in exacerbation of adverse effects. Thus, the nature and range of possible effects of strengths would appear to be more complex than has been evident based on the bulk of the empirical work grounding current applied forensic risk assessment practices.
Implications of This Systematic Approach to Investigating and Describing Various Effects
It is the adaption and extension of the approach developed in the field of criminology by Farrington and his colleagues that promises to elucidate more of this complexity and the types of possible effects that can be demonstrated with items used in applied forensic risk assessment practices, as shown in this study. Closer inspection and integration of the findings reported for a few example items will be illustrative and allow for consideration of descriptive terms for the effects and tentative implications for intervention planning also.
For item 11, Peer Delinquency, the pairs of ORs and changes from the base rates in each of the two historical/static risk subsets indicated a lower risk-based mixed effect and a higher risk-based mixed effect. These are broadly consistent with but not discernable from the findings for the separate tests of incremental validity for this item’s dichotomous protective and risk variables in hierarchical logistic regression models with the full sample. Of particular note for this item, its dichotomous protective variable had incremental validity over historical/static risk when entered in the second step and it had incremental validity over historical/static risk and its converse risk variable when entered in a third step of a hierarchical logistic regression model. But its converse, the dichotomous risk variable for this item, had incremental validity only when entered in the second step. This permits the inference that the dichotomous protective variable for this item, capturing strength, conveyed unique information.
Although the tests of the interaction terms for this Peer Delinquency item’s protective and risk variables did not have incremental validity in alternate third steps and were not statistically significant predictors, the changes from the base rates for its dichotomous protective variable (and that for item 18, Risk Taking/Impulsivity also) in each of the two historical/static risk groups were consistent with the description Farrington et al. (2016) offered of an interactive protective factor: a factor that “…interacts with a risk factor to nullify its effect” (p. 64) and “…predicts a low probability of offending among children at risk [here, higher historical/static risk] but not among other children [here, lower historical/static risk]. The clearest example of an interactive protective factor is a variable that reduces the probability of offending among children at risk [here, higher historical/static risk] to the same rate as for those who are not at risk [here, lower historical/static risk]” (p. 69). For the dichotomous protective variable for both item 11, Peer Delinquency, and item 18, Risk Taking/Impulsivity, the pattern could be described as a higher-risk-based strength (protective) > lower-risk-based strength (protective) interactive effect, broadly consistent with what Brennan et al. (1997) described as the “compensatory protective model” (p. 95) and what Luthar (1993) described in the developmental psychopathology literature as a “protective stabilizing effect” (pp. 446-447). In contrast, for the dichotomous risk variable for item 18 no interaction was found, with only main effects for both it and the historical/static risk variable evident, which Farrington (1997) described as “additive main effects” (pp. 297-298).
Tentative implications of these findings are that greater attention be paid in applied forensic assessment practices to both strength and risk conceptualizations of these constructs and that both may need to be targeted with evidence-based interventions with youth at both lower and higher historical/static risk. But, subject to replication, it may be among the higher historical/static risk youth that enhancing relationships with prosocial peers is more important. This would be broadly consistent with the Risk Principle of the Risk-Needs-Responsivity Model (Bonta & Andrews, 2017), although the emphasis may need to be on introducing or enhancing strength in this domain rather than emphasizing only the reduction of risk in this domain.
For item 15, Lack of Personal/Social Support, the pairs of ORs and changes from the base rates in each of the two subsets indicate a lower risk-based mixed effect and a higher risk-based risk (paradoxical) effect. Neither effect could be easily discerned from the findings for the tests of incremental validity for this item’s dichotomous protective and risk variables with the full sample. Nor would the tests of their interaction terms with historical/static risk using the full sample (both statistically nonsignificant) have elucidated these risk-based effects. The paradoxical effect for this item’s dichotomous risk variable among the higher risk group is particularly noteworthy. Among those youth at higher historical/static risk, those with a rating of 2 (risk present) on this item were 2.2 times less likely to commit a new violent offense than those with ratings of zero or 1. It is described as a risk paradoxical effect because the recidivism rate (15%) among this higher risk group was lower (but would have been expected to be higher) for those rated as having this Lack of Personal/Social Support risk present (a rating of 2) than the rate (29%) for those with ratings of zero or 1 (recall that the base rate was 27%). It may be that, for these higher historical/static risk youth, the risk reflected in their scores of 2 on this potentially dynamic item was recognized at the time of their actual assessment. In the applied management of their cases, those youth might then have been provided with increased personal and social supports in efforts to offset this identified risk, consistent with both the Risk and Needs Principles (Bonta & Andrews, 2017). Those efforts, which could be inferred to have been successful, would not have been in place before the risk was detected and documented in that initial assessment in the files. As such, the risk, but not the effort to address it, is captured in the coding of the item. Of course, replication is needed before much should be made of this paradoxical effect. In any case, the issue arises of change over time in dynamic risk, specifically the question of how to reliably assess changes (some of which may be developmental in nature while others may result from the provision of services and particularly targeted interventions) and whether those changes are predictive (see, for example, Langton, 2007; Viljoen et al., 2017). Although that question cannot be addressed with these present data, it could be inferred from the various medium- and large-sized AUCs obtained with the purportedly dynamic variables that over time (here, in the period after assessment during which some forms of supervision and possibly additional services would have been in place) there may have been less variability in the constructs being tapped than might be expected given their purportedly dynamic nature, at least as operationalized by these SAVRY items.
For item 16, Community Disorganization, the pairs of ORs suggest a lower risk-based mixed effect and a higher risk-based mixed effect in the two subsets. These findings are broadly consistent with but not clearly discernable from those for the separate tests of incremental validity for this item’s dichotomous protective and risk variables with the full sample. Nor could they be discerned from the tests of their interaction terms with historical/static risk (which were statistically nonsignificant) using the full sample. But, for the ‘best’ scores on this item’s dichotomous protective variable, the lack of decrease from the base rates of 9% and 27% in the two subsets (decreases that would support the inference of a protective effect component) and the notable increases above those base rates for the ‘rest’ scores suggest a risk effect only. Taken in conjunction with the risk ORs and changes from base rates for this item’s dichotomous risk variable, a lower risk-based risk (exacerbation) effect and a higher risk-based risk (exacerbation) effect could be inferred for this item. The parsimonious applied implication of these findings is that, for this operationalization of the construct, strength may not have been adequately captured by scores of 0, which is understandable given that the SAVRY developers explicitly operationalized this construct as a Risk Factor. Further work to operationalize strength in this domain is needed to determine if a strength effect can be demonstrated for this outcome of a new violent (including sexual) offense for lower and higher historical/static risk subsets (i.e., a risk-based strength (protective) effect). On the basis of the present pattern of findings, one tentative implication for intervention work is that risk reduction efforts are warranted.
For item 17, Negative Attitudes, scrutiny of the changes from the base rates is similarly informative. The pairs of ORs for the dichotomous protective and risk variables suggest a lower risk-based mixed effect and a higher risk-based risk (exacerbation) effect, respectively, with the subsets. These are broadly consistent with but not discernable from the findings for the separate tests of incremental validity for this item’s dichotomous protective and risk variables. Nor are they discernable from the tests of their interaction terms with historical/static risk using the full sample. The interaction terms for both of the dichotomous variables for this item with historical/static risk were statistically significant, with ds associated with the change in chi-square ≥0.32. For the dichotomous risk variable, this could be described as a lower risk-based risk (exacerbation) > higher risk-based risk (exacerbation) interaction effect. For the dichotomous protective variable, this could be described as a lower risk-based strength (protective) > higher risk-based strength (no effect) interaction effect. But, interestingly, with this dichotomous protective variable, the degree of change above the base rate in the lower risk subset for youth with the ‘rest’ scores (indicating risk) was considerable. This suggests that for the dichotomous protective variable for this item the effect demonstrated was due in part to an elevation in risk among those at lower historical/static risk rather than only a protective effect.
Both these interactions could be viewed as examples of Farrington’s (1997) “reverse amplifying interaction effect” (pp. 297-298). As with item 16, above, the applied implication is that, for this operationalization of the construct, strength may not have been adequately captured by scores of 0. Findings with the dichotomous variables for the conceptually related but distinct construct of Positive Attitude to Intervention/Authority (item P4) indicated risk-based mixed effects for both lower and higher historical/static risk subsets and, with the full sample, incremental validity but neither a protective nor exacerbation moderating effect. One tentative implication for applied intervention work is that introducing/enhancing prosocial attitudes is indicated for all youth as is reducing risk associated with negative attitudes but that efforts to reduce negative attitudes may be expected to lower the likelihood of a new violent (including sexual) offense substantially among lower historical/static risk youth.
Lastly, for item 24, Low Interest/Commitment to School, the pairs of ORs for the dichotomous protective and risk variables suggest a risk-based strength (protective) effect for the lower risk youth and a risk-based mixed effect for the higher risk youth. These are broadly consistent with but not discernable from the findings for the separate tests of incremental validity for this item’s dichotomous protective and risk variables. The interaction between this item’s dichotomous risk variable and the historical/static risk variable was statistically significant, with a Cohen’s d associated with the change in chi-square of 0.27. This could be described as a higher risk-based risk (exacerbation) > lower risk-based risk (no effect) interaction, akin to what Farrington (1997) described as an “amplifying – protective interaction effect” (p. 298). The tentative implication of this interaction for applied intervention planning concerning this operationalization of this construct is that, once again, risk reduction work is indicated among youth at higher historical/static risk, consistent with the Risk and Needs Principles (Bonta & Andrews, 2017).
But this does raise an issue about which there is little consensus regarding what it means to emphasize either risk reduction or strength introduction/enhancement over the other in applied intervention work (Andrews et al., 2011; Ward et al., 2012; Wormith et al., 2012). It is not immediately obvious how one would reduce the risk of low interest/commitment in school without introducing strength in this domain (i.e., trying to foster an increase in interest/commitment in school). The relevant item here has been operationalized as a risk factor by the SAVRY developers. But effecting a reduction in risk might necessarily involve addressing both risk and strength. For example, it might mean effecting changes for a youth away from academic and vocational school subjects and dynamics with teachers that elicit or otherwise produce the low interest/commitment towards academic and vocational subjects and dynamics with teachers that foster or otherwise produce higher levels of interest/commitment. Such efforts represent risk reduction and strength-enhancement. Could a reduction in risk be achieved without an enhancement in strength for this construct?
Alternatively or additionally, perhaps focused work in another domain, such as peer groups, would achieve the desired change in likelihood of a new violent (including sexual) offense associated with low interest/commitment to school, if an index in the domain of peer groups was shown to moderate the association between interest/commitment in school and this outcome. A more integrated approach, investigating relationships between constructs within a domain and between domains has yet to be widely adopted in research on applied forensic assessment practices in youth justice. But systematic work of the sort reported in the present study and others such as a classification tree approach (see, for example, Monahan et al., 2001) represent promising directions for the field alongside analyses of longitudinal data using techniques effectively employed in criminological research such as structural equation modeling (e.g., Jäggi & Kliewer, 2020) and hierarchical generalized linear mixed modeling (e.g., Mowen & Boman, 2018).
Limitations and Future Directions
As a proof of concept study, these findings highlight various methodological and practice considerations worthy of closer empirical attention and critical discussion but the study itself is not without limitations. Generalizability of the specific findings may be limited given that this is a male-only sample, all of whom had a sexual offense and also, for some, diverse criminal histories. As well, the sample is drawn from a major urban area in Southern Ontario; differences with other geographical locations and legal considerations (including varying definitions of types of offenses) may further limit the generalizability of the findings. The archival nature of the study is acknowledged too, with the 11-year period over which the archived case files were originally generated starting in 2003 and recidivism data obtained in 2014. Reliance on archived case files is a common and valuable approach in the field, permitting as it did in this study an adequate sample size with a minimum 3-year follow-up period. Nevertheless, although the SAVRY itself is widely used in current applied forensic assessment practice, the constructs some of its items tap may be viewed and addressed differently currently than they might have been during the period during which data were collected for this study. But the possibly limited generalizability does not diminish the potential value of the approach itself, following that of Farrington and his colleagues, as demonstrated by this proof of concept study.
Among other basic issues, dichotomies were utilized for simplicity and clarity of demonstrating types of effects, per Farrington (1997) and Farrington et al. (2016). Given the lack of consensus in the literature about what types of effects can be demonstrated, using dichotomies to make the case compellingly for more systematic research on strengths in applied forensic assessment practices was an imperative. But tools widely used to assess risk and protective factors in applied practice generally yield continuous scores and/or ordinal rankings of categories rather than dichotomies. Future work will be needed to address this while addressing also the reliance on these tools’ composite scores in the research to date, which has meant there remains a lack of conceptual clarity about what constructs are exerting what types of effect. Another basic issue concerns the base rates; although important for making sense of the various findings reported here, it was not possible to adhere strictly to Farrington et al.’s rule of thumb about changes ≥10 percentage points from base rates because the base rate for the lower historical/static risk subset was 9%.
The small number of cases used to test inter-rater reliability and the fair to poor inter-rater reliability obtained for three Risk Factor items (#17, 23, 24) and one Protective Factor item (#P4) are other issues. Importantly though, for all four of those items, ORs obtained corresponded to medium to large effect sizes in this sample, indicating moderate or better predictive validity. As such, it is possible that these fair to poor reliabilities were an artifact of the particular set of archived case files with which the inter-rater reliability was determined, perhaps containing insufficient information to code those items. Fortunately, the predictive validity obtained for these items for the full sample permits the inference that, over the duration of coding, reliability for these items was adequate.
Keeping in mind these limitations, the findings reported here suggest the field systematically investigate purported strengths or ‘protective factors.’ Greater research attention is needed to the various possible effects these can be demonstrated to have on recidivism outcomes both independent of and in conjunction with risks rather than applying labels to variables that imply only one of two types of effect. But replication and extensions of the findings of this proof of concept study are needed before a firm empirical foundation and clear direction for practitioners can be claimed. Such work is warranted because the real-world implications of such research efforts in terms of the development of forensic assessment tools used in applied practice, training in their use, and how best to employ them to empirically inform intervention work are potentially considerable.
Supplemental Material
Supplemental Material - A Second Proof of Concept Investigation of Strengths Using the SAVRY Assessment Tool With Justice-Involved Youth: Item Level Risk-Based Effects and Interactions
Supplemental Material for A Second Proof of Concept Investigation of Strengths Using the SAVRY Assessment Tool With Justice-Involved Youth: Item Level Risk-Based Effects and Interactions by Calvin M. Langton, James R. Worling, and Gabriela D. B. Sheinin in Youth Violence and Juvenile Justice.
Footnotes
Declaration of Conflicting Interests
The author(s) declared no potential conflicts of interest with respect to the research, authorship, and/or publication of this article.
Funding
The author(s) disclosed receipt of the following financial support for the research, authorship, and/or publication of this article: This work was supported by Social Sciences and Humanities Research Council of Canada (430-2014-00123).
Authors’ Note
This research was supported by a grant from the Social Sciences and Humanities Research Council of Canada to the first author. The work of our research assistants, Martin Bryan, Bianca Humbert, and Amy Plomp is gratefully acknowledged as is the assistance from facility staff and ministry employees. We would also like to thank the youth and their families without whom this research would not have been possible.
Supplemental Material
Supplemental material for this article is available online.
Author biographies
References
Supplementary Material
Please find the following supplemental material available below.
For Open Access articles published under a Creative Commons License, all supplemental material carries the same license as the article it is associated with.
For non-Open Access articles published, all supplemental material carries a non-exclusive license, and permission requests for re-use of supplemental material or any part of supplemental material shall be sent directly to the copyright owner as specified in the copyright notice associated with the article.