
Abstract
Control of Congress after the 2020 election will depend on how well each party and candidate appeal to voters in both multiracial and less racially diverse districts.
The racial diversity of a Congressional district correlates with partisan representation in Congress. Democrats tend to be elected in more multiracial Congressional districts, while Whiter districts tend to vote for Republicans. Control of Congress after the 2020 election, however, will depend on how well the political parties and candidates appeal to voters in both multiracial and less racially diverse districts. Parties will need to persuade rural, White voters in some districts as well as well-educated voters of all races in others.
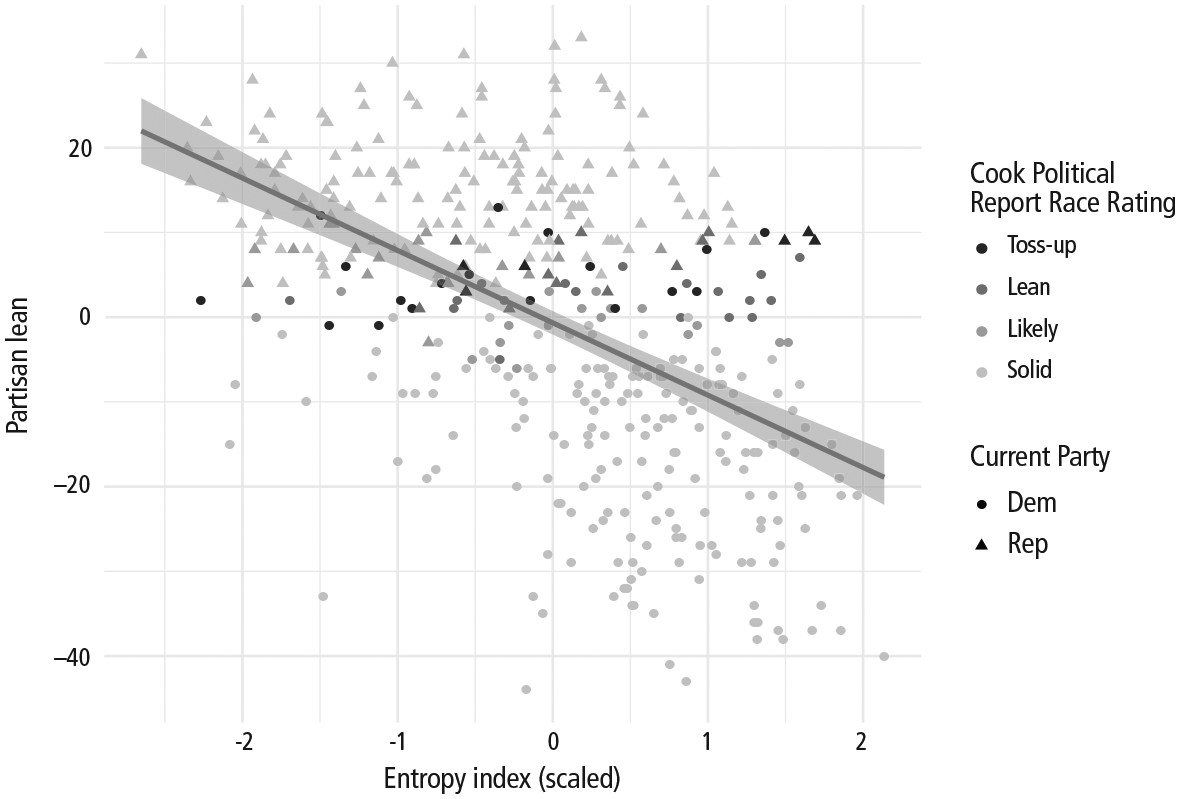
Figure 1 shows that the relationship between district racial diversity and partisan representation is quite strong. Each point on the plot represents a Congressional district (the plot does not include North Carolina districts due to the recent redistricting required by the state’s supreme court). The position of the district on the horizontal x-axis represents the level of racial diversity. Here, I use what’s called the “entropy index,” which is a common measure of multigroup diversity. Since the numeric values of the entropy index have no intrinsic meaning, I scaled the values so that the average entropy score equals zero, and each unit represents a standard deviation (i.e., “1” equals one standard deviation above the mean). Therefore, we can assume that the further toward the right side of the figure, the more racially diverse the district.
Partisan Lean by Diversity of Congressional District for U.S. House of Representative Races
The vertical y-axis plots the partisan lean of the district. Here, I use the Cook Political Report Partisan Voter Index (PVI) to measure the Democratic—or Republican—lean in a district. The PVI represents “how each congressional district performed compared to the nation as a whole” based on the previous two presidential elections. Positive values (closer to the top of the figure) represent districts with a higher share of votes for the Republican candidates, negative values (closer to the bottom of the figure) represent higher shares for the Democratic candidates. Zero means the district looks like the country as a whole.
A voter casting their ballot.
Pexels, Element5 Digital Follow

The figure shows that the racial diversity of a Congressional district is a reasonable predictor for partisan lean. A district with average diversity (zero on the X-axis entropy scale) is more likely to have almost no lean toward one party or another, meaning they vote like the country as a whole did in the last two presidential elections. A district with one standard deviation more diversity (1 on the x-axis) than another will lean 8.5 points more toward the Democrats. A district’s level of racial diversity accounts for 26 percent of the variation in partisan lean. The more diverse a district, the more likely it is to vote Democratic. The less diverse a district is (which typically means it is more White), the more likely it is to vote Republican.
However, within Congressional districts that have more competitive races between the parties, there is almost no relationship between diversity and partisan lean. Figure 2 shows all districts that the Cook Political Report classifies in its “likely,” “lean,” and “toss-up” categories and excludes those that are solidly one party or another. The least diverse district in this group is almost two standard deviations lower than a district with average diversity (moving to the left of the figure); the most diverse district has one-and-ahalf standard deviations greater diversity (moving to the right of the figure).
Racial diversity predicts partisan lean in congressional districts
Source: Cook Political Report, NHGIS. North Carolina districts excluded
A mural on the side of an old brick building reminding us all to vote.
Flickr cc, Chris Christian
Partisan Lean by Diversity of Congressional District for Competitive U.S. House of Representative Races
The districts that are not solidly one party or the other have aligned with conventional wisdom that pits two electoral strategies against one another. The first strategy focuses on Congressional districts represented by Democrats in Congress but that voted for Trump for president in 2016. Maine’s 2nd Congressional district, labeled on the plot, is the least diverse district represented by a Democrat. 94 percent of residents in the district are White. Representative Jared Golden won the election to represent the district, which voted for Trump by 10 points in 2016. Golden’s position can help to explain his focus since being elected on the concerns of his largely rural constituents, such as access to medical care and drug addiction.
Racial diversity less predictive of partisan lean in competitive districts
Source: Cook Political Report, NHGIS. North Carolina districts excluded
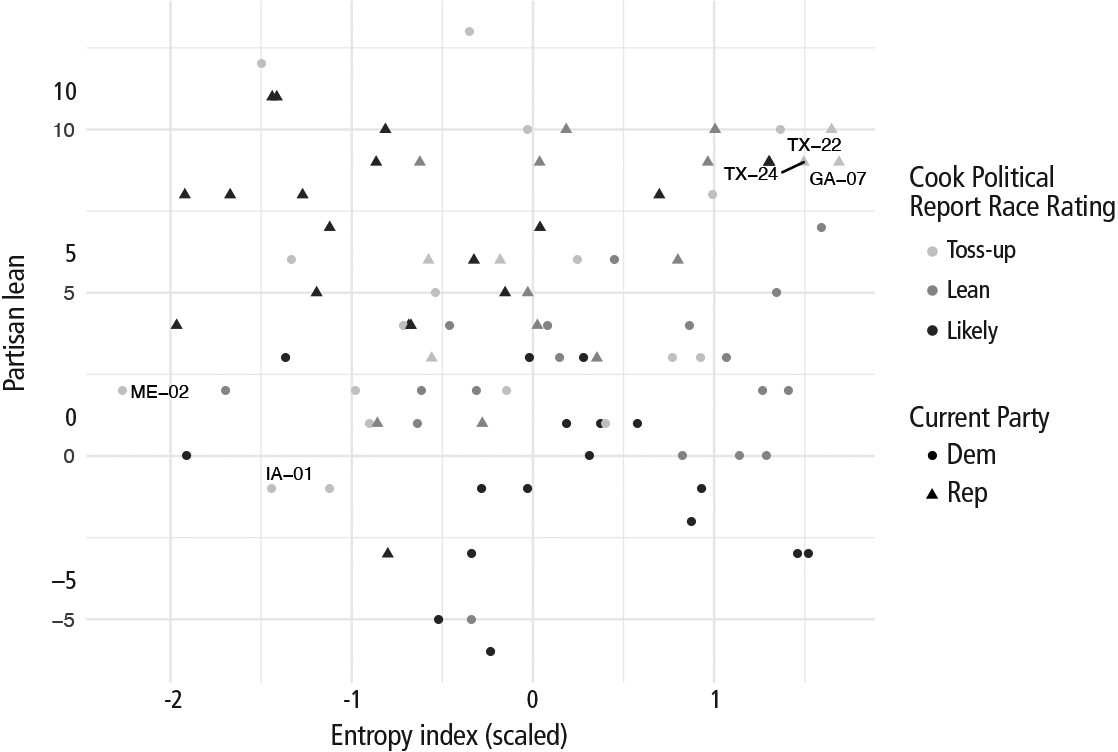
Democratic Representative Abby Finkenauer, the second youngest member of Congress, won Iowa’s 1st in 2018. The district represents the type of non-diverse, mostly White, district in which the parties vie for votes, and Whites make up 85 percent of residents. The 1st district voted for Trump in 2016 and a Republican representative in the previous two elections. In her campaign, Finkenauer focused on issues important to rural, largely white voters: rural broadband, senior drug prices, and health care. In otherwise Republican-leaning Districts, Democratic candidates have sometimes succeeded when they are particularly attentive to the concerns of rural voters. Also, as Democrats elected in largely White districts, both Finkenauer and Golden were reticent to get involved in the debate over impeachment.
The other electoral strategy seeks to win over wealthy, suburban districts where the recent Republican hold on power is at risk. Conventional wisdom argues that persuading college-educated women in these districts will be especially important. However, this strategy ignores the diversity of competitive Southern suburban communities.
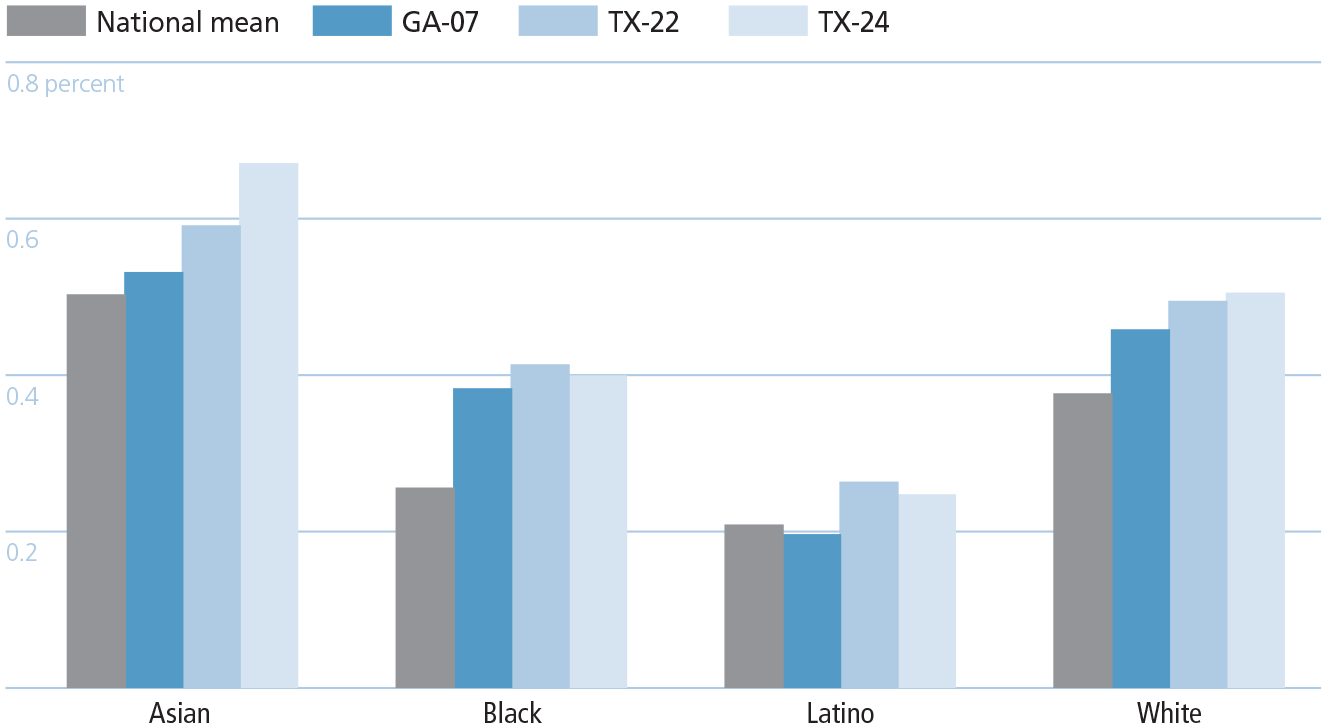
Percent of women with bachelor’s or higher degrees by race for select competitive districts
Source: NHGIS. North Carolina districts excluded
Every representative serving the three most diverse Republican-represented districts is retiring. Rob Woodall, who represents Georgia’s 7th district—the most diverse district in the country that is represented by a Republican—announced his retirement in June after winning the seat in 2018 by fewer than 500 votes. Less than half of the district’s residents are White, while Blacks and Latinos each make up 20 percent of residents, and Asians make up another 15 percent. The median household income in the district is $78,693, 21 percent higher than the average median household income in the U.S.
Similarly, Republican Representatives Pete Olsen and Kenny Marchant represent similar districts in Texas and have both announced their retirements. Olsen won five consecutive elections in the 22nd district, a suburban Houston district. Its transition to a competitive district is especially notable since it had been the seat won by both former House Speaker Tom Delay and former presidential candidate Ron Paul. Like the 7th District in Georgia, the district is wealthy relative to the national average: the median income among households in the district reached $88,234 in 2018. However, the population is not mostly White. The district includes Sugar Land, one of the most diverse suburbs in the country where people of color outnumber Whites five-to-three. Republican Representative Marchant’s district, north of Dallas, has a similar profile. It is slightly less wealthy, with a median income of $74,264, and includes a higher percentage of White residents, at 45 percent, and smaller percentages of Latinos and Asians.
In competitive elections between the parties, the national media has focused on White college-educated women, but women of color might be just as important in these wealthy, suburban districts. Figure 3 shows the percentage of women in each racial group who have a bachelor’s or higher degree at the national mean and in each of these newly competitive districts. A larger percentage of White women have college degrees in these three districts than in the average district nationally. However, except for Latinos in the Georgia 7th, a larger percentage of women of color also have college degrees than the average district. In fact, 15,389 more women of color with college degrees live in the Texas 22nd district than White women with college degrees. Winning over these voters will be crucial to any campaign victory.
Percent of Women with Bachelor’s or Higher Degrees by Race for Select Competitive Districts
Both parties will no doubt need to make strategic decisions about where to deploy resources in the coming election. They will also need to decide what national messages they want to convey. Many competitive races may come down to parties deciding how to solicit votes from both the rural population in the North and Midwest and suburban residents in the South. Existing data point to the fact that the political parties should be mindful that they are not chasing White electorates in both types of districts. Also, soliciting the votes of only White college-educated women could, however, cost them control of the House. As shown here, in many competitive districts, there is a growing percentage of college-educated women from all races and ethnicities—and these women are the gatekeepers to victory.