
Abstract
Morgan C. Matthews on whether the 2018 midterm election was unusual or part of a broader gender polarization pattern?
A wave of feminist activism following the 2016 general election energized the 2018 midterm election year, which was dubbed a “Year of the Woman” in politics. Record numbers of women ran for and achieved elective office at the local, state, and national levels. Nearly 3,500 women candidates ran for the 7,383 total state legislative seats across the country in 2018. Since state legislatures are considered an important step in pathways to higher office, this growth forecasts future change in the gender composition of statewide elective offices and Congress. However, the gains for women state assembly members in 2018 were concentrated in the Democratic Party while the number of Republican women legislators elected actually declined.
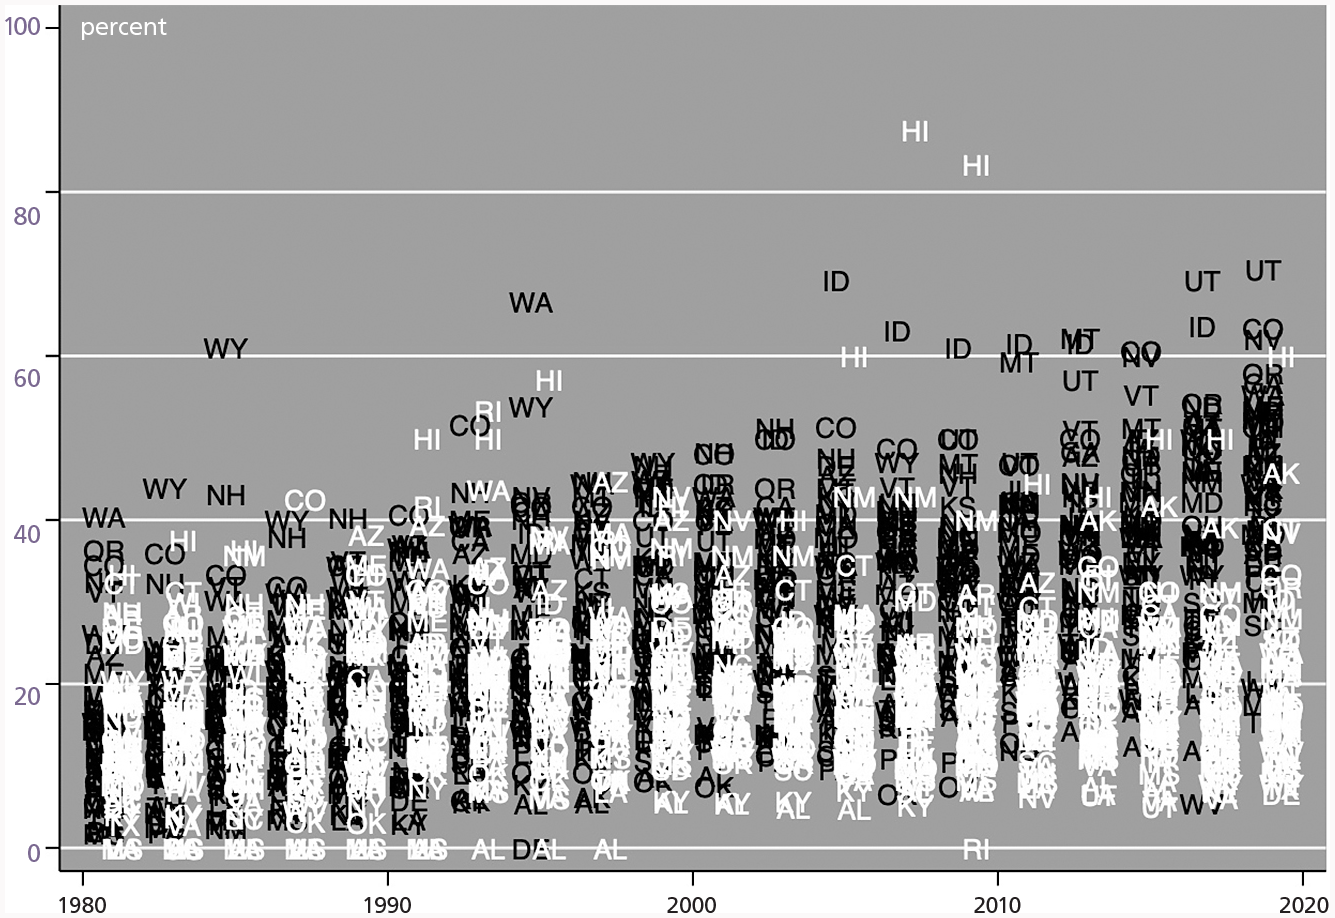
States with large Democratic majorities in their legislative chambers were the first to achieve gender parity in political representation. Nevada became the first state with a female-majority legislature (House and Senate combined) in 2019. Colorado’s State House was also gender-equitable in its representation after the 2018 midterm election. This milestone had previously been achieved in only one other state legislative chamber—the New Hampshire State Senate that was led by a Democratic majority in 2009-10. States with the smallest share of women serving in their assemblies (Tennessee—12 percent, Wyoming—13 percent, and West Virginia—15 percent) are all controlled by Republican majorities in the 2019-20 legislative session.
The “glass ceiling” of women’s political representation is structured and reinforced by the U.S. party system.
How do these exceptional cases compare with other partisan State Houses (that is, in all states except for Nebraska, which has a non-partisan legislature)? Was the 2018 election year unusual, or part of a broader pattern of gender polarization?
To address these questions, I turn to the centralized source of information on U.S. women’s political representation: the Center for American Women and Politics (CAWP) at Rutgers University. CAWP is the leading source of information on women serving in local, state, and federal elective offices. Prior to CAWP’s founding in the 1970s, “no one had bothered to count” women’s political presence in sub-national elective offices. CAWP launched their impressive Women Elected Officials Database for public use in June 2020. Here, I will focus on women’s representation in state legislatures after 1980, which is widely recognized as when a partisan “gender gap” emerged in mass politics.
Representative Alexandria Ocasio-Cortez at SXSW 2019.
Nrkbeta, Flickr CC

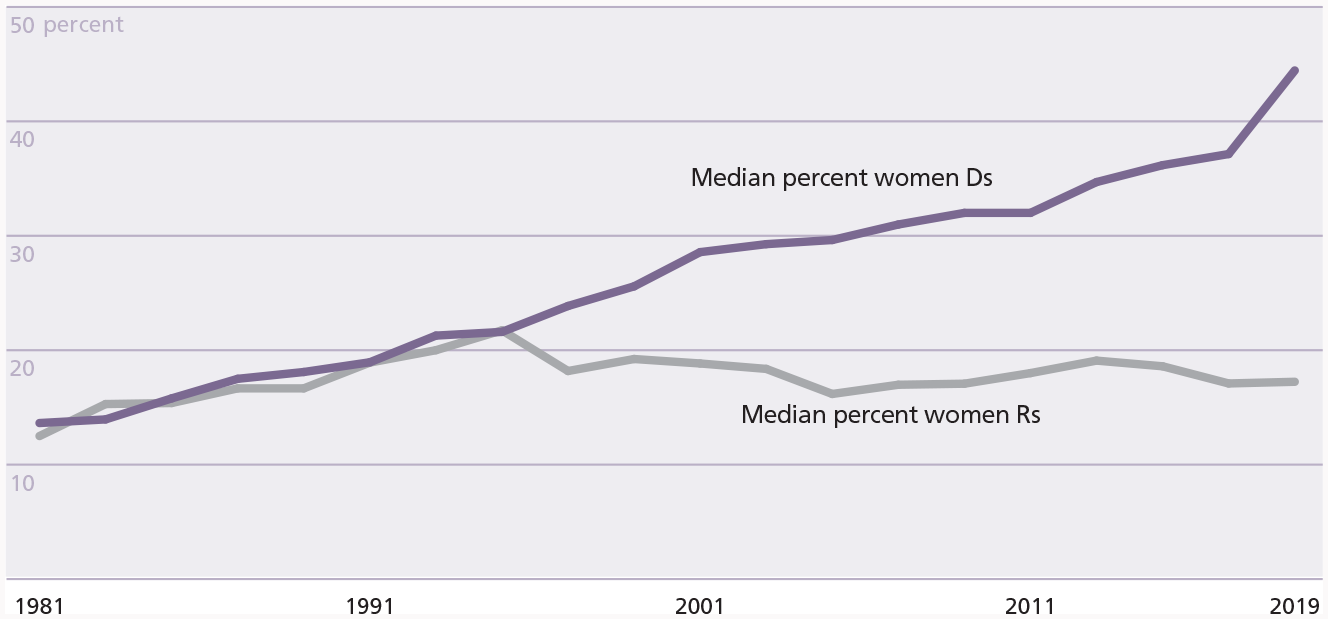
Representation of Party Women in State Houses, 1981-2019
Democratic and Republican State House caucuses represented women equally poorly throughout the 1980s. The median percent of Democratic and Republican women state representatives increased from about 14 percent in 1981 to 18 percent in 1989 (see Representation of women by party in all state houses, 1981-2019). At this time, neither political party at the national level consistently supported women’s rights measures, such as the Equal Rights Amendment (which was on the Republican Party platform until 1980).
It is not until the 1990s that state parties begin to diverge in their gender representation. The 1992 “Year of the Woman” saw a three-percentage point increase in Democratic women legislators in the median state (from 19 to 21.3 percent), compared to more modest growth in women’s representation among State House Republicans (from 19 to 20 percent). Sexual politics polarized what Pat Buchanan declared the “culture wars” at the 1992 Republican National Convention. At the state-level, overtly sexist measures—such as Colorado’s Amendment 2 banning protected status for sexual minorities—were passed by then-Republican-leaning states.
Women democrats and republicans in state houses, 1981-2019
Representation of women by party in all state houses, 1981-2019
After the “red wave” election of 1994, which was called the “Year of Angry White Men,” the share of Democratic women in State Houses across the country rose while it stagnated for Republicans. Gendered contests over social issues continued to distinguish the two parties as Republican majorities in Congress passed the Personal Responsibility and Work Opportunity Reconciliation Act (PRWORA) of 1996—a cornerstone of the “Contract with America.” In concert with these gendered issue realignments, numbers of Republican women assembly members declined from an all-time high of 21.7 percent in the median state in 1995 to 18 percent in 1997.
Disparities in the gender representation of state parties continued to grow after the turn of the millennium. On one hand, women’s political representation through their affiliation with state Democratic parties climbed steadily. Critical elections that contributed to Democratic women’s representational growth include the “blue waves” of 2008 and 2012. On the other hand, the median percent of Republican women state representatives has effectively flat-lined since 2000. Exceptions to this pattern include a notable drop in women’s share of Republican State House seats after 2004 and a modest uptick in Republican women serving in office after a conservative wave flipped several state legislatures to “red” in the 2010 midterm elections; by 2014 this pattern reversed once again.
Visualizing trends in women’s representation by party in all State Houses together provides additional nuance to this story of gender polarization (see Representation of women by party in all state houses, 1981-2019). The “floor” of Democratic gender inclusion rose in the mid-1990s, while it remained low among House Republicans in states such as Alabama. In the mid-2000s, the “ceiling” of women’s representation among State House Democrats rose, such that House Democratic caucuses in states like Idaho began to consistently achieve or exceed gender-parity. There are very few exceptions to the rule of Democratic-focused growth in women’s representation, and these cases tend to be marked by unusual circumstances. For instance, Hawaii’s small (51-seat) House of Representatives has an overwhelming Democratic majority; three of the five Hawaii House Republicans are women in the 2019-20 legislative session.
The 2018 midterm elections were widely declared a second “Year of the Woman” in politics, buttressed by backlash to the 45th president’s election that included women’s marches across the country. After 2018, women comprised a record 28.7 percent of State House seats (Democratic and Republican) in the median legislative chamber. The nearly five-percentage point increase in women’s share of seats in the median State House is entirely attributed to Democratic women candidates running and winning legislative seats. While the results of 2018 are unusual in the magnitude of gender change in state Democratic parties’ composition, this election is part of a longer historical pattern of gender polarization, as the charts above show.
Representative Ayanna Pressley at the 2019 AFGE Civil Rights Luncheon.
AFGE, Flickr CC
Representative Ilhan Omar speaking at a Hillary for MN event at the University of Minnesota.
Lorie Shaull, Flickr CC
Feeling represented by elected officials is a key ingredient for trust in government. When elected leaders in democratic institutions do not look like their constituents, faith in democracy wanes.
In sum, the “glass ceiling” of women’s political representation is structured and reinforced by the U.S. party system. Women’s advancement in most state Democratic parties has not been matched by similar progress in states’ Republican House caucuses. Moreover, the majority (60 percent) of state legislative chambers are controlled by Republicans. The growing gender disparity in the people state parties advance as candidates intersect with the dynamics of state party control of legislatures to place an upper limit on women’s political representation.
Representation Matters
Democratic institutions around the world have become less stable. The U.S. general elections and the U.K. Brexit referendum in 2016 are both clear examples of what happens when politics does not “feel” representative. Gender inequalities in state political representation, which the data show are increasingly stratified by political party control, have normative implications for democracy and material implications for policy.
Feeling represented by elected officials is a key ingredient for trust in government. When elected leaders in democratic institutions do not look like their constituents, faith in democracy wanes. In a 2018 study, Ashley English, Kathryn Pearson, and Dara Strolovitch find that citizens believe they are best represented by lawmakers who share their social identities. Who serves in elective offices also affects how those representatives act on behalf of their constituents. A study by Kenneth Lowande, Melinda Ritchie, and Erinn Lauterbach in 2019 draws on over 88,000 records of congressional communications to show that women and racial minority lawmakers are more likely to advocate for their constituents with whom they share identities. Thus, while social structures such as gender and race create barriers to political presence, they also serve as a critical mechanism of representation when political institutions’ membership reflects the diversity of the people they represent.
As political thinkers such as Jane Mansbridge, Iris Marion Young, and Anne Phillips have concluded, the social positions of the people who do the work of representing matters. Yet, all available evidence suggests that gender equality in state political representation will be elusive without bipartisan efforts to achieve a more inclusive democracy.