
Abstract
J. Aaron Hipp on measuring activity in public spaces.
Keywords
Weight, for most people, results as a function of calories consumed through food and calories expended through physical activity. The spaces we inhabit and our peers within them can influence our activity levels, from walking to get a coffee down the street, playing basketball in a gym, playing catch with a child in a park—really anything that gets our bodies moving.
Being active reflects more than a personal choice. It requires that spaces accommodate activity and that people can access those spaces. Recognizing this reality, the U.S. Surgeon General published, in 2015, a strategy document called “Step It Up!” that recommended designing “communities that make it safe and easy to walk for people of all ages and abilities.” The report also called for improved research on the relationship between community design and physical activity.
As in many areas of research, scholars like me are limited in that, often, we can only assess the places where people are already active. Do certain designs increase activity, or are active people simply clustered in spaces with particular designs? To find out where, when, what, why, how, and with whom we are active, I needed a way to measure how communities have changed spaces and how such changes affected the use of these spaces.
The answer came during a meeting with my colleague, Robert Pless. He specializes in computer vision and had been archiving images from 30,000 public, online, outdoor webcams. We found almost 7,000 public, outdoor webcams recording active behaviors in public spaces across the globe in his Archive of Many Outdoor Scenes (AMOS). AMOS stores an image from each of the 30,000 cameras every 29 minutes. By archiving images every 29 minutes rather than 30, AMOS is able to capture an image from each minute of a day over the course of a month. Pless had images from many of the cameras dating back to 2006.
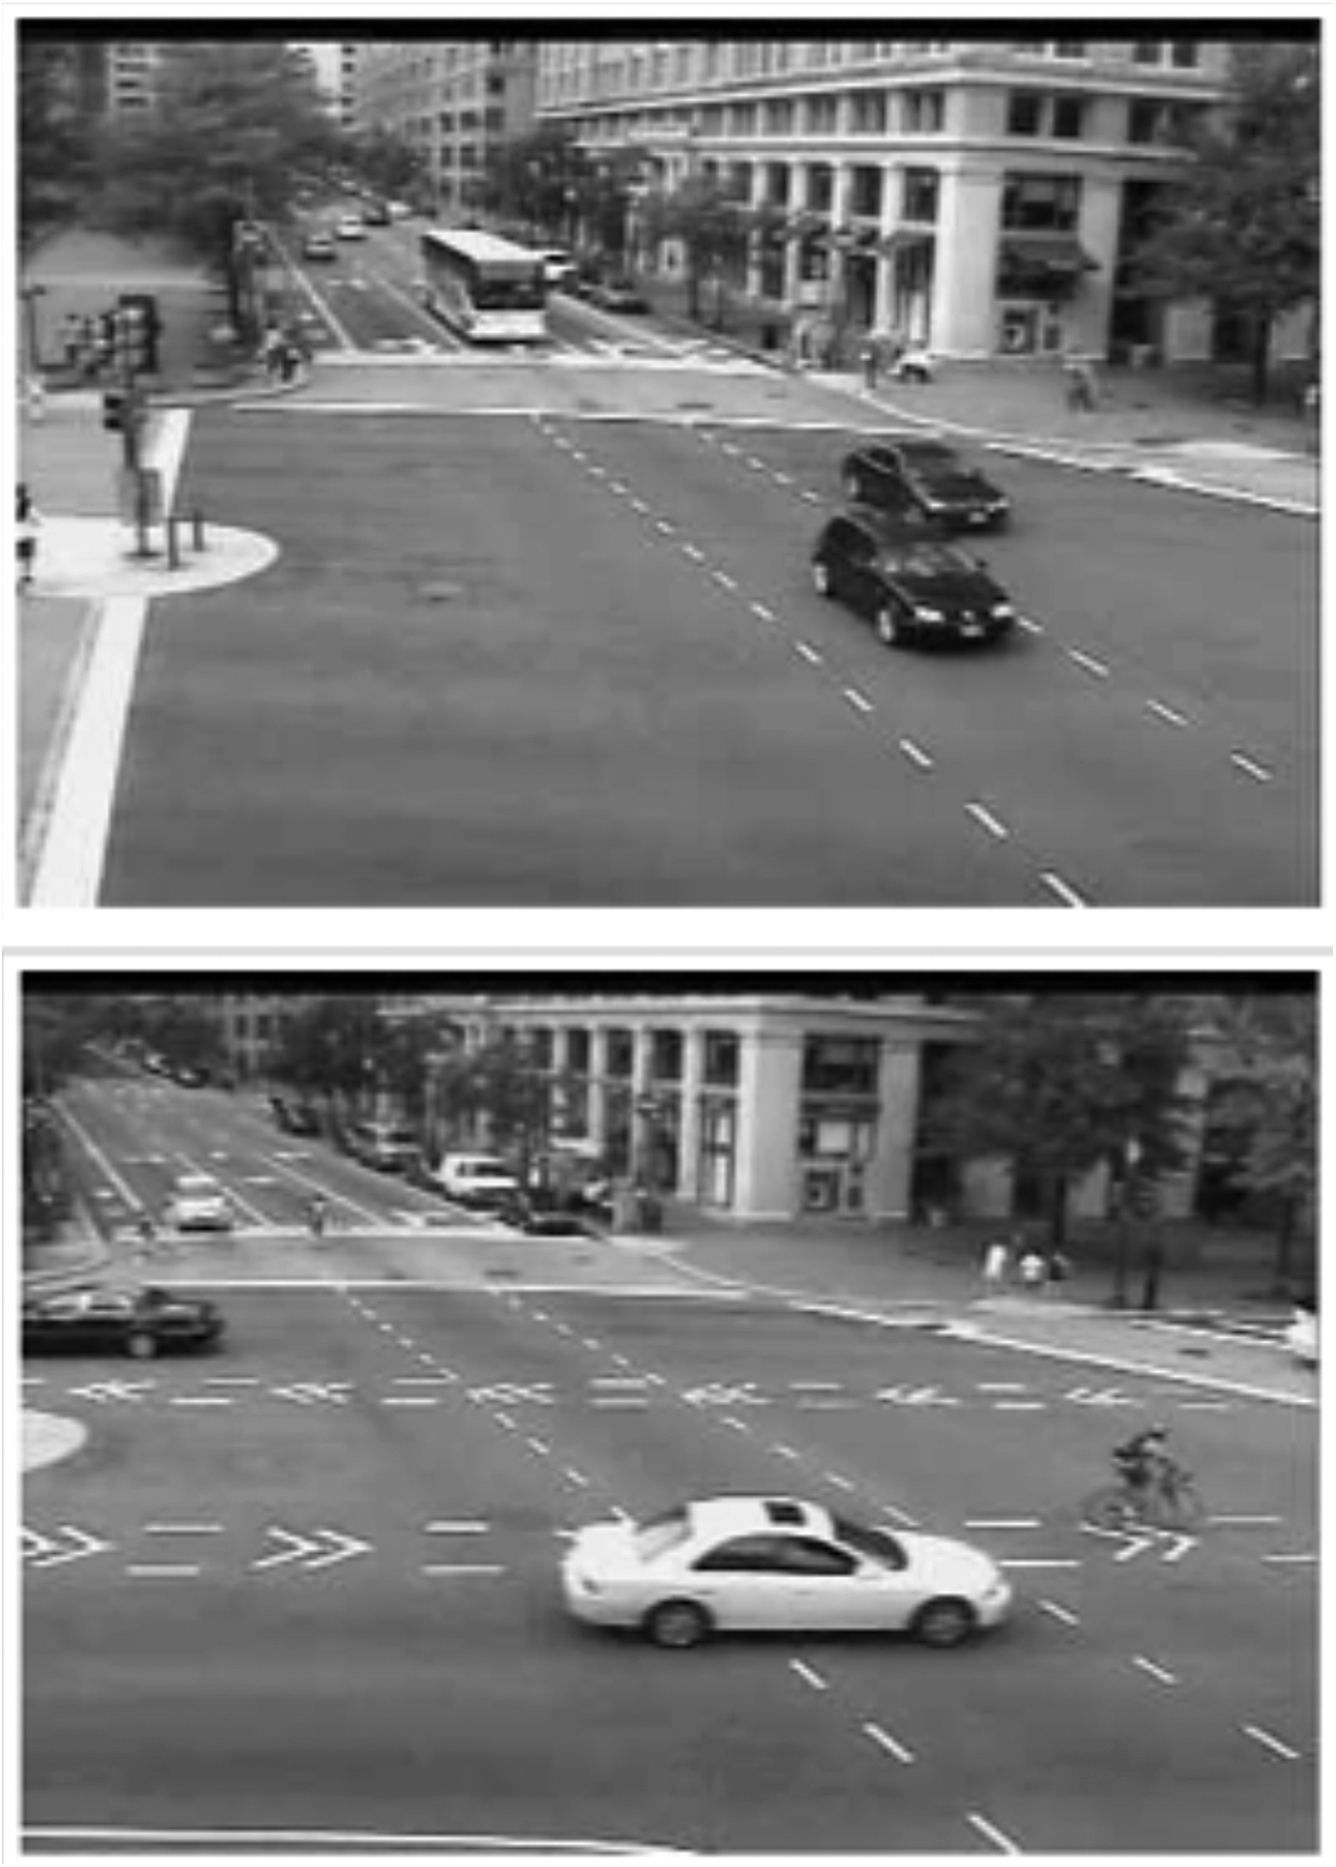
Example images from Pennsylvania Avenue NW and 9th Street NW used in case study. Please visit contexts.org/activitymaps for full-color images.
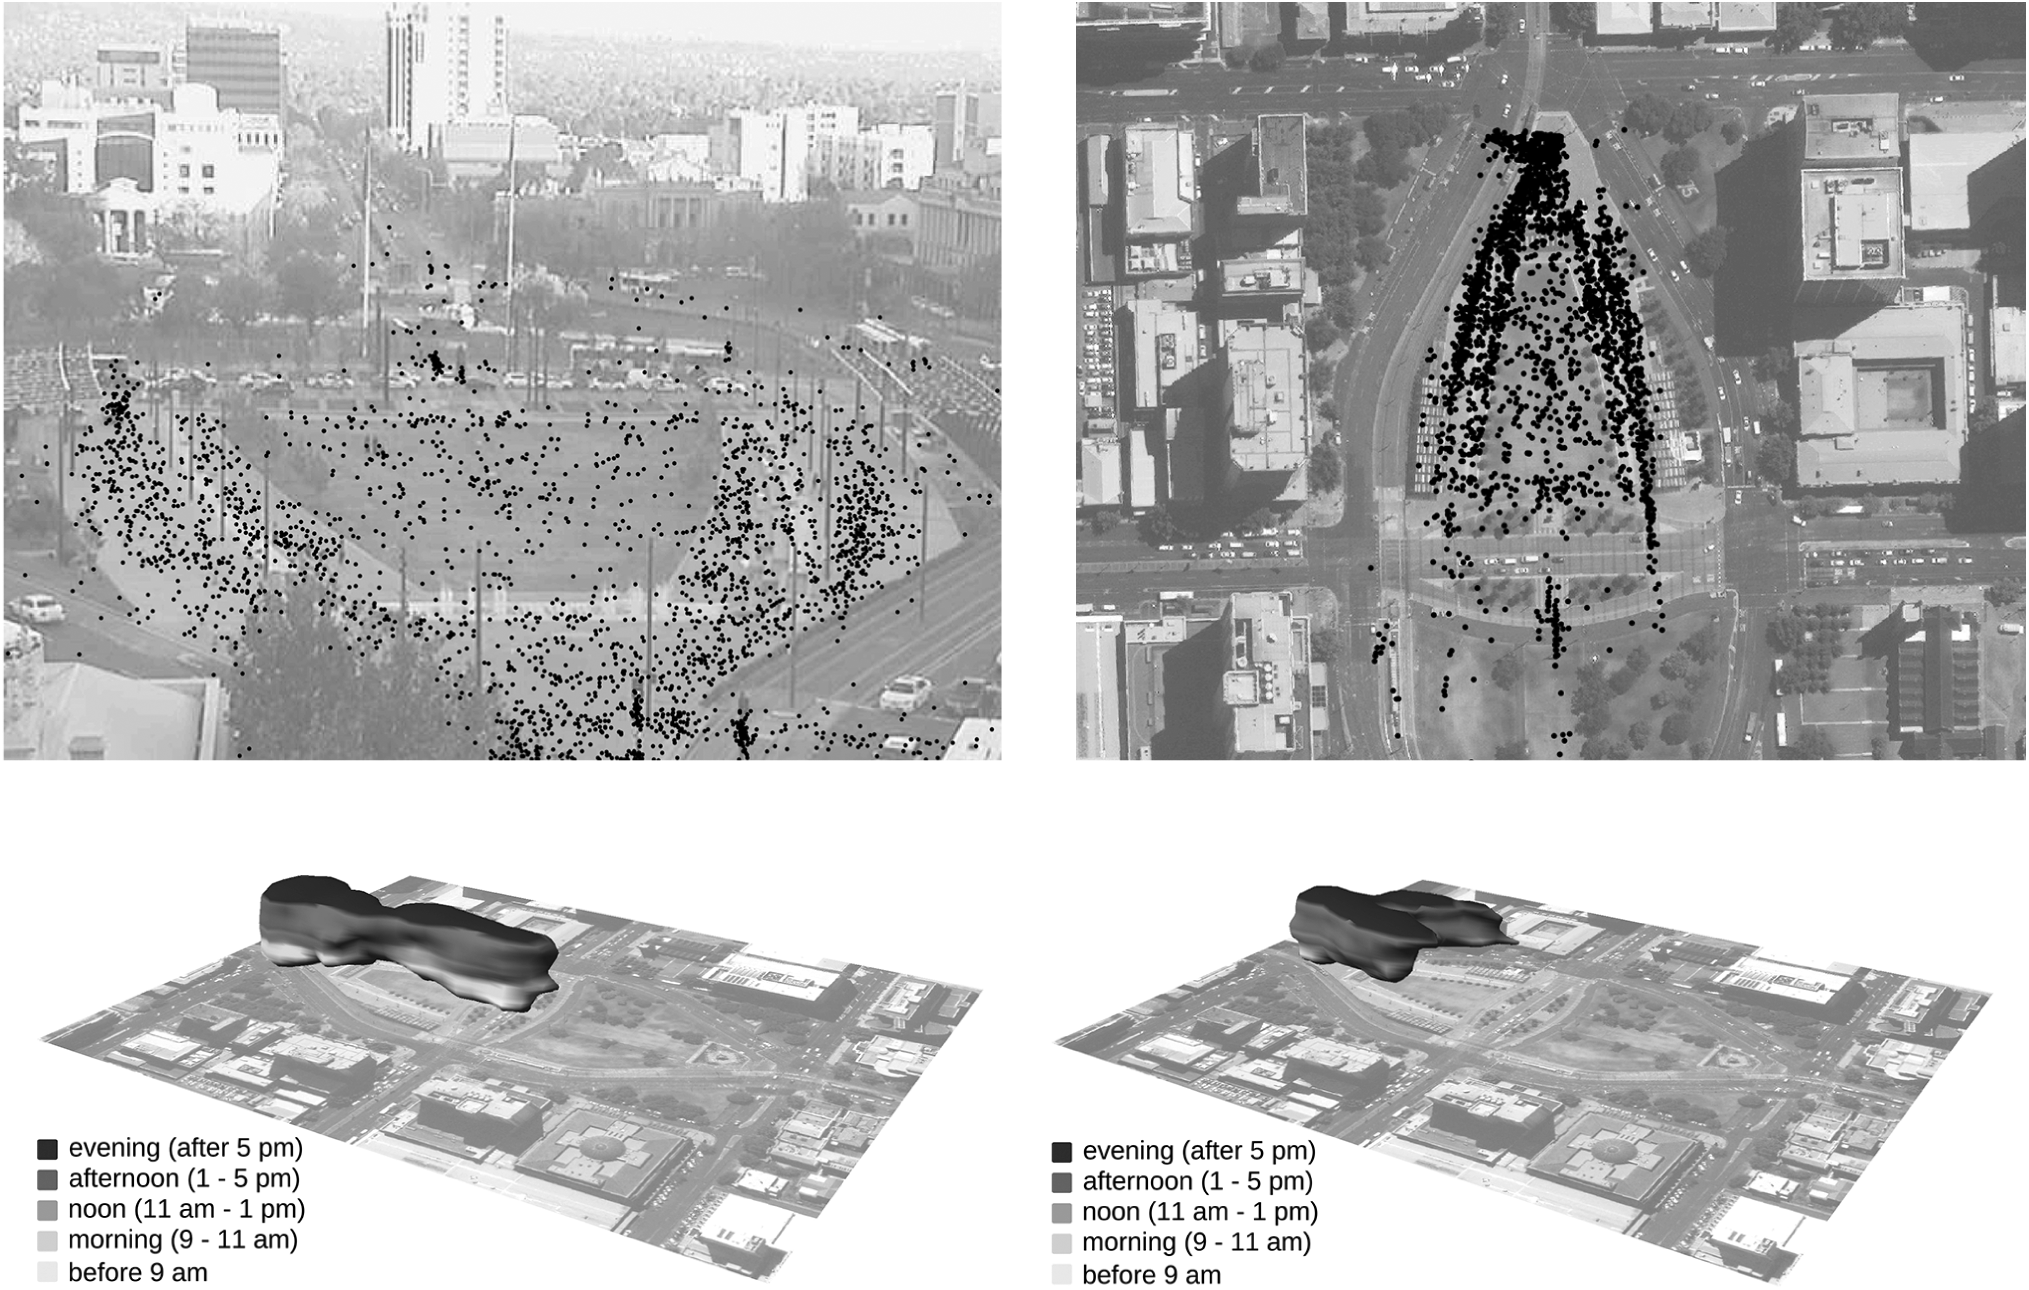
A: Example image from the Victoria Square, Adelaide, Australia, webcam with one week’s visitation. Shade of dot corresponds to time of day. B: Same data as A, but from Google Earth view (georeferenced dots). C: Georeferenced pre-redevelopment data presented as a space-time cube. D: Post-development data presented as space-time cube. *Note all Google Earth images display Victoria Square post-redevelopment. Please visit contexts.org/activitymaps for full-color images.
I tested the idea that publicly available webcams could be used to evaluate active living in public spaces in Washington, DC The District Department of Transportation (DDOT) has dozens of traffic cameras trained on intersections and streaming online. In 2010, DDOT installed a two-way bike lane in the center of Pennsylvania Avenue (see p. 71). We compared images taken from traffic cameras along Pennsylvania Avenue from one week in 2009, before the installation of the bike lanes, and the same week in 2010, following the installation. With images captured every 29 minutes, our sample comprised 240 images. We counted the number of bicyclists present in each image.
The bike lanes mattered. Images in 2010 were over 3.5 times more likely to show a bicycle than images captured in 2009. If you build it, cyclists will come.
With billions of images of public space and immense computational power, there are seemingly limitless new questions to explore.
Based on our success using such captured images in Washington, DC, we have begun to focus on settings throughout the world. To expand our geographic focus, we needed a way to increase the number of images we could gather. With partial funding from the National Cancer Institute of the National Institutes of Health, we paid volunteers on Amazon’s Mechanical Turk, or MTurk, to code our images for one cent per image.
We tested how well five unique MTurk workers annotated the 240 images from our Pennsylvania Avenue study. We entered the task onto the platform at 5pm and returned to the office the next morning with all images annotated and only $12.00 removed from our Amazon account. This strategy proved more efficient than counting bikes ourselves. We ran further tests to assess the reliability of MTurk workers. We uploaded 1,500 images from six different cameras and asked the MTurk workers to draw a box around each bicycle and cyclist, pedestrian, and vehicle. Four of the five MTurk workers provided us with reliable data.
We next turned our attention to Victoria Square in Adelaide, Australia (p. 72, top). In 2013, the square began a redevelopment at a cost of AUD $28 million and the stated goals of increasing pedestrian linkages, activities, events, and attractions. We had archived images from AMOS before and after this public investment in a space that hopefully encourages active living. Unlike our Pennsylvania Avenue study in DC, this time we wanted to know where and when the square was being used, not just number of users. Using the timestamps on the photos and the ratings from the MTurk workers, we classified usage at different times of day and on different days.
To present the data visually, I worked with Anna Petrasova, who created density maps marking when and where pedestrians and cyclists appeared in our images. To improve our visual images, she developed space-time cubes (p. 72, bottom). Space-time cubes create three-dimensional forms that mark the usage of space over time. The mass of each cube corresponds to the number of people present in the image, located spatially on the 2D image, and varies in the vertical dimension by the time of usage (morning being closest to the image and evening being furthest away).
With these images, we were able to show that more people used Victoria Square after the redevelopment. We also showed that they used the space differently. Such data representations allow researchers, urban planners, parks and recreation departments, public health officials, among others, to quickly visualize how people use, do not use, and change their uses of spaces at different times of day.
With over 100,000 of the 1.1 billion AMOS images now annotated, we are working to move away from crowd sources and toward machine learning for the annotation of scenes. This has been successful with some cameras, but remains a challenge with others. Cameras that are steady, do not rotate, and have limited sun glare are best for training machine learning algorithms to distinguish pedestrians, cyclists, and vehicles across different camera scenes. Once trained, our current algorithms are able to reliably annotate an image in one second.
We are also installing our own web-cameras and trail cameras to evaluate use of space and return on public space investment. Trail cameras have traditionally been used to capture wildlife in wooded areas, along trails, and at the urban/forest intersection. Trail cameras can be set to either take a photo when a deer, or bicyclist, is passing by the lens, or to capture a photo after a set number of minutes. Because we control the installation, angle, and scene of capture, we face fewer challenges using machine learning with these cameras compared to the public cameras included in the AMOS dataset. By adding machine learning, we create the ability to evaluate use of public space rapidly. We work to turn around data and visualizations so stakeholders can test interventions and programming.
I am cognizant of the ethical conundrum of using technology in the way that I do. Yet, the advancement of cameras in public space is inevitable as we grow into a more informational society and push forward “smart cities.” We are appropriating these online images to understand how people use space, and we share our results with stakeholders so they can create more active and safe spaces. We avoid posting images that would allow identification of individual faces. Meanwhile, we are the only people who access our trail cameras, since they go straight from the field to the computer for analysis. Only ethics-bound graduate students view these images.
We believe images, specifically those automatically capturing public spaces, provide vast opportunities to meet the Surgeon General’s call to fill the evidence gaps in evaluating and creating active, walkable places. Further, with billions of images of public space and immense computational power with which to annotate images, there are seemingly limitless new questions that can be explored. A picture is worth way more than 1,257 words.