
Abstract
Chronic subdural hematomas (CSDHs) frequently affect the elderly population. The postoperative recurrence rate of CSDHs is high, ranging from 3% to 20%. Both qualitative and quantitative analyses have been explored to investigate the mechanisms underlying postoperative recurrence. We surveyed the pathophysiology of CSDHs and analyzed the relative factors influencing postoperative recurrence. Here, we summarize various qualitative methods documented in the literature and present our unique computer-assisted quantitative method, published previously, to assess postoperative recurrence. Imaging features of CSDHs, based on qualitative analysis related to postoperative high recurrence rate, such as abundant vascularity, neomembrane formation, and patent subdural space, could be clearly observed using the proposed quantitative analysis methods in terms of mean hematoma density, brain re-expansion rate, hematoma volume, average distance of subdural space, and brain shifting. Finally, artificial intelligence (AI) device types and applications in current health care are briefly outlined. We conclude that the potential applications of AI techniques can be integrated to the proposed quantitative analysis method to accomplish speedy execution and accurate prediction for postoperative outcomes in the management of CSDHs.
Keywords
Introduction
Chronic subdural hematomas (CSDHs) commonly occur in elderly individuals older than 70 years who had sustained a mild head injury, usually 3 weeks following brain trauma. 1 Due to the global aging of population, the prevalence of this disease is gradually increasing. The overall incidence of CSDHs is estimated at 1.7 to 21 per 100 000 persons per year. 2,3 Throughout all the meninges, the subdural space is less tight and potentially vulnerable to trauma, when compared to the junctional layers of dura and arachnoid membrane. The layer of dura-arachnoid interface, commonly designated as subdural space, is composed of the dural border cells. 4 The formation of CSDH initiates the separation of dural border cell layer following a head trauma. The subsequent accumulation of cerebrospinal fluid and blood in the dural border cell layer cavity may facilitate the expansion of CSDH, accompanied by generation of outer and inner membrane after approximately 1 to 3 weeks, respectively. 5 Unlike acute subdural hematomas that represent a sudden onset of rapidly progressive neurological deterioration, CSDHs are characterized pathologically by the gradual accumulation of blood in the subdural space of brain and likely compression of the eloquent or noneloquent areas of the brain. Therefore, CSDHs can present with various symptoms, such as dizziness, memory disturbances, epilepsies, gait ataxia, hemiparesis, hemiplegia, weakness, and consciousness disturbance. 6 Disease expression patterns may be insidious, from light headache to detrimental coma. Chronic subdural hematomas are also well known as “great imitator.” 7
Pathophysiology of CSDHs
A variety of molecular pathways are often implicated in the underlying pathologies of CSDHs, such as inflammatory cascade, angiogenesis, vasopermeability, and microbleeding due to imbalance in hypercoagulability and hyperfibrinolysis. 8 -10 The outer membrane consists of abundant capillary vessel networks. Both exudation from these permeable capillaries 11 and repeated microhemorrhages from the neomembrane 12 facilitate the enlargement of CSDHs.
The established classification of underlying pathogenesis into 4 stages 13 enables understanding the formation of CSDHs. The scheme includes the different stages of initiation, development, maturity, and absorption of CSDHs. During the initial stage, bleeding risk is low because the tendency for coagulation or fibrinolysis is equal. The stage of hematoma development exhibits increased vascularity than the initiation stage. The maturation stage characterizes the formation of neomembrane of the outer membrane, which results from an increased risk of microhemorrhages. During the absorption stage, bleeding risk is the lowest because fibrosis of the outer membrane occurs.
Postoperative Recurrence of CSDHs
Surgery is prescribed to individuals presenting with persistent neurological symptoms. Another indication for surgery is an increase in the subdural collection resulting in cerebral compression in subsequent computed tomography (CT) images. One or more burr holes are created to relieve the intracranial pressure through the evacuation of hematoma. Despite the simplicity of this surgical technique, high recurrence rate even after surgical intervention has been reported ranging from 0.35% to 23%. 14 -17 The high rate of postoperative recurrence is a critical concern for frontline physicians. However, the mechanisms underlying postoperative recurrence of CSDHs are complex and controversial. In general, these factors can be generally grouped into 2 categories: namely anatomical and physiological factors. 18
Anatomical factors affecting CSDHs recurrence include brain aging and CSDHs with bilateral and skull base involvement. It might be difficult for the brain to rebound to its original state after hematoma evacuation due to the inelastic characteristics of an atrophic brain. 19 -21 Excessive extension of subdural space, occupied by bilateral CSDHs or skull base involvement in the preoperative state, is another factor related to the delayed brain recoil in postoperative status. 22 Consequently, impaired postoperative brain expansion delays the obliteration of the subdural space, which in turn facilitates brain shifting within the patent subdural space. Persistent shifting of the brain likely causes damage to the bridging veins, 23 resulting in subsequent bleeding. 19,24
Physiological factors influencing CSDHs recurrence include general physical conditions that predispose bleeding and increase the degree of angiogenesis within the CSDHs. Victims with bleeding tendency or coagulopathy, for example, leukemia, liver disease, chronic renal failure, sepsis, and disseminated intravascular coagulation, are at higher risk of postoperative recurrence. 9,22,25,26 Moreover, during the pathogenesis of CSDHs, hematomas with hyperfibrinolytic activity tend to have higher risk of repeated microbleeding and postoperative recurrence. For example, CSDHs with increased vascularity 27 in the outer membrane with neomembrane formation, 13 as characterized by high or mixed density of CSDHs in CT imaging, 28 tend to have a higher postoperative recurrence rate. Clinicians must be attentive in order to identify the condition and execute specific diagnostic procedures based on the preoperative CT images.
Computed Tomography–Based Quantitative Assessment: Evaluating Pathological Features Associated With Postoperative Recurrence of CSDHs
Postoperative recurrence rate is highly correlated with the following elements: (1) preoperative hematoma with high vascularity, (2) prominent neomembrane, (3) prolongation of postoperative brain expansion, (4) persistent patent subdural space and prolonged patency of subdural space, and (5) postoperative brain shifting with subsequent vessel tearing on account of the above factors. Parts of the abovementioned pathological features, (1) and (2), can be identified in CT and magnetic resonance imaging (MRI) scans, which implies higher risk of bleeding 29 : (1) iso- or hypo-signal intensity in preoperative T1WI MRI, 30 (2) mixed low and high signal intensity in preoperative T2WI MRI, 21 (3) high-density, 29 mixed-density, 31 and separated type 28 in preoperative CT images. However, qualitative assessment methods are unable to quantify pathological features of hematomas, as well as temporal and spatial changes in brain shifting postoperatively. We present an overview of CT-based quantitative analysis for pathological features underlying postoperative recurrence of CSDHs in terms of (1) preoperative mean hematoma density (MHD), 32 (2) postoperative brain re-expansion rate (BRR), 33 (3) preoperative and postoperative hematoma volume, 33 (4) temporal and spatial changes in postoperative brain shifting, 34 and (5) postoperative average distance of subdural space (ADSS). 34 The proposed computer-assisted quantitative assessment provides a simple and practical research platform. We believe that these quantitative methods would aid in clear observation and analysis of the changes in preoperative and postoperative CSDHs, thereby helping physicians to understand the disease progression thoroughly and undertake measures to arrest postoperative recurrence. The flow of quantitative image processing is shown in Figure 1.

Diagram of the system for computer-assisted quantitative methods to obtain parameters related to postoperative recurrence in chronic subdural hematomas in terms of mean hematoma density (MHD), hematoma volume, brain re-expansion rate (BRR), average distance of subdural space (ADSS), and brain shifting. Consistent CT parameters including field of view (FOV), matrix size, and splice space are required to ensure consistent imaging scaling. Computer-assisted quantitative analysis software is utilized to process the computed tomography (CT) imaging. For axial CT slice, hematoma and cortical surface can be manually segmented. The density and area of the traced hematoma and the distance of subdural space can be quantitatively measured. The respective parameter obtained from each axial CT slice will be brought into respective calculation formulas to determine the respective values of MHD, hematoma volume, BRR, ADSS, and brain shifting.
Quantitative Measurement of MHD in CSDHs
The increase in vascularity and proliferation of the outer membrane within CSDHs is associated with the formation of hyperdense CSDHs, which preferably contribute to a higher postoperative recurrence rate. This quantitative measurement of MHD calculates the overall average value of the entire subdural hematoma, which suitably reflects the extent of hyperdense components within a hematoma.
As shown in Figure 2A, the use of image analysis software (PACS) helps to calculate the density of the traced hematoma, presented in Hounsfield units (HU) for each axial slice. In patients with unilateral CSDHs, MHD can be defined as follows. A, Chronic subdural hematoma (CSDH) can be encircled, and the density of the traced hematoma is calculated and presented in Hounsfield units for each axial slice using computer-assisted quantitative analyses (AGFA, PACS Web 1000 system). B and C, Unilateral CSDH. Analysis (c) preoperative and (d) postoperative computed tomography (CT) images. D-E, Bilateral CSDH. Analysis (e, f) preoperative and (g, h) postoperative CT images. F, Unilateral CSDH. G, Bilateral CSDH. Diagram showing a brain shift (red arrows) between CT scans on time point E (outline in green) and L (outline in yellow). H, Distance of subdural space is indicated as red line (from the cortical surface to skull bone).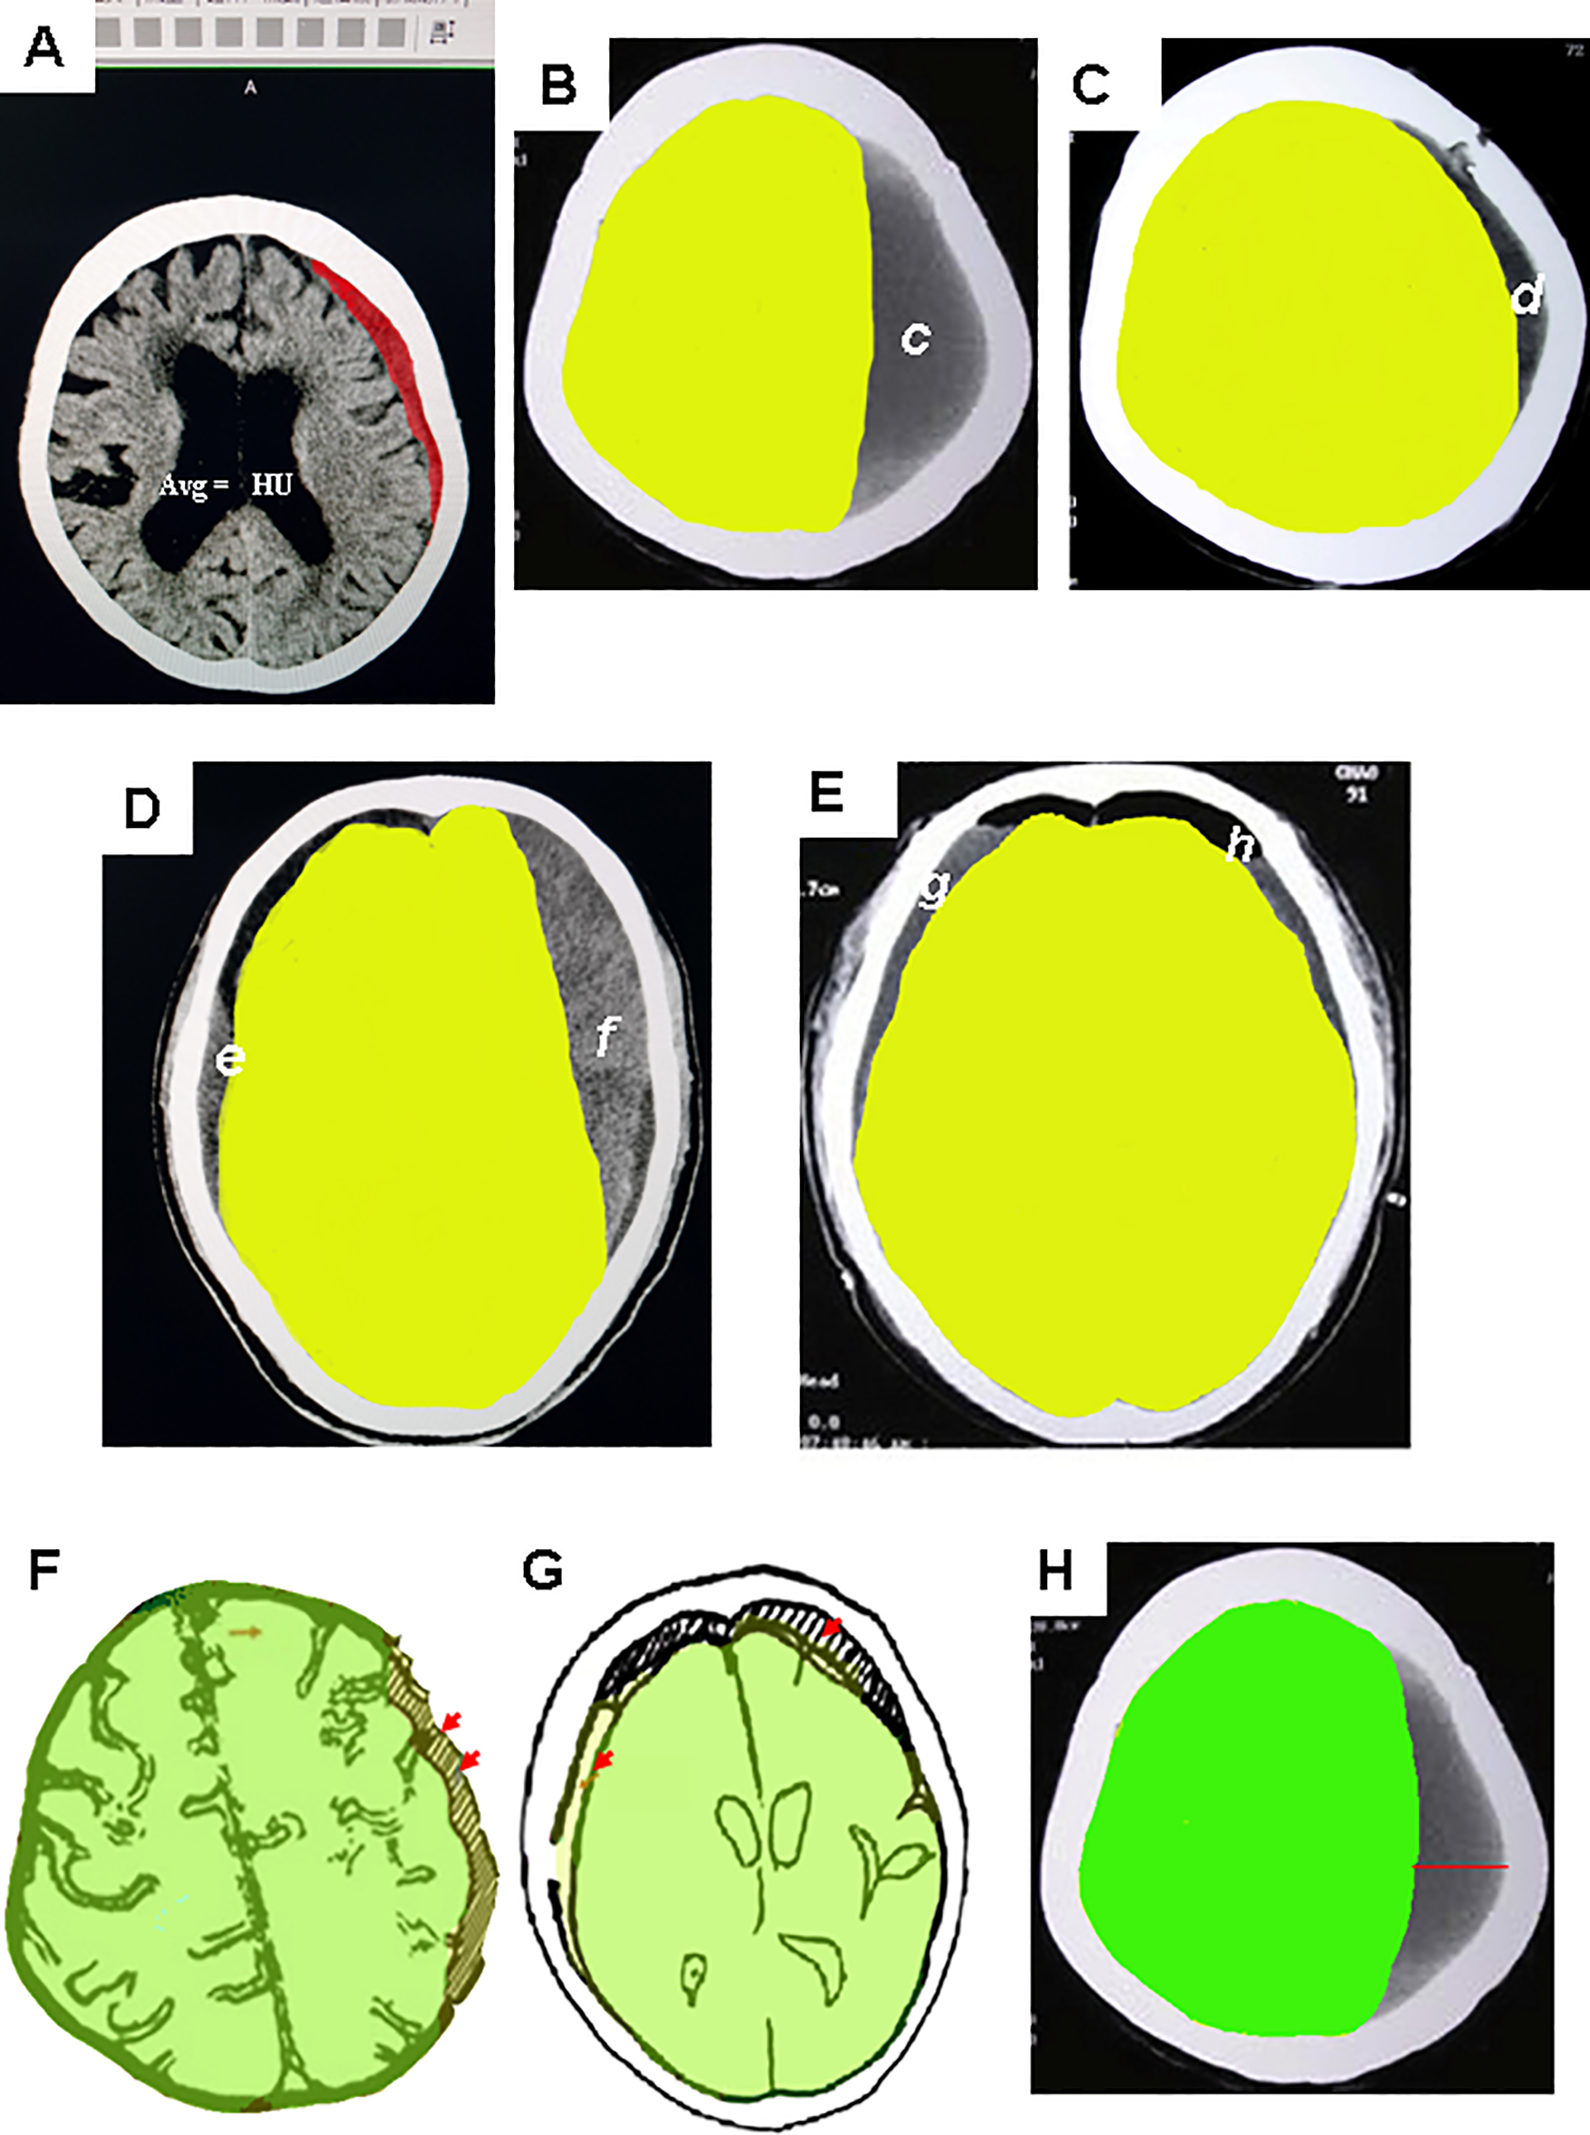

where Ai = HU of the traced hematoma quantified for each axial CT slice (i = serial CT slice number).
In patients with bilateral CSDHs, MHD is defined as follows.

where Bi = average HU of the traced hematoma on both sides for each axial CT slice (i = serial CT slice number).
Using this algorithm approach, MHD was statistically proven to be an independent and significant prognostic factor related to the postoperative recurrence of CSDHs. The MHD increased with the risk of postoperative recurrence. Comparatively, an increase per unit in MHD of CSDH elevated the odds of postoperative recurrence by 1.2. 32
Quantitative Measurement of Hematoma Volume in CSDHs
Quantitative volumetric image analysis is helpful for a detailed comprehension of the development of CSDHs and therefore helps minimize the postoperative complications. The application of quantitative image analysis software helps assess the temporal changes in hematoma volume at different time points. After obtaining the calculated volume, we can further speculate the situation, the patency of subdural space, and the expansion ratio of the brain (ie, BRR) following hematoma evacuation.
For each CT axial slice, margin of the hematoma can be manually segmented according to the calculation criteria and quality control principles set by each institution to minimize the inter- and intraobserver bias. Specific caution should be exercised for patient with unclear hematoma boundaries, for example, homogenous isodense type, which has to be excluded because it is difficult to distinguish the hematoma margin from the brain parenchyma. Hematoma volume can be calculated with the use of imaging software as the product of the area of the hematoma can be processed by the web-based PACS or other commercial image analysis software. 35,36
For each axial slice, area of the traced hematoma can be presented in square millimeters. Hematoma volume for each axial CT slice was calculated as the product of the area of the hematoma and the corresponding slice thickness. The total hematoma volume is calculated by adding the respective volume of each CT slice.
Quantitative Measurement of Postoperative BRR in CSDHs
The predisposing factors associated with extended postoperative subdural space, for example, brain atrophy in the elderly patients or CSDHs with bilateral or skull base extension, are likely to delay brain expansion after surgery. This can potentially cause impaired postoperative BRR and consequently a higher recurrence of CSDHs.
In patients with unilateral CSDHs, BRR can be defined as follows.
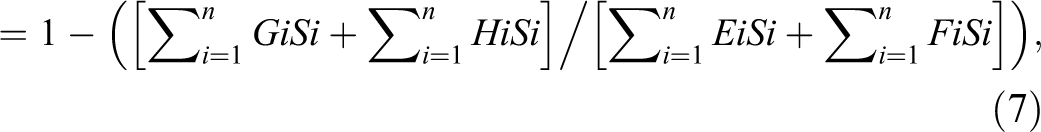
Brain Re-Expansion Rate in Unilateral CSDH


where
In patients with bilateral CSDHs, BRR is defined as follows:
Brain Re-Expansion Rate in Bilateral CSDHs


where
Quantitative Measurement of Brain Shifting in CSDHs
Under the circumstances of impaired brain re-expansion as discussed in the previous section, the subdural space tends to be persistently patent, and the brain is likely to shift within such patent space. This can, in turn, have associations with postoperative recurrence.
It is important to ensure that the CT images of the 2 time points under comparison are on the same horizontal plane with the same anatomical position. Each axial CT slice with the same serial number from the 2 time points is selected for image processing. This ensures that slices from different time points are of the same anatomical level and scale.
At the 2 time points of research interest, each axial CT slice with the same serial number is imported into the image analysis software. Here, we demonstrate the use of commercial software, Adobe Photoshop software version 7.0 (Adobe Systems Inc, San Jose, California). The contour of the cortical surface can be manually traced and corrected in accordance with the normal anatomical structures. Respective cortical contour of the cortical surface from the 2 time points is processed with the Photoshop image editing tool.
For the assessment of brain shifting, CT images obtained at the earlier time point (referred as time point E) will be superimposed on those obtained at the later time point (referred as time point L). As shown in Figure 2F, on each axial CT slice of time point E, the contours of the cortical surface are traced manually and outlined with a color using the fill tools in Photoshop. Each image of the time point E (green outline) superimposes on the same serial slice from axial CT slice of time point L (yellow outline).
For unilateral CSDHs, the cortical contours of the unaffected side are aligned with each axial slice. In each axial slice, the level of brain shifting is defined as the maximal difference in millimeters of the cortical surface between time point E and time point L on the side with the hematoma (indicated as arrows, Figure 2F).
In each axial slice, the value of brain shifting will be positive if the cortical margin of time point L is situated more toward the right to that of time point E. Conversely, negative value of brain shifting will be observed if the cortical margin of time point L is situated more toward the left to that of time point E.
Brain shifting in unilateral CSDH is defined as follows.

where Ji = value of brain shifting quantified for each axial CT slice (i = serial CT slice number).
As shown in Figure 2G, for bilateral CSDHs, each image of time point E (green outline) superimposes on the same serial slice from axial CT slice of time point L (yellow outline). The respective falx cerebri is overlapped as the reference in each axial slice of time point E and time point L. For each axial CT slice, one can calculate the respective values of brain shifting on both sides (indicated as arrows at both sides, Figure 2G). Similar to the calculation principle with unilateral hematoma, positive value of brain shifting represents a more right-sided deflected cortical margin of time point L than that of time point E; the opposite states the negative value for brain shifting. For each axial slice, the value of brain shifting will be determined by adding the value for brain shifting on both sides.
Brain shifting in bilateral CSDHs is defined as follows:

where Ki = sum of brain shifting of both sides in each axial CT slice (i = serial CT slice number).
An implementation of this algorithm in clinical practice is to evaluate differences between unilateral and bilateral CSDHs in terms of postoperative brain shifting. Results showed that bilateral CSDHs were found to exhibit greater extent of brain shifting than their unilateral counterpart between postoperative days 30 and 60 (P < .001), indicating higher risk of postoperative recurrence in bilateral CSDHs. 34
Quantitative Measurement of ADSS in CSDHs
Exploring the ADSS is another method to investigate postoperative recurrence, in addition to MHD, BRR, and brain shifting. At the time points of research interest, the distances from the cortical surface to skull bone will be measured for each axial CT slice (indicated as red line, Figure 2H). The calculated value is presented in millimeters for each axial slice. In cases with unilateral CSDH, only the affected side is measured. For bilateral CSDHs cases, both sides are measured for analysis.
In patients with unilateral CSDH, ADSS is defined as follows:

where Li = maximal distance from the cortical surface to bone for each axial CT slice (i = serial CT slice number).
In patients with bilateral CSDHs, ADSS can be defined as follows.

where Mi = sum of maximal distance from the cortical surface to skull bone of both sides in each axial CT slice (i =serial CT slice number).
The use of this calculation formula was described clearly in the literature. 34 Postevacuation subdural space on the postoperative day 60 (late phase) was statistically greater in bilateral CSDHs than in unilateral CSDH. 34 Through these quantitative methods as mentioned, we can easily deduce the possible postoperative recurrence in CSDHs.
Correlation Between Qualitative and Quantitative Methods for CSDH Recurrence
In general, qualitative methods commonly present research trends, whereas quantitative methods further digitize this trend. An example of this relationship is demonstrated. The Nakaguchi scheme represented 4 stages in the pathogenesis of CSDHs. The priority order of postoperative recurrence rate of this qualitative study was: separated, laminar, homogenous, and trabecular types. 13 A significant linear relationship between MHD and the abovementioned priority order of recurrence was statistically proven. 18 Thus, the clinical observation could be reasonably postulated. Such patients among CSDH cases, which mostly comprise of the majority of hyperdense components (as a qualitative finding), or with higher MHD levels (as a quantitative finding), are more likely to endure postoperative recurrence.
Moreover, qualitative results show that bilateral CSDHs are often found in atrophic brains. Bilateral CSDHs are highly associated with impaired brain re-expansion following hematoma evacuation. 22 Bilateral CSDHs have been quantitatively proven to have larger residual hematoma volumes, greater BRR, brain shifting, and subdural space than the unilateral one. 33,34 Therefore, we can infer the following: more degree of brain shifting or the shifting in more patent subdural space will incur more risk of damage to the subdural drainage veins and eventually cause an increase in postoperative recurrence in bilateral CSDHs.
A Brief Outline to Artificial Intelligence Technology and Its Application in Medicine
Accumulating literature have shown that artificial intelligence (AI) technology helps clinicians in early detection, reducing diagnostic time, and predicting disease outcomes. 37 -40 If AI technique can conduct qualitative or quantitative analyses of the brain, we believe that it undoubtedly improves medical accuracy and quality. This would be definitely a historical leap forward in medical achievements.
The following is a brief introduction to AI techniques and an overview of AI technology in medical progress. In general, AI techniques can be divided into 3 categories: machine learning (ML), deep learning (DL), and natural language processing (NLP) methods. Among the 3 categories, ML is a classic mode 41 ; DL is a novel technology developed by ML models. 42 Both ML and DL technologies conduct structured data, for example, images. The NLP technology handles unstructured messages for a wider range of applications, for example, information from medical journals. 43
Information, for example, baseline data and disease outcomes, can be fed into ML algorithms for analyses. The ML algorithms are likely trained to interpret images, render diagnoses, and possibly predict outcomes. 39 The 2 popular modes of ML technologies are the support vector machine (SVM) and the artificial neural network (ANN). The SVM can be effective in accurately assigning objects to the appropriate categories. The ML technology is widely used in clinical image analyses and accurate classification of diagnoses. 39 For example, SVM has been used to identify image biomarkers of neurological diseases and in the diagnosis of cancer. 37 The ANN design simulates the brain neural networks. The ANN algorithms include inputs (patients’ traits), outputs (outcomes), and layers between inputs and outputs (the so-called hidden layers). The ANN algorithms can handle complex data because of the detailed computing network. The ANN has been used to predict breast cancer and to diagnose Parkinson disease according to the inputs of symptoms, images, and outcomes. 37
The DL network consists of more hidden layers, which makes DL technologies competent to deal with complicated database. Convolution neural network (CNN) is a recently developed mode in DL technology. Convolution neural network has been shown to detect diabetic retinopathy through retinal photographs 37,44 and cerebral microbleeding by MR images. 45
The NLP algorithms can process information in the form of narrative text, for example, operative notes, which is incomprehensible to ML and DL techniques. Furthermore, NLP program can convert texts (unstructured data) to structured data, which can be further analyzed by ML and DL techniques. 37 The analysis of unstructured and structured information enables AI function to be more complete. The NLP technology has been shown to extract keywords for peripheral arterial disease from clinical notes. Patients with peripheral arterial disease were selected from keywords, and accuracy above 90% was finally achieved. 46
Current Application of AI in Brain Lesions and Potential Link Between AI and CSDHs
In the previous sections of this article, we discussed the use of qualitative imaging research methods to estimate the postoperative recurrence in CSDHs, which can be modified and advanced further with computer-assisted quantitative methods of CT imaging to assess the recurrence more clearly and accurately. We believe that the progress of neuroscience in future can be further developed by combining quantitative evaluation methods with AI technology to expedite the diagnostic processes and provide more reliable disease prediction strategies.
Below, we address some of the current AI techniques in brain lesions and propose potential link between AI and CSDHs in the 3 main aspects: early disease detection, AI-based quantitative analysis, and prognosis prediction.
The detection and diagnosis of CSDHs is mainly qualitative in current clinical practice. Clinical pitfalls exist for early detection of CSDHs. Patients with homogenous isodense CSDHs tend to be underdiagnosed due to difficulties in distinguishing the contours of the hematomas from the brain parenchyma using CT scans. The AI technology greatly assists early disease detection by reading neuroimages and making possible abnormalities. For example, Havaei et al applied CNN for segmentation of brain tumors and expedite the final diagnosis. 47 For the diagnosis of CSDHs, DL-related algorithms can learn to exploit image characteristics by using large data sets manually labeled images to DL neural networks.
Currently, AI-based quantitative analysis can be conducted by developing rule-based algorithms, which are able to delineate automatically, measure, and finally quantify the proposed research interest in the brain. For example, Yepes-Calderon et al, reported SVM interpreting MRI data, by which the cerebral ventricles were segmented and the brain ventricular volume was accurately determined for the assessment of hydrocephalus. 48 Based on the effective results for lesion segmentation and volumetric analysis, AI-based methods are likely to be employed for parameter quantification, for example, the proposed MHD, BRR, hematoma volume, ADSS, and brain shifting, as mentioned in the previous sections.
As mentioned earlier, ML and DL algorithms analyze structured parameters, such as patients’ traits as well as disease outcomes. Using AI algorithms, brain images have been analyzed to predict disease outcomes. For example, ML methods have been applied to predict the severity of cognitive impairments after stroke based on lesions extracted on brain MRI. 49 Based on current application, in future, we believe that the described quantified parameters underlying recurrent CSDHs can be accurately linked to AI technologies to predict postoperative outcomes in patients with CSDH.
Conclusion
Chronic subdural hematomas are common in the elderly individuals. Postoperative high recurrence rate is worthy of medical research. Characteristics of CSDHs that are prone to postoperative recurrence in qualitative analysis, for example, high vascularity, prominent neomembrane, and prolonged patency of subdural space, can be presented using quantitative analysis in terms of MHD, BRR, hematoma volume, ADSS, and brain shifting, as outlined in the current review. We believe that in future, AI technology can combine the quantitative analysis techniques, as described in this article, to execute quantitative tasks and predict postoperative outcomes more quickly and efficiently for the management of CSDHs.
Footnotes
Declaration of Conflicting Interests
The author(s) declared no potential conflicts of interest with respect to the research, authorship, and/or publication of this article.
Funding
The author(s) disclosed receipt of the following financial support for the research, authorship, and/or publication of this article: The study was supported by a grant from the Taipei Tzu Chi Hospital, Buddhist Tzu Chi Medical Foundation (TCRD-TPE-109-38).