
Abstract
Objective:
This study evaluated the metabolic parameters and texture features of fluorodeoxyglucose positron emission tomography–computed tomography (PET/CT) for the diagnosis and differentiation of endometrial atypical hyperplasia (EAH), EAH with field cancerization (FC), and stage 1A endometrial carcinoma (EC 1a).
Materials and Methods:
We retrospectively analyzed the metabolic parameters of PET/CT in 170 patients with diagnoses confirmed by pathology, including 57 cases of EAH (57/170, 33.53%), 45 cases of FC (45/170, 26.47%), and 68 cases of EC 1a (68/170, 40.0%). Then, the texture features of each tumor were extracted and compared with the metabolic parameters and pathological results using nonparametric tests and linear regression analysis. The diagnostic performance was assessed by the area under the curve (AUC) values obtained from receiver operating characteristic analysis.
Results:
There were moderate positive correlations between the PET standardized uptake values (SUVpeak, SUVmax, and SUVmean) and postoperative pathological features with correlation coefficients (r s) of 0.663, 0.651, and 0.651, respectively (P < .001). Total lesion glycolysis showed relatively low correlation with pathological characteristics (r s = 0.476), whereas metabolic tumor volume and age showed the weakest correlations (r s = 0.186 and 0.232, respectively). To differentiate between the diagnosis of EAH and FC, SUVmax displayed the largest AUC of 0.857 (sensitivity, 82.2%; specificity, 84.2%). Five texture features were screened out as Percentile 40, Percentile 45, InverseDifferenceMoment_AllDirection_offset 1, InverseDifferenceMoment_angle 45_offset 4, and ClusterProminence_angle 135_offset 7 (P < .001) by linear model of texture analysis (AUC = 0.851; specificity = 0.692; sensitivity = 0.871). To differentiate between the diagnoses of FC and EC 1a, SUVpeak displayed the largest AUC of 0.715 (sensitivity, 67.6%; specificity, 77.8%), and 2 texture features were identified as Percentile 10 and CP_angle 135_offset 7 (AUC = 0.819; specificity = 0.871; sensitivity = 0.766; P < .001).
Conclusions:
SUVmax and SUVpeak had the highest diagnostic values for EAH, FC, and EC 1a compared with the other tested parameters. SUVmax, Percentile 40, Percentile 45, InverseDifferenceMoment_AllDirection_offset 1, InverseDifferenceMoment_angle 45_offset 4, and ClusterProminence_angle 135_offset 7 distinguished EAH from FC. SUVpeak, Percentile 10, and ClusterProminence_angle 135_offset 7 distinguished FC from EC 1a. This study showed that the addition of texture features provides valuable information for differentiating EAH, FC, and EC 1a diagnoses.
Keywords
Introduction
Endometrial atypical hyperplasia (EAH) is caused by continuous estrogen stimulation in the endometrium without progesterone antagonism, resulting in changes in endometrial cell morphology and clonal hyperplasia of endometrial glands and stroma. It is generally believed that EAH is a direct indication of precancerous lesion for type I endometrial carcinoma (EC), as type I EC accounts for the highest proportion (about 75%) of all ECs. 1 The progression from simple endometrial hyperplasia to complex atypical hyperplasia (CAH) and then to well-differentiated EC is a continuous and complicated pathological process of subclonal evolution rather than linear accumulation, in which atypical hyperplasia shows the highest risk of developing into or coexisting with EC. 2
Endometrial atypical hyperplasia is a common gynecological disease. The incidence of EAH is continually increasing, and the age of onset tends to be younger. It was reported that 15% to 46% of EAH cases can develop into EC, 3,4 and monitoring this progressive carcinogenesis depends on pathological diagnosis, which is challenging due to imaging and clinical features. A noninvasive, highly sensitive and specific imaging approach is urgently needed to accurately determine the extent of the lesion and functional and metabolic information, especially to avoid unnecessary hysterectomy in young, fertile women.
Positron emission tomography–computed tomography (PET/CT) is a functional and morphological imaging technology that detects and identifies cancerous lesions based on abnormally increased glucose metabolism in malignant tumors. The uptake of fluorodeoxyglucose (18F-FDG) in lesions provides a metabolic marker that is used to detect the lesion. 5 Magnetic resonance imaging (MRI) is considered as the best method for local staging of gynecological tumors. Recent studies showed that 18F-FDG PET/CT has high specificity and moderate sensitivity in the detection of gynecological tumors (eg, cervical cancer, ovarian cancer, EC) compared with MRI, especially in the staging of advanced cervical cancer and the rescue and treatment of recurrent gynecological tumors. 6,7 A recent study by Husby et al 8 of the diagnostic value of 18F-FDG PET/CT in preoperative staging of endometrial cancer showed that the standardized uptake values (SUV) SUVmax, SUVmean, and metabolic tumor volume (MTV) were significantly correlated with deep myometrial invasion, lymph node metastasis, and high histological grade of endometrium (P < .015), which confirmed that PET/CT was a valuable tool for preoperative evaluation of endometrial cancer. The most commonly used semiquantitative parameter of PET-maximum standard uptake value (SUVmax) is useful for diagnosing EAH and EC. 9 SUVmax represents the highest metabolic activity in the lesion, whereas MTV and total lesion glycolysis (TLG) reflect the overall metabolic activity in the lesion; MTV and TLG are more conducive to risk stratification for EC than SUVmax. 10 The peak standardized uptake value (SUVpeak) parameter represents the maximum value of the average SUV in a small spherical volume (10-mm diameter) and is more reliable and powerful than SUVmax and less subject to image noise. 11 However, SUV alone cannot completely reflect the complex information inside the lesion. For example, 18F-FDG uptake in some well-differentiated tumors is not obvious, whereas 18F-FDG uptake in some inflammatory tissue is observed. 12
Radiogenomics analysis extracts quantitative features from medical images and compares the results with genetic expression patterns, thereby providing noninvasive, comprehensive intratumoral and peritumoral information, and has become an important area of medical image research. 13 Textural analysis is a new tool for evaluating tumor heterogeneity using medical images. Briefly, this tool analyzes the distribution patterns of image gray levels. Textural analysis can generate quantitative parameters based on computer-aided postprocessing technology, which is standardized and repeatable. Studies have shown that tumor heterogeneity parameters extracted from 18F-FDG PET/CT images effectively reflect the tumor tissue characteristics and are highly correlated with the stage of cervical cancer. 14 Magnetic resonance imaging–derived tumor texture parameters independently predicted deep myometrial invasion, high-risk histological subtype, and reduced survival in EC. 15
To our knowledge, there are no published studies investigating texture features in lesions using PET/CT images to differentiate endometrial precancerous lesions from early-stage cancer. The aim of this study was to identify associations between SUV-related parameters, texture features, and pathological types with EAH, EAH with field cancerization (FC), and stage 1A endometrial carcinoma (EC 1a).
Materials and Methods
Patients
This retrospective study was approved by the hospital review committee and informed consent was obtained. We analyzed imaging data from 246 patients with suspected EC by clinical or endometrial biopsy from January 2014 to June 2018. The patients underwent 18F-FDG PET/CT scans within 2 weeks before surgery, and the lesion samples were pathologically confirmed as EAH, FC, or EC 1a (well-differentiated cancers enrolled). Positron emission tomography-CT images and clinical data were collected and compared with pathological findings. No radiotherapy, chemotherapy, or targeted drugs were given before imaging examination. The following cases were excluded from the study: 18 cases were excluded for negative 18F-FDG uptake, 32 cases of MTV ≤10 mm3 were excluded (heterogeneity could not be extracted in a small volume due to the limited spatial resolution of PET), 16 and 26 cases were excluded for secretory endometrium to avoid interference. The final number of cases included into our study was 170.
Fluorodeoxyglucose PET/CT Acquisition and Texture Extraction
Fluorodeoxyglucose was obtained from GE minitrace II, Tracelab FDG preparation (GE Healthcare, Milwaukee, Wisconsin) with a purity >99%. Before 18F-FDG injection, patients were required to maintain fasting state for 4 to 6 hour to achieve a plasma glucose <7 mmol/L. Whole-body PET/CT scans ranging from cranium to middle part of femur were performed on a hybrid PET/CT scanner (GE Discovery PET/CT Elite, GE Healthcare) 1 hour after the intravenous injection of 18F-FDG (0.08-0.15 μCi/kg). Positron emission tomography scans were conducted in 3-dimensional mode, matrix of 192 × 192, 2 min/bed. Low-dose spiral CT scans were performed with 120 to 140 kV, 80 mA. Positron emission tomography images were obtained after CT attenuation correction and reconstructed using time-of-flight and point-spread-function algorithms with 2 iterations and 24 subsets.
Positron emission tomography-CT images were postprocessed on an Advantage Workstation 4.6 equipped with PET Volume Computed Assisted Reading software (PET VCAR, GE Healthcare). Two nuclear physicians with more than 10 years of experience who were blinded to clinical and pathological information independently evaluated and measured the images. Disagreements were resolved by consensus through negotiation. The SUVpeak, SUVmax, SUVmean, MTV, and TLG parameters were obtained for each endometrial lesion using the PET VCAR software, and the thresholds of delineating tumor edge and regions of interest (ROI) were determined automatically by iterative adaptive algorithm 17 (Figure 1). The physiological absorption regions (eg, intestinal canal, ureter, blood vessel) were not imaged. SUVmax ≥2.5 is considered as a positive threshold. 18

Endometrial atypical hyperplasia in a 37-year-old patient. Axial CT image (A), PET image (B), PET/CT fusion image (C), and coronal PET image (D) showing high uptake of 18F-FDG in the lesion in the uterine cavity. The ROI (green line) was automatically obtained by PET VCAR software, with SUVpeak = 5.80 (g/mL), SUVmax = 5.84 (g/mL), SUVmean = 3.43 (g/mL), MTV = 5.78 (cm3), and TLG = 19.825 (g/mL·cm3). In the PET/CT image (E), the red line represents artificial boundaries of the VOI for tumor delineation, with Percentile 10 (65.054), Percentile 40 (92.897), Percentile 45 (101.859), InverseDifferenceMoment_AllDirection_offset 1 (0.0464099), InverseDifferenceMoment_angle 45_offset 4 (0.0103657), and ClusterProminence_angle 135_offset 7 (122319000). CT indicates computed tomography; 18F-FDG, fluorodeoxyglucose; MTV, metabolic tumor volume; PET, positron emission tomography; ROI, region of interest; SUV, standardized uptake value; TLG, total lesion glycolysis; VOI, volume of interest.
Texture analysis was performed using Artificial Intelligent Kit software (A.K. 2017, GE Healthcare), which automatically generates various texture parameters according to the selected volume of interest. In this study, 254 texture features were extracted for analysis, including first and higher order. 19 First-order features were based on gray-level frequency distribution from histogram analysis, including minimum, maximum intensity, skewness, percentile x, and quantile y. Higher order features were measured by using gray-level co-occurrence matrix (GLCM), gray-level run-length matrix, and gray-level size zone matrix (Table 1). Linear regression modeling (lasso) was performed through data preprocessing, data classification (Train_set, Test_set), feature dimension reduction (statistical difference test between groups, remove redundancy), modeling establishment (screening for features that rank high in importance), and model verification (Test_set).
Main Texture Features.

α represents direction which could be angle 0, 45, 90 and 135; σ represents offset which could be 1 4 and 7.
Statistical Analysis
All statistical analyses were performed using SPSS statistical software (version 23.0, IBM). Mean, standard deviation, median, and interquartile [M(P25, P75)] were calculated for each group. First, the normal distribution of each group was tested, and Mann-Whitney U test and Kruskal-Wallis test were used to test for non-normal distribution data. Then, we compared statistical differences in parameters among and between groups with a Dunn-Bonferroni test for post hoc comparisons. To examine the diagnostic performance of each parameter in discriminating between groups, receiver operating characteristic analysis was conducted to obtain Youden index and optimal diagnostic threshold. The correlation between each group and different parameters was analyzed by linear regression and evaluated by Spearman rank correlation coefficient (r s). A value of P <.05 was considered statistically significant.
Results
A total of 170 eligible patients met the inclusion criteria, with an age ranging from 22 to 88 years and a median age of 54 years. The mean and standard deviation (
SUV-Related Parameters of Different Pathological Types of Endometrial Precancerous Lesions and Early-Stage Carcinoma.a

Abbreviations: EAH, endometrial atypical hyperplasia; EC 1a, stage 1A endometrial carcinoma; FC, field cancerization; MTV, metabolic tumor volume; SUV, standardized uptake value; TLG, total lesion glycolysis.
aData presented as means (standard deviations) and median (interquartile).
b P value for comparison among 3 classifications (Kruskal-Wallis test).
c P value for comparison between EAH and FC.
d P value for comparison between FC and EC 1a (Mann-Whitney U test).

Box diagrams between PET/CT metabolic parameters and pathological types (A-F). The values of SUVpeak, SUVmax, and SUVmean increased with increasing severity of atypical endometrial hyperplasia, whereas the correlation between TLG and postoperative pathology was lower. MTV and age significantly fluctuated throughout the experiment, whereas MTV had more discrete and extreme values. All parameters overlapped at least partly, which made it challenging to distinguish a small number of endometrial lesions. CT indicates computed tomography; MTV, metabolic tumor volume; PET, positron emission tomography; SUV, standardized uptake value; TLG, total lesion glycolysis.
The Spearman rank correlation analysis indicated that SUVpeak, SUVmax, and SUVmean had moderate positive correlation with postoperative pathological features, with correlation coefficients (r s) of 0.663, 0.651, and 0.651 (P < .001), respectively; TLG showed a lower correlation (r s = 0.476), whereas MTV and age showed the weakest correlations (r s = 0.186 and 0.232, respectively; Table 3).
Correlation Between SUV-Related Parameters and Endometrial Pathology.

Abbreviations: MTV, metabolic tumor volume; SUV, standardized uptake value; TLG, total lesion glycolysis.
Diagnostic Performance of SUVs and Texture Parameters for EAH and FC
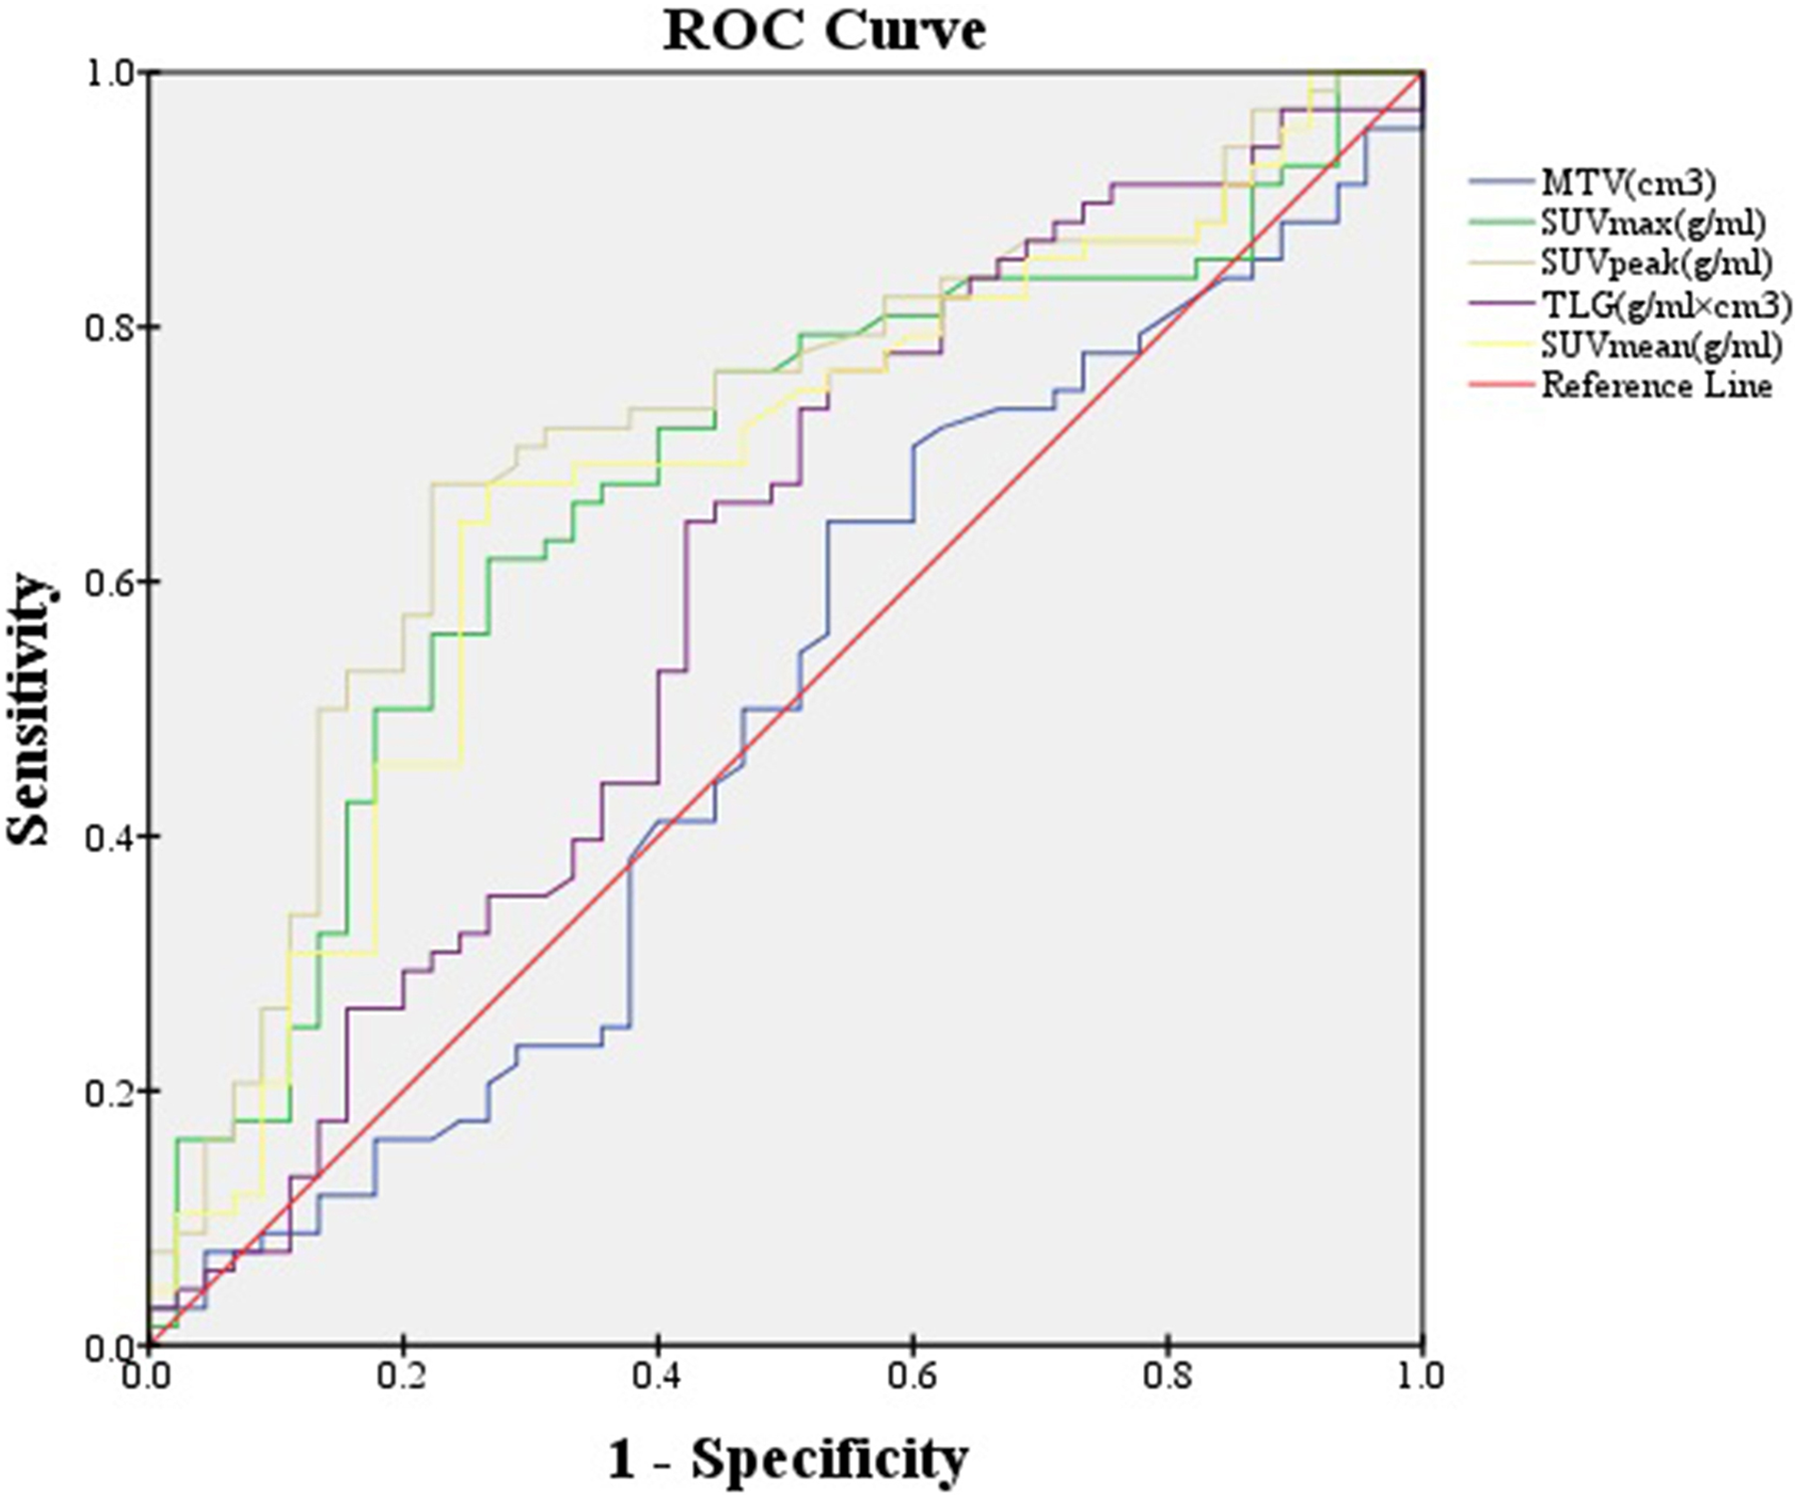
The efficiencies of SUV and texture parameters for differentiating between EAH and FC were evaluated. SUVmax showed the largest area under the curve (AUC = 0.857, 95% confidence interval [CI]: 0.781-0.934, P < .001), with a Youden index of 0.664, optimal diagnostic threshold of 8.555, sensitivity of 82.2%, specificity of 84.2%, false-negative rate of 17.8%, and false-positive rate of 15.8%. The AUCs of SUVmax, SUVmean (AUC = 0.836, 95% CI: 0.756-0.917, cutoff threshold = 4.74, sensitivity = 80%, specificity = 77.2%, false-negative rate = 20%, false-positive rate = 22.8%), and SUVpeak (AUC = 0.848, 95% CI: 0.772-0.924, cutoff threshold = 5.845, sensitivity = 82.2%, specificity = 80.7%, false-negative rate = 17.8%, false-positive rate = 19.3%) were all significantly higher than the AUCs of MTV (AUC = 0.619, 95% CI: 0.508-0.731, cutoff threshold = 8.67, sensitivity = 37.8%, specificity = 91.2%, false-negative rate = 62.2%, false-positive rate = 8.8%) and TLG (AUC = 0.729, 95% CI: 0.632-0.826, cutoff threshold = 34.86, sensitivity = 46.7%, specificity = 89.5%, false-negative rate = 53.3%, false-positive rate = 10.5%; P < .001; Figure 3). There were no significant differences among SUVmax, SUVmean, and SUVpeak (P > .05).

SUVmax had the best diagnostic efficiency for differentiating between EAH and FC (AUC = 0.857). The prediction ability of SUVmax, SUVpeak (AUC = 0.848), and SUVmean (AUC = 0.836) were better than MTV (AUC = 0.619) or TLG (AUC = 0.729; P < .05). AUC indicates area under the curve; EAH, endometrial atypical hyperplasia; FC, field cancerization; MTV, metabolic tumor volume; SUV, standardized uptake value; TLG, total lesion glycolysis.
A linear model was established to differentiate EAH from FC, and the following 5 texture features were selected for their significance: Percentile 40, Percentile 45, InverseDifferenceMoment_AllDirection_offset 1, InverseDifferenceMoment_angle 45_offset 4, and ClusterProminence_angle 135_offset 7 (P < .001, AUC = 0.851, specificity = 0.692, sensitivity = 0.871 in training data set; Figure 4).

Predictive performance of the 5 texture features selected for diagnosis of EAH and FC as determined by ROC analysis. In the train set, AUC = 0.851, threshold = 0.391, specificity = 0.692, and sensitivity = 0.871. In the test set, AUC = 0.778, threshold = 0.391, specificity = 0.722, and sensitivity = 0.643 (P < .001). AUC indicates area under the curve; EAH, endometrial atypical hyperplasia; FC, field cancerization; ROC, receiver operating characteristic.
Diagnostic Performance of SUVs and Texture Parameters for FC and EC 1a
The efficiencies of SUV and texture parameters for differentiating between FC and EC 1a were evaluated. SUVpeak showed the largest area under the curve (0.715, 95% CI: 0.618-0.812, P < .001), with Youden index = 0.454, cutoff threshold = 9.525, sensitivity = 67.6%, specificity = 77.8%, false-negative rate = 32.4%, and false-positive rate = 22.2%. The AUCs of SUVmax (AUC = 0.677, 95% CI: 0.575-0.778, cutoff threshold = 13.335, sensitivity = 67.6%, specificity = 73.3%, false-negative rate = 32.4%, false-positive rate = 26.7%), SUVmean (AUC = 0.674, 95% CI: 0.572-0.777, cutoff threshold = 7.68, sensitivity = 61.8%, specificity = 73.3%, false-negative rate = 38.2%, and false-positive rate = 26.7%), and SUVpeak were all significantly higher than those of MTV (AUC = 0.495, 95% CI: 0.384-0.607, cutoff threshold = 4.5, sensitivity = 64.78%, specificity = 46.7%, false-negative rate = 35.22%, and false-positive rate = 53.3%) and TLG (AUC = 0.598, 95% CI: 0.488-0.708, cutoff threshold = 25.365, sensitivity = 76.5%, specificity = 46.7%, false-negative rate = 23.5%, and false-positive rate = 53.3%; P < .001; Figure 5). There were no significant differences among SUVmax, SUVmean, and SUVpeak (P > .05).
SUVpeak had the best diagnostic efficiency for differentiating between FC and EC 1a (AUC = 0.715), and prediction ability of SUVpeak, SUVmax (AUC = 0.677), and SUVmean (AUC = 0.674) were better than MTV (AUC = 0.495) or TLG (AUC = 0.598; P < .05). AUC indicates area under the curve; EC 1a, stage 1A endometrial carcinoma; FC, field cancerization; MTV, metabolic tumor volume; SUV, standardized uptake value; TLG, total lesion glycolysis.
Linear models identified 2 texture features that differentiated between FC and EC 1a, Percentile 10 and ClusterProminence_angle 135_offset 7 (AUC = 0.819, specificity = 0.871, sensitivity = 0.766 in the training data set, P < .001; Figure 6).

Predictive performance of the 2 texture features selected for diagnosis of FC and EC 1a as determined by ROC analysis. In the train set, AUC = 0.819, threshold = 0.640, specificity = 0.871, and sensitivity = 0.766. In the test set, AUC = 0.721, threshold = 0.640, specificity = 0.714, and sensitivity = 0.667 (P < .001). AUC indicates area under the curve; EC 1a, stage 1A endometrial carcinoma; FC, field cancerization; ROC, receiver operating characteristic.
Discussion
Accurate preoperative evaluation of both benign and malignant endometrial lesions is crucial for the development of personalized treatment programs, the reduction of treatment cost, and the assessment of patient prognosis. Preoperative diagnosis and staging of EC often uses 18F-FDG PET/CT imaging, 20 but little research has been done on differentiating between precancerous lesions and early-stage cancer. 9,20,21 Although the SUV-related metabolic indices of PET are easy to obtain, the statistical method is based on Poisson distribution, which may affect measurement accuracy. Our experimental results revealed that there was a partial overlap of SUV-related parameters in precancerous lesions and early-stage cancer, some of which were difficult to discriminate between. The FDG distribution detected in vivo indicates that molecular-level imaging of tumors can be achieved through PET/CT analysis. The FDG distribution is related to the increase in cell metabolism, tissue composition heterogeneity, cell density, cell proliferation, cell necrosis, cell invasion, and microvessel density. 22 All of these factors can be reflected in the difference in pixel gray distribution in PET images, which is due to the tumor image heterogeneity.
Many textural features can be applied to describe the heterogeneity of the tumor interior. 23 Currently, some studies have used MRI to analyze the texture of EC, 15,24 but the use of PET/CT for this analysis is still in the early stage of research. 25 In this study, we added texture features to improve the diagnosis and differentiation of endometrial lesions.
The most commonly used metabolic parameter of PET is SUVmax, which represents the maximum SUV value of a single voxel within the target volume. SUVmax is easy to analyze and has good repeatability but is sensitive to noise. Studies have shown that SUVmax changes with reduced scanning time and can lead to overestimation of an increase in sphere size. 26 SUVmean represents the mean SUV value in each voxel of the target volume; it is insensitive to noise but sensitive to ROI delineation. SUVmean may decrease under the influence of partial volume effect. Compared with the former 2 SUVs, SUVpeak represents the maximum value of SUV average in a small area (10 mm3 spherical volume), incorporating the advantages of SUVmax and SUVmean, and is more powerful and accurate than SUVmax and SUVmean. SUVpeak can improve the accuracy and repeatability of measurements. 11 A high SUVpeak in early-stage cervical cancer can reflect more aggressive lesions, can help predict prognosis, 27 and is a prognostic parameter of poor survival outcomes in patients with oral cancer. 28
Berg et al 9 showed that SUVmax and SUVmean were significantly lower in patients with CAH compared to those with grade 1 endometrial carcinoma (EECG1; P < .01), with AUCs of 0.87 and 0.97, respectively. By contrast, MTV did not significantly differ between CAH and EECG1 (P = .1). Antonsen et al 20 compared preoperative SUVmax with histological prognostic factors in 268 patients with atypical hyperplasia and EC and reported that preoperative PET/CT and SUVmax measurements could provide additional clinical and prognostic information on the classification and invasiveness of endometrial cancer.
We also found that SUVpeak, SUVmax, and SUVmean were more significantly correlated with different pathological characteristics of endometrial cancer than either MTV or TLG (P < .001), and they had higher diagnostic values for endometrial lesions. SUVmax was the most useful indicator to distinguish EAH from FC, with AUC = 0.857, high sensitivity, and low misdiagnosis rate. SUVpeak was the best parameter to distinguish FC from EC 1a, with AUC = 0.715, high sensitivity, and low misdiagnosis rate. Previously, Kitajima et al and Shim et al 10,29 reported that MTV and TLG were better correlated with pathological features of endometrial lesions and were more useful than SUVmax in differentiating between high-risk and low-risk endometrial cancer, which could be independent factors of predicting recurrence. By contrast, our study found a weak correlation between TLG and endometrial clinicopathology (r s = 0.476) and a weaker ability to differentiate FC from EC 1a. Metabolic tumor volume displayed significant fluctuations throughout our experiments, and there were many discrete and extreme values. There was no significant correlation between MTV and pathological results (r s = 0.184), and the diagnostic value of MTV was the lowest among EAH, EC, and EC 1a. This may be due to differences in MTV measurement methods. We used an iterative adaptive algorithm provided by PET VCAR software that automatically delineated ROIs and generated measurement results, greatly reducing errors of manually delineated ROIs. 17 Nevertheless, we found it interesting that MTV and TLG had higher specificity and lower false positivity than other parameters in identifying EAH and EC.
We performed linear regression modeling (lasso) of texture classification to analyze the discriminant ability of texture features extracted from samples. This model has been widely used to evaluate differential diagnosis of margin and core heterogeneity between malignant and inflammatory pulmonary nodules. 30 We investigated the heterogeneity of FDG imaging to differentiate endometrial lesions and found that Percentile 40, Percentile 45, InverseDifferenceMoment_AllDirection_offset 1, InverseDifferenceMoment_angle 45_offset 4, and ClusterProminence_angle 135_offset 7 efficiently contributed to the identification of EAH and FC (AUC = 0.851), which was similar to the diagnostic efficiency of SUVmax (AUC = 0.857). To distinguish between FC and EC 1a, the diagnostic values of Percentile 10 and ClusterProminence_angle 135_offset 7 were higher than SUVpeak (AUC = 0.819 and 0.715, respectively), and they had high sensitivity values. Therefore, the synergism between PET/CT metabolic parameters and individual texture features is helpful to differentiate endometrial precancerous lesions from early-stage cancer. Inverse difference moment (IDM) and cluster prominence (CP) both belong to the GLCM, which was first proposed by Haralick et al. 31 The gray-level space dependence matrix enabled the calculation of 28 texture features. Gray-level co-occurrence matric represents the joint probability of certain sets of pixels having certain gray-level values. The advantage of the co-occurrence matrix calculations is that the co-occurring pairs of pixels can be spatially related in various orientations with reference to distance and angular spatial relationships, which enables analysis of the relationship between 2 pixels at a time. As a result, the combination of gray levels and their positions is exhibited. However, the matrix is sensitive to rotation, and changing different offsets defines the directional relationships between pixels. The rotation angle (0°, 45°, 90°, 135°) of an offset (1, 4, 7) and the displacement vectors (distance to the neighbor pixels of 1, 2, 3) differentiate co-occurrence distributions from the same reference image. This is the basis of the texture feature calculation.
Co-occurrence matrices of 0°, 45°, 90°, and 135° are calculated in 4 directions. The texture features are calculated on basis of GLCM, which is represented by characteristic quantities such as IDM, energy, entropy, correlation, and cluster prominence. Recent studies indicated that homogeneity, energy, and correlation were higher in patients with dilated cardiomyopathy than in healthy controls in terms of GLCM features, and the diagnostic accuracy using GLCM features was 0.85 ( 0.07). 32
Inverse difference moment also reflects the homogeneity of image texture and measures local variation. Large IDM value indicates that there is a lack of variation among different regions of the image texture, and the texture is uniform in the local distribution. Inverse difference moment weight value is the inverse of the contrast weight. If GLCM had larger values of diagonal elements, IDM values would increase. Therefore, the continuous grayscale image will have a larger IDM value. 33,34 Shen et al 35 reported that PET-derived GLCM homogeneity was the only independent predictor of pelvic lymph node metastasis in patients with cervical cancer, and pelvic lymph node metastasis risk could be determined by combining SUV values. Yu et al 36 reported that homogeneity of GLCM features not only enabled significant risk stratification (log-rank P < .0001) in stage I non–small cell lung cancer but also remained an independent predictor of overall survival after adjusting for age, tumor volume, and histological type.
Cluster prominence is a measure of asymmetry of a given distribution. High CP values indicate that the image symmetry is low. In medical imaging, low CP values represent a smaller peak for the image gray-level value, and usually the gray-level difference between the forms is small. In this study, CP described the heterogeneity of tumor subregions, which were significantly associated with gene modules for fat metabolism and complement activity and with overall survival (Cox P = .021, hazard ratio = 0.17). 37 A previous study also reported that CP of GLCM derived from PET images may help to decipher breast cancer phenotypes and may serve as imaging biomarkers for predicting recurrence-free survival of breast cancer. 38 The percentile parameter is a histogram measure used in statistics to indicate the value below which a given percentage of observations in a group of observations fall. AK software can compute 19 Percentile parameters (Percentile 5, 10, 40, 45,…, 95).
This study has some limitations. Retrospective studies can have selection bias. Our current sample size is small, although we expect larger sample size in a future prospective study. The mechanism and principle underlying the low false-positive rate of MTV and TLG in differentiating EAH from EC need further investigation. The extraction of texture features from PET/CT images is a new method with many challenges. Greater standardization and rigorous guidelines are urgently needed to promote the development of this field of research. 25
Conclusions
SUVmax and SUVpeak were significantly correlated with EAH, FC, and EC 1a and had higher diagnostic efficacy than MTV and TLG. SUVmax, Percentile 40, Percentile 45, InverseDifferenceMoment_AllDirection_offset 1, InverseDifferenceMoment_angle 45_offset 4, and ClusterProminence_angle 135_offset 7 efficiently differentiated EAH from FC. SUVpeak, Percentile 10, and ClusterProminence_angle 135_offset 7 efficiently differentiated FC from EC 1a. The addition of texture features can provide valuable information for differential diagnoses of endometrial precancerous lesion and early-stage carcinoma.
Footnotes
Authors’ Note
All procedures performed in studies involving human participants were in accordance with the ethical standards and Helsinki Declaration.
Declaration of Conflicting Interests
The author(s) declared no potential conflicts of interest with respect to the research, authorship, and/or publication of this article.
Funding
The author(s) received no financial support for the research, authorship, and/or publication of this article.