
Abstract
The combination of different modality images can provide detailed and comprehensive information for the prognostic assessment and therapeutic strategy of patients with ischemic heart disease. In this study, a 3D fusion framework is designed to integrate coronary computed tomography (CT) angiography (CTA), 2-deoxy-2-[18F]fluoro-D-glucose ([18F]DG) positron emission tomography (PET)/CT, and [68Ga]-1,4,7-triazacyclononane-1,4,7-triacetic acid-(Arg-Gly-Asp)2 ([68Ga]-NOTA-PRGD2) PET/CT images of the myocardial infarction model in minipigs. First, the structural anatomy of the heart in coronary CTA and CT is segmented using a multi-atlas-based method. Then, the hearts are registered using the B-spline-based free form deformation. Finally, the [18F]DG and [68Ga]-NOTA-PRGD2 signals are mapped into the heart in coronary CTA, which produces a single fusion image to delineate both the cardiac structural anatomy and the functional information of myocardial viability and angiogenesis. Heart segmentation demonstrates high accuracy with good agreement between manual delineation and automatic segmentation. The fusion result intuitively reflects the extent of the [18F]DG uptake defect as well as the location where the [68Ga]-NOTA-PRGD2 signal appears. The fusion result verified the occurrence of angiogenesis based on the in vivo noninvasive molecular imaging approach. The presented framework is helpful in facilitating the study of the relationship between infarct territories and blocked coronary arteries as well as angiogenesis.
Introduction
Ischemic heart disease (IHD) is the single largest cause of death in the world. In 2012, there were 7.4 million deaths from IHD, accounting for 13.2% of all global deaths. Moreover, a rising trend in IHD mortality can be revealed in comparison to data from 2000 to 2012. 1 According to the authors, 2 –4 therapeutic angiogenesis may become the next major advance in the treatment of IHD. It is essential to evaluate disease progression and monitor treatment efficacy in the course of treatment.
Noninvasive imaging is an emerging tool for the characterization of angiogenesis as well as a fundamental tool in clinical and investigative cardiology. 5 –7 Multimodality medical images often provide meaningful complementary information with increased clinical relevance. Angiogenesis is considered an important part of the healing process and is vital for myocardial repair after myocardial infarction. Continued observation of angiogenesis can assist risk stratification and improvement in new therapies targeting angiogenic response stimulation/increase. αvβ3 integrin has been found to be highly expressed by endothelial cells during angiogenesis, and [68Ga]-1,4,7-triazacyclononane-1,4,7-triacetic acid-(Arg-Gly-Asp)2 ([68Ga]-NOTA-PRGD2) has been proved to be an angiogenesis positron emission tomography (PET) ligand targeted toward αvβ3 integrin. 8 –10 It has been proved that the location of myocardial infarction (MI) relates to the sites of the coronary artery, 11 while initiation of angiogenesis relates to the infarcted area. 12 So in vivo infarction and angiogenesis analysis needs 3 kinds of information: coronary artery, which can be obtained from coronary computed tomography (CT) angiography (coronary CTA) image; myocardial viability, obtained from 2-deoxy-2-[18F]fluoro-D-glucose ([18F]DG) PET; and vascular angiogenesis, obtained from [68Ga]-NOTA-PRGD2 PET. Thus, in this article, coronary CTA and 2 separate PET/CT scans were conducted for each participant.
At present, physicians typically view coronary CTA and PET/CT data in a 2-dimensional (2D) series. For PET, the assessment of the extent and severity of perfusion defects can be enhanced by generation of a polar plot (or “bull’s-eye”) images. 13 However, interpretation of the polar plot still needs a great deal of experience and dedicated studies. Therefore, the assessment of cardiac PET/CTA images requires either readers with expertise in both coronary CTA imaging and cardiac PET or a team of specialists (radiology and nuclear medicine). 14 To achieve an intuitive assignment of a blocked artery section corresponding to myocardial ischemic regions and where neovascularization appears, a multimodality fusion framework that merges PET and coronary CTA data into a single 3-dimensional (3D) image is urgently needed.
Integrating cardiac PET data into the context of a coronary CTA imaging examination (or vice versa) presents challenges for the clinical workflow. To the best of our knowledge, only a few studies have been published so far addressing coronary CTA-PET image fusion. Fricke et al aligned myocardial perfusion PET/CT with coronary CTA of a human manually without doing heart segmentation. 15 In general, handicraft techniques are somewhat impractical to apply on a patient-to-patient basis because of intensive labor and hard-to-reproduce results.
The main difficulty in automatic coronary CTA-PET fusion lies in the absence of anatomic context of the PET image. The multimodality PET/CT scanner accomplishes sequential functional and anatomic imaging as well as their coregistration. Thus, the fusion of coronary CTA-PET can be achieved by using the CT image as deformation field media. However, the difference in spatial resolution and contrast between coronary CTA and CT hinders the most available intensity-based image registration methods from being applied directly.
In this article, a novel coronary CTA-PET fusion framework is proposed for a multimodality cardiac image analysis. Both the anatomic contexts of coronary CTA and CT images are extracted by multi-atlas segmentation. Multi-atlas segmentation is an effective approach for automatically extracting the region of interest in biomedical images. A set of a priori segmented example images, that is, atlases, are aligned to a target image. Then, all of the deformed label images are integrated using label fusion. The purpose of heart segmentation is to extract the heart anatomy, within the context of which only the myocardial viability and angiogenesis information are visualized without showing the distracting signal from the other organs and tissues. Then, CT is aligned to coronary CTA in the atlas domain. The deformation fields produced in this procedure are applied to the PET image to map it into coronary CTA.
For clarification purposes, we used PET FDG and CT FDG to denote the PET and CT components of [18F]DG PET/CT images, respectively. Similarly, PET RGD and CT RGD were used to denote the PET and CT components of [68Ga]-NOTA-PRGD2 PET/CT images, respectively. If not otherwise specified, CT PET is referred to as CT RGD or CT FDG hereafter.
Materials and Methods
Animal Model
The MI model used in this article was developed in Guangxi Bama miniature pigs, weighing 25 to 30 kg, where MI was induced by temporary balloon occlusion of the distal left anterior descending coronary artery below the second diagonal branch for 60 minutes, followed by reperfusion with an inflated angioplasty balloon. A total of 30 female subjects were recruited in this study, including 1 control group (females were only used in the study to reduce the within-group variability considering the small amount of subjects). The details of the model creation can be found in reference. 16
Data Acquisition
The whole-body [18F]DG PET/CT and [68Ga]-NOTA-PRGD2 PET/CT were acquired on a Biograph 40 PET/CT scanner (Siemens Medical Solutions), whose PET system consisted of a multi-LSO-detector ring system with 3D acquisition and reconstruction. The spatial slice resolution in both transaxial and axial directions was less than 5 mm with slice spacing of 2 mm. The CT system consists of a 40-slice CT; the rotational speed of the gantry is 162 rpm with a rotation time of 370 milliseconds resulting in 40 images per rotation below the 0.6 mm isotropic resolution. The CT images were reconstructed onto a 512 × 512 matrix. The PET images were reconstructed onto a 168 × 168 matrix. The slice thickness of CT images and PET images is 5 mm.
For CTA scans, the minipigs were placed in the right lateral decubitus position and sedated with propofol under electrocardiographic monitoring. Nitroglycerin was used sublingually, and heart rate was controlled to acquire high-quality images. Retrospective electrocardiogram (ECG)-triggered images were obtained, and the ECG pulsing window was 20% to 70% of the RR interval for all minipigs. Coronary enhancement was achieved by intravenous injection of 60 mL of contrast agent (Iohexol, Italy) followed by a saline bolus flush. Bolus timing was performed automatically with a region of interest set in the descending aorta with a threshold of 100 Hounsfield units. Coronary CTA images were acquired with a dual source 128-slice CT system (Somatom Definition Flash, Siemens Healthcare, Germany) with a collimation of 128 × 0.6 mm and with a total z-axis coverage of 40 mm. The gantry has a rotation time of 0.28 seconds and maximum scan speed can be 458 mm/s. Tube settings were 100 kV and 320 mA using ECG modulation, and the pitch was 3.4. Reconstruction of raw CTA data was performed using the following parameters: 0.6- to 0.75-mm slice thickness, 250-mm field of view, and 512 × 512 matrix.
Our previous study suggests that angiogenesis begins in the infarcted myocardium at 7 days and is attenuated after 3 months. 10,17 Thus, all of the images were acquired within 3 months after MI was introduced. The sample images of PET/CT and coronary CTA in a minipig model of MI are shown in Figure 1.

Multimodality imaging in a minipig model of myocardial infarction (MI). (A) Coronary computed tomography (CT) angiography (CTA) imaging. (B) [18F]fluoro-D-glucose ([18F]DG) positron emission tomography (PET) imaging. (c) [68 Ga]-1,4,7-triazacyclononane-1,4,7-triacetic acid-(Arg-Gly-Asp)2 ([68 Ga]-NOTA-PRGD2) PET/CT imaging.
After image acquisition, the heart was sectioned perpendicular to the long axis and divided into 9 slices about 1.5-cm thick. The slices were incubated with 2% 2,3,5-triphenyltetrazolium chloride (TTC) for 60 minutes at 37°C to stain the viable myocardium. Each slice was photographed with a digital camera. The infarct position and size were visibly evaluated as a gold standard measure of the infarcted myocardium.
All operations during animal experiments were in accordance with the National Institutes of Health Guide for the Care and Use of Laboratory Animals. All experiments were performed in accordance with the 1964 Helsinki Declaration. The experimental protocol was reviewed and approved by the Committee on Animal Care, Fourth Military Medical University, China.
Framework of Multimodality Image Fusion
The image fusion framework includes 2 main steps, that is, automatic heart segmentation and multimodality image registration. Figure 2 describes the whole process of data processing. The proposed framework is of a general form for heart image registration and hence is not limited to PET-CTA fusion applications. It can also be applied to other tasks aimed at integrating functional and structural images obtained at different times with different machines.
Flowchart illustrating automatic heart segmentation and coronary computed tomography angiography (CTA)–positron emission tomography (PET) fusion framework. Heart segmentation was implemented in the same modality. The resulting fused image contains both cardiac structural information and functional information of myocardial viability and angiogenesis.
After data acquisition, the coronary CTA atlases and CT PET atlases were created by manually labeling the corresponding data set. Then, automatic heart segmentation was performed via a multi-atlas strategy. 18 –20 Next, we register CT FDG and CT RGD to the coronary CTA space, respectively. Since PET and CT images from the PET/CT scanner are already coregistered in the same space by built-in software, PET FDG and PET RGD images can be aligned to coronary CTA space using the deformation fields obtained by their corresponding CT registrations. Finally, the fusion results were visualized using 3D volume rendering. Details of the framework will be presented in the following sections.
Atlas Construction
We annotated 10 atlases for coronary CTA images of 10 subjects, and 10 atlases
for CT images of 10 subjects, respectively. A set of atlases (an atlas consists
of a binary label image outlining the heart region and the relevant grayscale
image) is denoted as

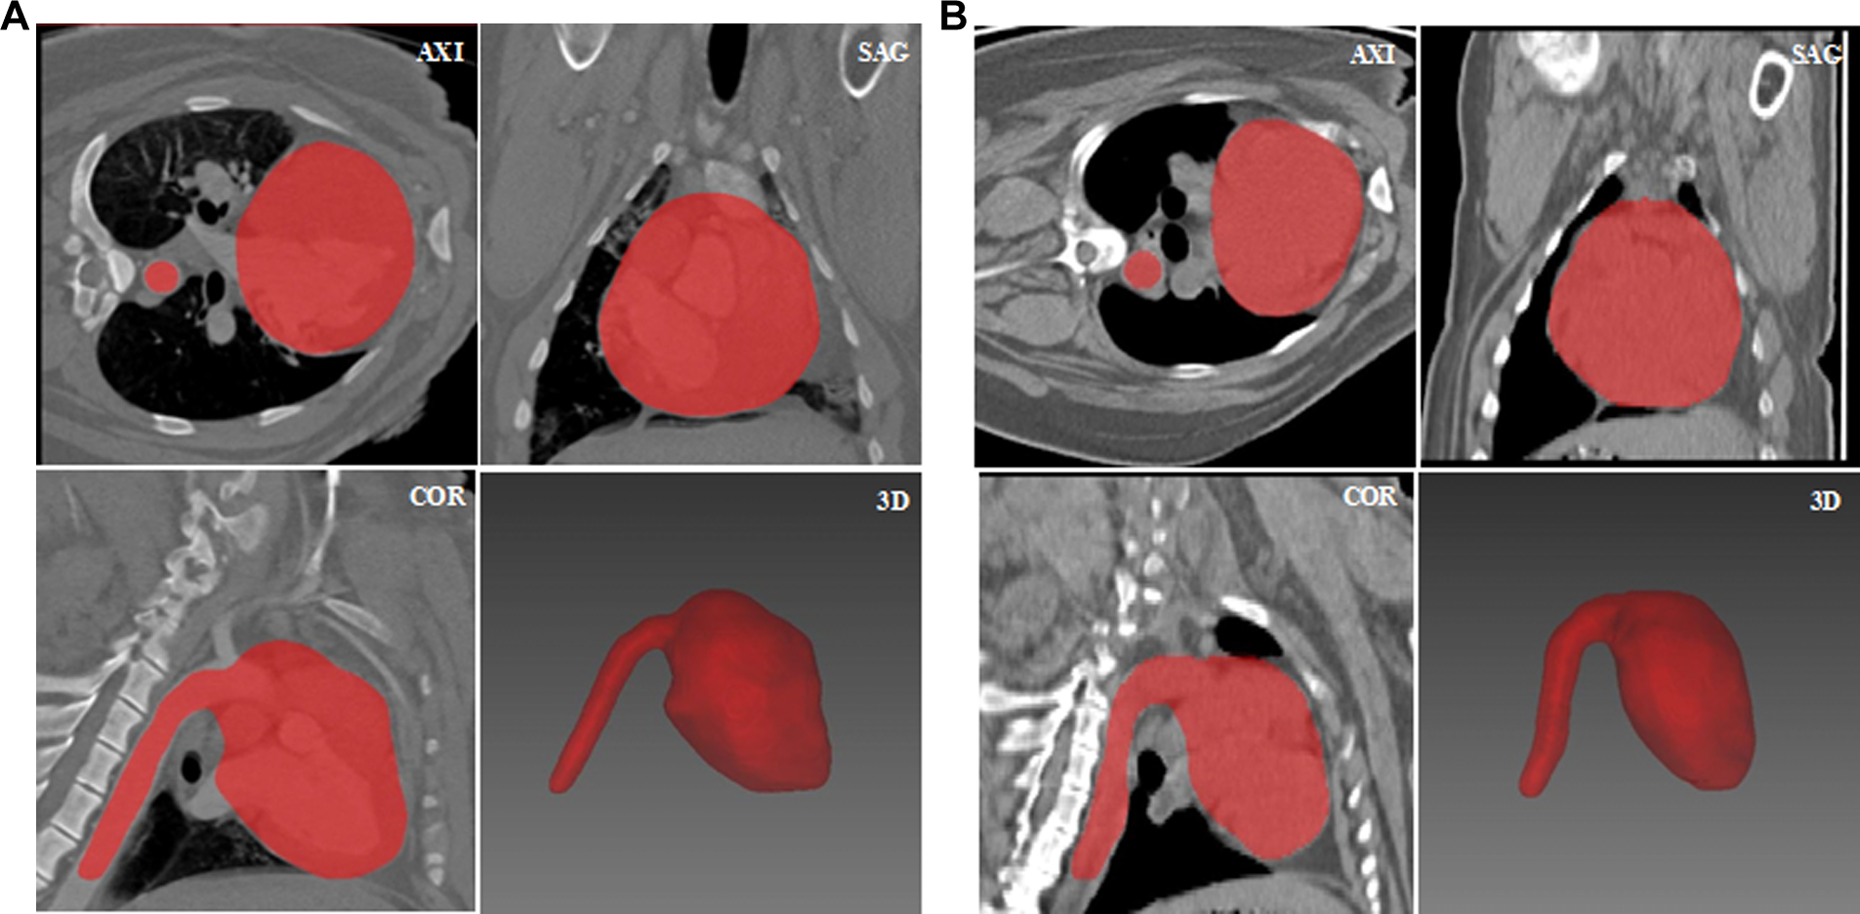
Examples of cardiac atlases. (A) An example of a coronary CTA atlas. Area in red is the label image manually delineated in the coronary computed tomography angiography (CTA) image. (b) An example of a CT PET atlas. The axial, sagittal, and coronal views are in the top left, top right, and lower left squares, respectively, and the 3-dimensional (3D) view of label image is in the lower right square.
During the atlas construction process, we retained the whole vena cava segment. It was used to determine the orientation of the heart and ease the following automatic heart segmentation and registration procedure.
Heart Segmentation Using a Multi-Atlas Strategy
Suppose V is a novel coronary CTA or CT
PET
image to be segmented, that is target image, which is the volume of
the area in the chest containing the heart. The heart segmentation in V is accomplished using the atlases of the same
modality. Multi-atlas heart segmentation includes the following steps: Alignment: Register image V with every
grayscale image Vi
of the atlases Propagation: Propagate the deformation fields T to the corresponding label image Li
of A to generate the
deformed label images Fusion: Apply the majority voting method to integrate the deformed
label images
It is necessary to state that automatic heart segmentation is not the focus of this article. Other segmentation methods such as pattern recognition 22 or the deformable model-based 23,24 methods can also be used as replacements. Other registration methods such as large deformation diffeomorphic metric mapping (LDDMM) surface registration or diffeomorphic demons are alternatives. Based on the reference, 25 multi-atlas-based segmentation using nonlinear registrations (free-form deformation [FFD], Demons, and LDDMM) had a similar performance; thus, we only employed B-spline-based FFD as the registration method.
Multimodality Cardiac Image Registration
Given the coronary CTA and PET/CT imaging of minipigs, the first step of image fusion is to obtain the label images of the heart in coronary CTA and CT PET manually or automatically based on the method mentioned in the second section. Then, we register the label image of CT into that of coronary CTA by deformable registration, which consists of an affine transformation and B-spline-based FFD registration. The basic idea of FFD is to deform an object by manipulating an underlying mesh of control points. 20 The resultant deformation field is then used to align the PET image with coronary CTA. Both PET FDG and PET RGD images are integrated into the context of the coronary CTA image from the same minipig. Coronary CTA-PET FDG and coronary CTA-PET RGD registration are implemented, respectively. The final fusion result contains 3 kinds of information: anatomical structure, myocardial viability, and angiogenesis.
In this article, the medical image registration toolkit Elastix 26 is adopted to align the images and propagate the deformation field. Elastix, an open-source software commonly used to solve medical image registration problems, is publicly available on http://elastix.isi.uu.nl/. The B-spline grid is defined by control points with a 20-mm separation. The algorithm optimizes the mutual information localized for the similarity measure. We chose the conjugate gradient method as the optimization algorithm. 27 The integrated volume is visualized using the ray-casting method, which is shown in the next section.
Results
Heart Segmentation Accuracy Analysis
In order to quantitatively evaluate the presented automatic heart segmentation
method, leave-one-out cross validation is used for coronary CTA and CT
PET
atlases, respectively. Leave-one-out cross validation was used for
evaluating all of these atlases. The n atlases
were divided into 2 parts: a hold-out atlas
Leave-One-Out Cross Validation Results for Coronary CTA Atlases.
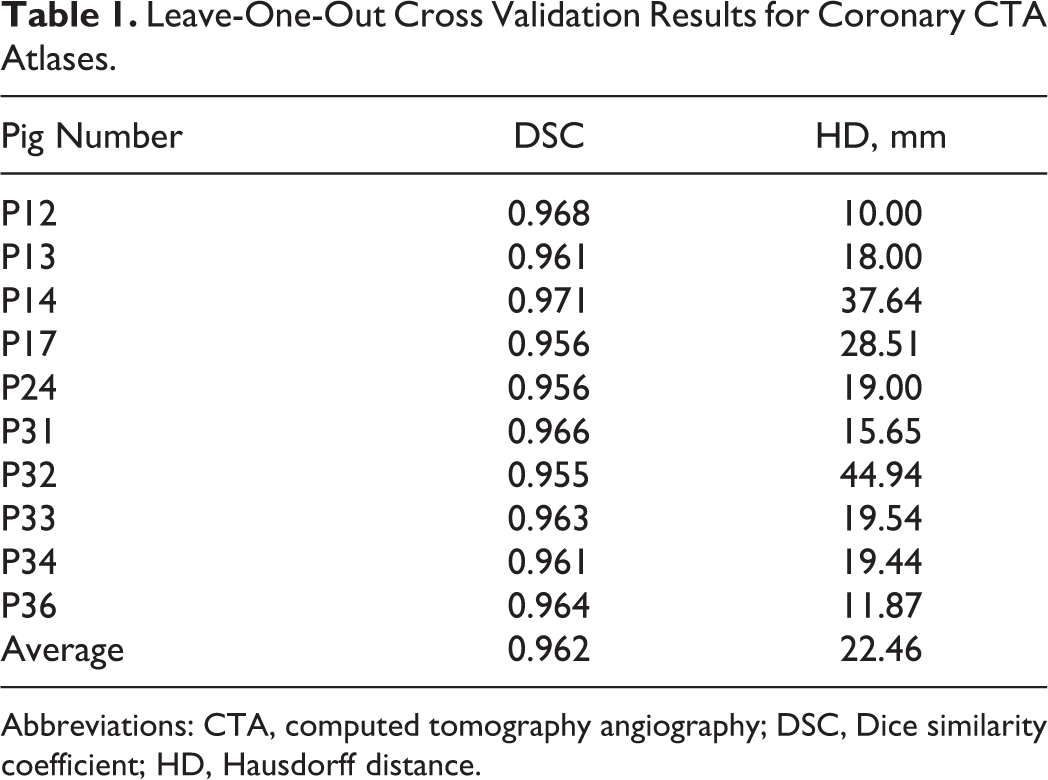
Abbreviations: CTA, computed tomography angiography; DSC, Dice similarity coefficient; HD, Hausdorff distance.
Leave-One-Out Cross Validation Results for CT PET Atlases.

Abbreviations: CT, computed tomography angiography; DSC, Dice similarity coefficient; HD, Hausdorff distance; PET, positron emission tomography.
As can be seen from the tables, the average DSCs for coronary CTA and CT PET atlases are 0.962 and 0.938, respectively, indicating that the performance of the multiple-atlas heart segmentation method is acceptable. From the larger value of DSC of all of the minipigs for coronary CTA, we may infer that the segmentation method performs better on coronary CTA than on CT PET . However, the HDs for CT PET are smaller than those for coronary CTA, which suggests a contrary conclusion. The inconsistency between results for coronary CTA and CT PET is also clearly demonstrated by the Box-and-Whisker plots in Figure 4. Compared to the segmentation results from Kirisli et al 27 and Zhuang et al, 30 the results in this article are satisfactory.

Box-and-Whisker plots for the leave-one-out cross validation of cardiac atlases. Boxes are interquartile ranges. The line within the box is the median. (A) Dice similarity coefficient. (B) Hausdorff distance.
Fusion Results
Based on the registration method mentioned in Section Multimodality Cardiac Image Registration, the cross-modality registration between coronary CTA and PET/CT images of the minipigs was achieved. Fusion results of 3 minipigs, including a normal control (P33) and 2 MI models (P13 and P24), are presented in Figure 5.

Fusion results of positron emission tomography (PET) with coronary computed tomography angiography (CTA) in a 4-window view. The transverse window is in the top left corner, the sagittal window in the top right corner, the coronal window in the lower left corner, and the 3-dimensional (3D) window in the lower right corner. (A) Coronary CTA-PET fusion image of a normal pig as the control group. (b) Coronary CTA-PET FDG fusion image with a small size defect. (C) Coronary CTA-PET FDG fusion image with a larger size defect. (D) Coronary CTA-PET FDG –PET RGD fusion image.
Figure 5A is the coronary CTA-PET FDG fusion image of a normal minipig as the control group, which shows a relatively uniform uptake of [18F]DG. Figure 5B and C shows the coronary CTA-PET FDG results of the 2 MI models with different extents of the glucose metabolism defect as a consequence of the left anterior descending artery infarction. Figure 5B shows that the defect appears in the apical wall of the left ventricle, while Figure 5C shows the defect in the anterior and apical wall segments of the left ventricle. The different extents of myocardial necrosis come from the location of embolism and the individual variables of the experimental subject. Compared with a 2D series, the 3D views of the fusion results can aid researchers in determining the location of the metabolism defect more intuitively and easily. The figures suggest that the greater the areas of the myocardial necrosis or ischemia, the more nondevelopment images are shown.
The observations about the area of MI from the coronary CTA-PET fusion images are verified using TTC pathology. Figure 6 presents the corresponding TTC pathology images of 3 experimental subjects (P33, P12, and P24). The normal tissues are in pink or red color, whereas the ischemic tissues are in white. Figure 6A is the TTC pathology image of the normal control, in which almost all myocardial tissues are in red. Figure6B shows a certain extent of myocardial death with an infarct scar lying in the apical wall of the left ventricle. Figure6C shows a larger extent of myocardial death compared to Figure6B, suggesting that the infarct territory had expanded to the anterior and apical wall segments of the left ventricle. The conclusions drawn from Figure 5 coincide well with the TTC stain results in Figure 6, which demonstrate the feasibility of the proposed multimodality cardiac image fusion framework.

Triphenyl tetrazolium chloride (TTC)-stained tissue pathology image of (A) control group. (B) Object with a small area of the heart muscle damaged. (C) Object with a large area of the heart muscle damaged.
Figure 5D presents the fusion results of both PET FDG and PET RGD with coronary CTA. Cardiac anatomic structure offered by coronary CTA appears in gray scale, while the myocardial viability signal offered by PET FDG appears in light orange, and the angiogenesis signal offered by PET RGD appears in red and green. From 2D views, we cannot easily determine where the angiogenesis occurs without consulting the polar bull’s-eye plot 31 ; whereas from the 3D display, it can be seen that the [68Ga]-NOTA-PRGD2 signal appears right below the blockage in the coronary arteries, indicating that vascular growth takes place in the normoxic myocardial regions proximal to the occlusion site. The phenomenon in Figure 5D hints that the formation of collateral arteries may arise from preexisting, rudimentary vessels. This observation coincides with the experimental results in reference. 32 It might be because hypoxic or ischemic preconditioning are important stimuli for the induction of new vessel growth, while the growth factors are potent in normoxic tissues. 33,34
Discussion and Conclusion
The combination of different modality medical images is a remarkable trend in the development of medical image processing, not only because such a combination adds diagnostic information compared with either of the employed modalities used in isolation but also because it has the potential to improve quantification utilizing the combined information from multiple modalities. Hybrid coronary CTA-PET also provides evidence for the development of the mechanistic understanding of sprouting angiogenesis.
In this article, we proposed a multimodality image fusion framework for a minipig MI model in vivo observation. Although there have been some studies on the creation of a MI animal model, few of them integrated images from different modalities to evaluate the degree of infarction and understand the pathway of angiogenesis. This article proposes a framework with all of the key components of the program in a systematic, concise, and coherent way, with the objective to lay foundations for further clinical research and application.
The proposed framework consists of 2 main steps: (1) automatic heart segmentation in coronary CTA and PET/CT data based on the multi-atlas segmentation method and (2) multimodality image registration via a coarse-to-fine approach. Although larger atlas databases can provide better performance, they demand more manual operation and will cause an increase in computational complexity. Thus, only 10 atlases for each image modality were constructed, depending on the quality of the raw images.
For the multi-atlas heart segmentation result, it can be seen that the DSC for coronary CTA is higher than that for CT PET , while HD for coronary CTA is lower than that for CT PET . The reason for the inconsistency is that CT PET has a relatively inferior resolution and cannot offer as many details as the coronary CTA image. Such a low spatial resolution makes the edge of the heart difficult to be contoured manually in CT PET . Even experienced researchers can only segment the general area of the heart. The label images for CT PET are smoother than those of coronary CTA (see Figure 3). Coronary CTA images provide more details about heart structure, which may lead to a greater degree of local deformation during label image registration. HD is sensitive to rotation and deformation, noise, and outliers 35 ; therefore, the HD for coronary CTA data can be larger than that for CT PET . Regarding the segmentation problem in this article, since there is no significant correlation between DSC and HD, we suggest that DSC is more robust and accurate.
Then, automatic heart segmentation was implemented using atlases of the same modality with those of the target image. In the registration step, the PET signal was transformed to coronary CTA space using CT PET as deformation field media. The preliminary results indicate good segmentation and fusion performance, which demonstrate the feasibility of the proposed method. The fusion results of this article reflected the cardiac structure and myocardial function intuitively, which may enhance the understanding and cognition about the true states of myocardial infarction for both clinicians and patients.
Upon finishing our proposed method, we noticed there were many improvement potentials. In our experiment, single-photon emission computed tomography (SPECT)-CT scan of some minipigs was conducted to obtain perfusion information. Nevertheless, the resolution of the reconstructed SPECT images is not enough to guarantee the accuracy of image fusion. Since our study mainly focused on the MI and angiogenesis after MI, and that 18F-FDG PET/CT is considered as the gold standard for myocardial metabolism assessment, in this article, the SPECT images were not fused with CTAs and PETs. However, the method proposed in this article can also be used to integrate SPECT images with CTA images. In the fusion step of our processing framework, we used a deformable registration approach to align CT with coronary CTA data spatially. Registration error may arise from whole heart segmentation errors in both CT and coronary CTA. Another source of registration error originates from integrating images of different cardiac phases, which is not taken into consideration in this study. The accuracy of registration and the impact of registration errors on the diagnosis remain to be investigated.
The presented framework currently can only be adapted for qualitative analysis. Quantitative assessment of myocardial perfusion is a clinical necessity. Therefore, our future work will also concentrate on quantitatively assessing the myocardial extent of hypoperfusion.
Footnotes
Authors’ Note
Z. Xu and B. Tao made equal contributions to the submitted article. The views expressed in the submitted article are the authors’ own and not an official position of the institution or funder.
Declaration of Conflicting Interests
The author(s) declared no potential conflicts of interest with respect to the research, authorship, and/or publication of this article.
Funding
The author(s) disclosed receipt of the following financial support for the research, authorship, and/or publication of this article: This work was supported by the Program of the National Key Research and Development Program of China [Grant No. 2016YFC1300302], National Natural Science Foundation of China [Grant No. 81227901and 81530058], the Natural Science Basic Research Plan in Shaanxi Province of China [Grant No. 2015JZ019], and the Fundamental Research Funds for the Central Universities (NSIZ021402).