
Abstract
The biological characterization of an individual patient's tumor by noninvasive imaging will have an important role in cancer care and clinical research if the molecular processes that underlie the image data are known. Spatial heterogeneity in the dynamics of magnetic resonance imaging contrast enhancement (DCE-MRI) is hypothesized to reflect variations in tumor angiogenesis. Here we demonstrate the feasibility of precisely colocalizing DCE-MRI data with the genomic and proteomic profiles of underlying biopsy tissue using a novel MRI-guided biopsy technique in patients with prostate cancer.
Introduction
Dynamic contrast-enhanced magnetic resonance imaging (DCE-MRI) provides a visual representation of both the anatomy and microvascular biology of cancer by measuring temporal changes in MR signal intensity associated with the intravascular injection of a contrast agent [1]. Spatial heterogeneity in the kinetics of contrast transit is thought to reflect variations in tissue perfusion, extracellular volume fraction, and microvascular permeability [2] Angiogenic microvessels, important for the growth and survival of cancer cells, are characterized in part by larger endothelial cell gaps resulting in greater permeability to molecules [3]. Kinetic analysis of DCE-MRI is thus hypothesized to create an image reflecting the underlying malignant vasculature of an individual patient's tumor. There is mounting incentive to incorporate imaging biomarkers, such as DCE-MRI, for patient selection and early measures of response in clinical trials of molecularly targeted antiangiogenic therapies [4]. Imaging has the potential to provide more complete information on a tumor's microvascular biology, in contrast to information obtained from a biopsy, which may be subject to sampling error. In addition, imaging is noninvasive and spares the potential morbidities of biopsy, lending itself to serial measurements through a course of therapy.
Preclinical reports have highlighted the rationale for histomolecular validation of DCE-MRI [5]. However, clinical data elucidating the molecular processes that underlie DCE-MRI and establishing its validity as a surrogate in the prostate gland are lacking. Notable intraprostatic [6] and intratumoral [7] heterogeneity mandates millimeter colocalization accuracy between tissue samples and their corresponding image pixels. When prostate MRI and tissue acquisition procedures are performed in different settings and at different times, clinical coregistration is fraught with error. To address this key issue, we developed a technique for MRI-guided needle biopsy of the prostate to be performed concurrently with a diagnostic MRI procedure inside a cylindrical 1.5T MRI scanner. Here we briefly report on the feasibility of this technique to permit histomolecular validation of human prostate MRI data by demonstrating our ability to (1) spatially colocalize MRI data to the biopsy site and (2) obtain tissue samples suitable for histological and molecular analysis.
Methods
Patients with localized prostate cancer provided informed consent for enrollment on this institutional review board-approved study. For the integrated procedure, patients are positioned prone and a custom-designed interventional endorectal imaging coil is inserted and secured to the scanner table. A needle guide inside the stationary imaging coil contains MR tracking microcoils allowing for spatial registration of the device [8,9]. A continuous series of DCE-MR images of the prostate (3-D spoiled GRE, scan time 5.1 sec; Figure 1A) are acquired before and during the injection of intravenous contrast (gadolinium chelate, 0.2 mmol/kg, 3 mL/sec). The needle guide is translated and rotated within the endorectal coil until its trajectory, computed from the tracking coils, coincides with a biopsy target location defined on the diagnostic images. A 14G core biopsy needle is then inserted, its location verified and documented by MRI (Figure 1B and C), and tissue is collected. This can be repeated for additional biopsy target sites within the prostate gland. The overall imaging and procedure time is approximately 90 min depending on the number of biopsies.
To analyze DCE-MRI data in this study, a T1 map of the prostatic anatomy is first generated [10] to estimate the concentration of gadolinium chelate for a given signal intensity. Pixel data are submitted to a general kinetic model (GKM) fitting algorithm [11] implemented in a custom software (CINE Tool, GE Healthcare Technologies, Baltimore, MD), which corrects the data for arterial input kinetics (measured over the external iliac artery) and implements a curve-fitting solution to a GKM convolution integral. In this fashion, regions of interest (ROIs) encompassing those MRI pixels that correspond to the biopsy locations can be defined, and their corresponding time-intensity profiles and summary kinetic parameters computed (Figure 1E). The transfer constant Ktrans (corresponding to the magnitude of the enhancement curve, unit min−1) and the rate constant kep (describing the rate of clearance, unit min−1) are thought to reflect differences in tissue perfusion and microvascular permeability, respectively. The kinetic parameters are derived based on the following equation:
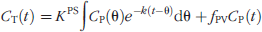
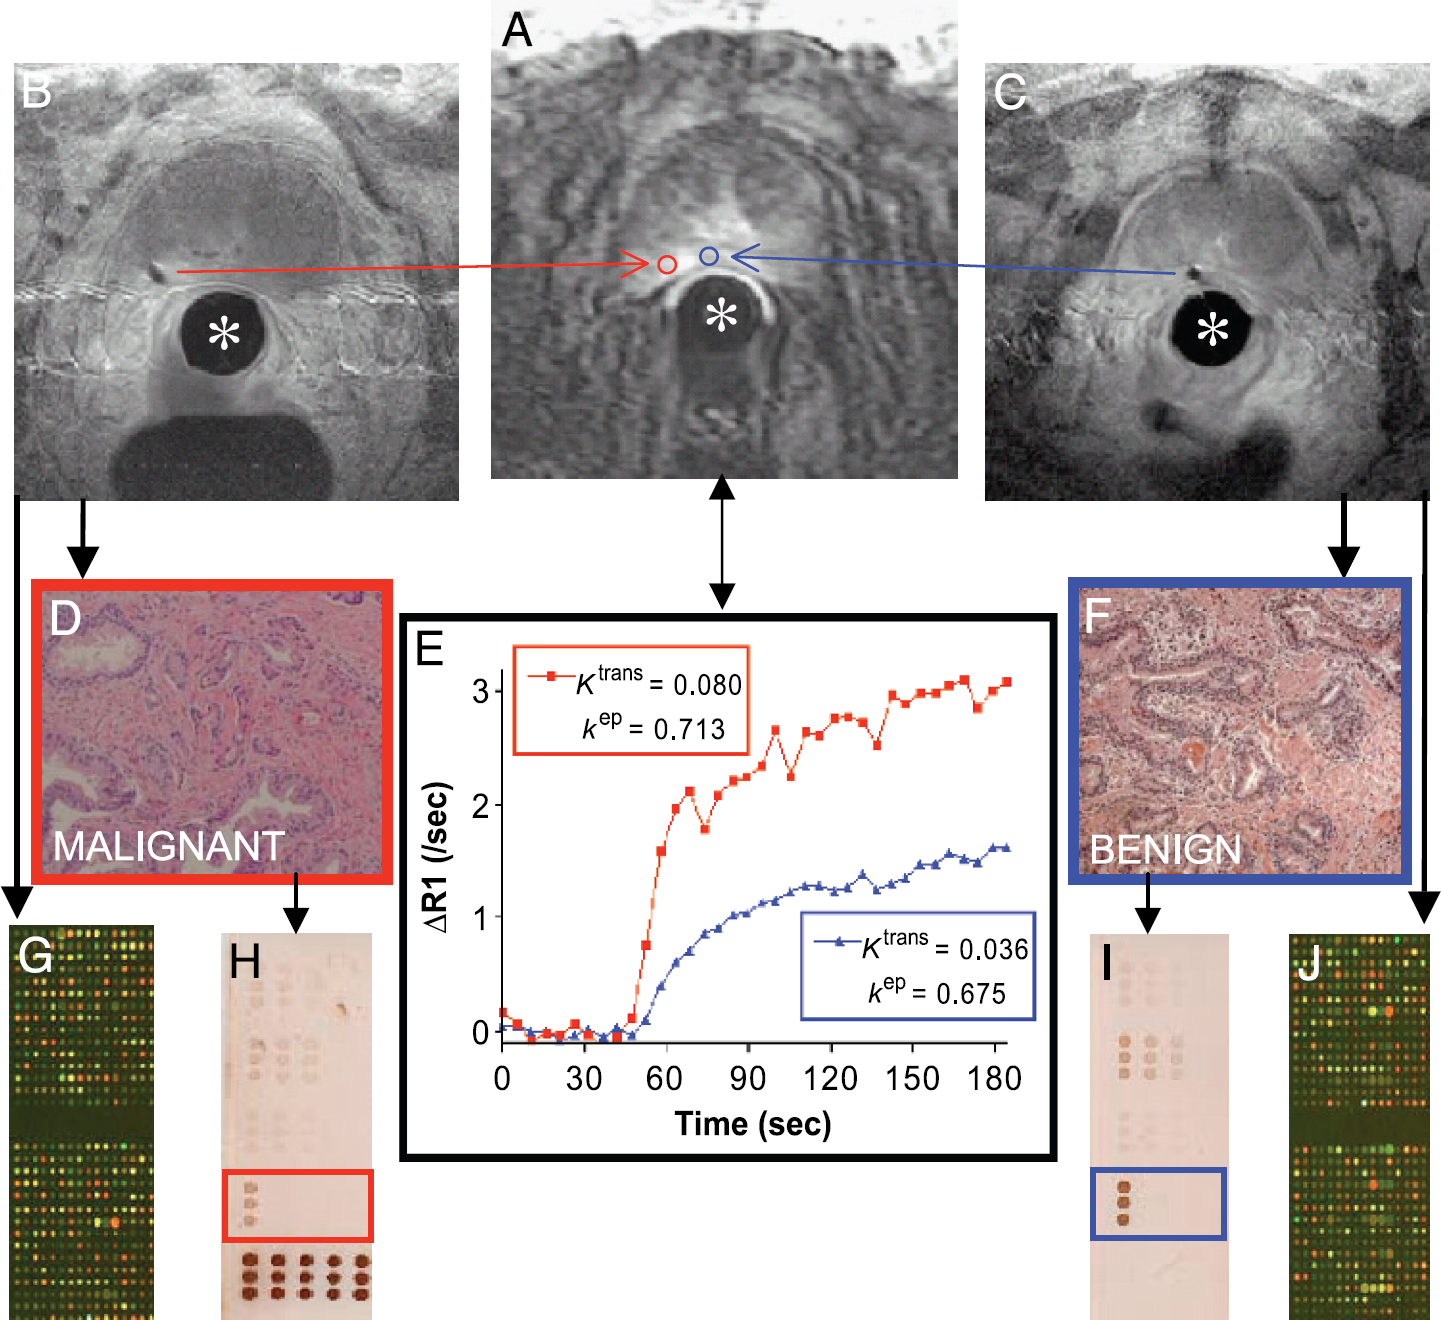
Case example demonstrating the feasibility and integration of prostate interventional MRI for the correlation of molecular biology and DCE-MRI. The stationary interventional endorectal coil (*) is used for both diagnostic and interventional MR imaging. (A) DCE-MRI at 120 sec shows a small area of increased signal intensity in the left peripheral zone of the prostate. ROIs (red and blue) corresponding to the subsequent needle biopsy voids (B and C) are defined for image analysis. (E) Time-intensity curves (corrected for T1 heterogeneity) from each ROI are fit to a GKM convolution integral using an arterial input function measured from the external iliac artery. The transfer constant Ktrans (corresponding to the magnitude of the enhancement curve, unit min−1) and the rate constant kep (describing the rate of clearance, unit min−1) are thought to reflect differences in the perfusion and microvascular permeability underlying each ROI, respectively [2]. H&E staining shows adenocarcinoma (D) corresponding in this case to higher Ktrans and kep than benign tissue (F). cDNA microarray (G and J) and reverse-phase protein array (H and I; array probed with STAT3 antibody shown) analysis can be performed on the biopsy cores.
To determine the suitability of biopsy specimens for histological and molecular analysis, twin core tissue samples were snap-frozen (for RNA isolation and molecular profiling) and fixed in 100% ethanol (for histological and proteomic analysis) immediately after their acquisition. The quality of ethanol-fixed specimens for histological interpretation was inferred from the pathology report. The feasibility of isolating and deriving protein profiles from ethanol-fixed and paraffin-embedded tissue blocks after histopathological evaluation was explored by obtaining whole-cell protein lysates from residual tissue sections placed on uncharged glass slides [12]. The protein lysates were then analyzed using reverse phase protein arrays [13]. The quality of the protein array data was based on the total protein concentration per spot and the linear dynamic range of the protein-antibody immunostaining reaction. Protein concentration/microarray spot was determined by staining the reverse phase protein microarray with colloidal gold total protein stain (AuroDye Forte).
To determine the feasibility of genomic profiling, the amount of RNA isolated from each snap-frozen core was documented before amplification. Total RNA was isolated using TRIzol reagent (Invitrogen) and purified with RNeasy mini kits (Qiagen) according to the manufacturer's instructions. RNA samples were amplified two rounds using RiboAmp RNA Amplification Kits (Arcturus) per manufacturer's instructions. The amplified tissue mRNA was then cohybridized to a cDNA microarray with a universal human research RNA (Stratagene) reference standard [14]. Microarray slides were obtained from the Radiation Oncology Sciences Program Microarray Laboratory at the National Institutes of Health. Slides were 8k human slides printed on-site using a Named Genes clone set from Research Genetics (Huntsville, AL) spotted onto poly-L-lysine-coated slides using an OmniGrid arrayer (GeneMachines). Replications were preformed and only array data with >.93 concordances were included in the analysis. After data extraction, scatter plots were generated for each microarray slide and Pearson coefficients of correlation were obtained to derive measures of quality (see Ref. [14] for detailed methods).
Results
Four MRI-guided biopsy procedures and a total of eight biopsy sites constitute the data for this feasibility study. All eight biopsy sites could be geometrically coregistered to the DCE-MRI data by identifying the location of the needle void relative to the prostatic anatomy on MRI and DCE-MRI (case example, Figure 1). All ethanol-fixed cores were of suitable quality for pathologic diagnosis, with no report of tissue degradation that would prohibit a valid histopathological evaluation. Two of the eight ethanol-fixed cores were analyzed in an exploratory fashion to determine the feasibility of protein profiling. The protein quality of the ethanol-fixed protein sections was confirmed by probing a Western blot of the tissue lysate with polyclonal anti-actin (Zymed). Approximately 0.25 μg/μL of protein per microarray spot was isolated from each residual ethanol-fixed paraffin tissue block, based on relative protein intensity of the microarray spots as compared to a BSA standard (Pierce, Rockford, IL). This is an amount deemed sufficient to prepare 25–50 reverse-phase protein microarrays.
Six of eight snap-frozen biopsy cores yielded sufficient RNA (mean 0.375 μg/μL) for direct microarray analysis. The remaining two biopsy cores yielded less RNA (0.053 and 0.045 μg/μL); however, these biopsy cores were suitable for microarray analysis after amplification. Microarray hybridization and resultant data quality was evaluated in two ways: (1) the number of replicate slides that were needed to achieve a correlation coefficient >.930 and (2) the percentage of spots per microarray slide that had adequate hybridization. To achieve a correlation coefficient >.93 three additional slides were needed for the six samples done in duplicate. Typically, 25-30% must be repeated. On average, 98.86% of the spots could be used per slide hybridization (range, 94.4-99.7%). Typically, 95% of the spots can be used in a standard microarray experiment. Therefore, the RNA purified, amplified, and hybridized from the patient cores was sufficient in amount and quality to perform genomic analysis.
Discussion
Our results show that the technical challenge of integrating needle-based prostate interventions with diagnostic MRI in a cylindrical clinical scanner can be overcome. Image subsites of interest can be precisely sampled in space and time, providing a research platform well suited to MRI and tissue correlation. We confirm that the tissue obtained from needle core biopsies using this technique was suitable for histopathological evaluation as well as for proteomic and genomic profiling. Such analysis was chiefly enabled by microarray technology, which is distinguished by its comprehensive analytic capabilities using low sample volumes.
Having established the feasibility of the technique, the molecular profile of prostate tissues underlying DCE-MRI will now be acquired in a larger series of patients in order to characterize the molecular biology of MR contrast enhancement. As we gain knowledge in the molecular biology underlying cancer and DCE-MRI, a more valid interpretation of an individual patient's tumor biology will ensue.
Footnotes
Acknowledgments
Supported in part by the following grants: NIH R01 EB002963, NSF EEC 9731478. U.S. Army Prostate Cancer Research Program Award DAMD17-01-1-0064, NSF ERC 9731478, and an NSF ERC PER grant. Robert Susil was supported by an NIH MSTP fellowship. We thank Guang Li software support in the interventional procedure, Andy Srikanchana for software support in DCE-MRI analysis, Elizabeth Goley and Caroline Cressey for genomic analysis, and Dr. M. Merino (Pathology).