
Abstract
Purpose:
Simultaneous positron emission tomography–magnetic resonance imaging (PET-MRI) is an emerging technology providing both anatomical and functional images without increasing the scan time. Compared to the traditional PET/computed tomography imaging, it also exposes the patient to significantly less radiation and provides better anatomical images as MRI provides superior soft tissue characterization. Using PET-MRI, we aim to study interactions between cartilage composition and bone function simultaneously, in knee osteoarthritis (OA).
Procedures:
In this article, bone turnover and remodeling was studied using [18F]-sodium fluoride (NaF) PET data. Quantitative MR-derived T1ρ relaxation times characterized the biochemical cartilage degeneration. Sixteen participants with early signs of OA of the knee received intravenous injections of [18F]-NaF at the onset of PET-MR image acquisition. Regions of interest were identified, and kinetic analysis of dynamic PET data provided the rate of uptake (Ki ) and the normalized uptake (standardized uptake value) of [18F]-NaF in the bone. Morphological MR images and quantitative voxel-based T1ρ maps of cartilage were obtained using an atlas-based registration technique to segment cartilage automatically. Voxel-by-voxel statistical parameter mapping was used to investigate the relationship between bone and cartilage.
Results:
Increases in cartilage T1ρ, indicating degenerative changes, were associated with increased turnover in the adjoining bone but reduced turnover in the nonadjoining compartments. Associations between pain and increased bone uptake were seen in the absence of morphological lesions in cartilage, but the relationship was reversed in the presence of incident cartilage lesions.
Conclusion:
This study shows significant cartilage and bone interactions in OA of the knee joint using simultaneous [18F]-NaF PET-MR, the first in human study. These observations highlight the complex biomechanical and biochemical interactions in the whole knee joint in OA, which potentially could help assess therapeutic targets in treating OA.
Keywords
Introduction
Osteoarthritis (OA) is a degenerative joint disease and a leading cause of chronic disability in the United States. The initial signs of OA include cartilage degeneration manifested as molecular and biochemical changes within the extracellular matrix. Changes in joint kinematics and biomechanical load distribution have been implicated in the initiation of OA. A conservative overall estimate of OA prevalence in the United States was estimated to be 26.9 million US adults in 2005. 1 The incidence of OA is expected to increase to 59 million by the year 2020. 2 The World Health Organization estimates OA to be the leading cause of chronic disability in 10% of the population older than 60 years, 3 and knee OA is associated with chronic disability as often as heart and lung disease. 4
Joint space narrowing (JSN), as measured by radiographs, is the current gold standard and the criterion for OA progression in clinical trials as accepted by the Food and Drug Administration. Radiograph-based Kellgren-Lawrence (KL) 5 scores are used to categorize participants based on the severity of OA. Long before changes in joint space can be detected, and morphological changes in cartilage occur, a depletion of proteoglycan and an increase in water content and disruption of the collagen network occurs. The symptoms include stiffness, limited joint function, and pain, which lead to a decrease in quality of life. Pain is one of the most important outcome measures in OA and is measured using questionnaires and patient-reported outcomes, such as the Knee Osteoarthritis Outcome Score (KOOS). The early biochemical changes in cartilage are not reflected in the KL grade or JSN from radiographs, but the KOOSs or pain is a measure of symptomatic OA.
Magnetic resonance imaging (MRI), with its superior soft tissue contrast, image resolution, and 3-dimensional (3D) imaging capabilities, has been widely studied in an effort to develop quantitative biomarkers for OA and fill the void that exists for diagnosis, monitoring, and assessment of soft tissue characterization and whole-joint degeneration in OA. Scoring systems such as the Whole-Organ Magnetic Resonance Imaging Score (WORMS) 6 grade cartilage lesions and correlate lesion severity with other findings such as meniscal defects, the presence of bone marrow lesions, as well as radiographic and clinical scores. 7 -9 Magnetic resonance-derived T1ρ and T2 assess the structural and biochemical properties of cartilage such as changes in collagen (T2) 10 and proteoglycan (T1ρ), 11,12 which are both increased in patients with OA compared to control groups. 13,14 In addition to differences in mean and compartmental averages of T1ρ and T2, studies have demonstrated differences in the spatial heterogeneity of these measures between normal controls and patients with OA. 15 -17
Early changes in OA are also seen in the adjoining subchondral and trabecular bone. Articular cartilage and subchondral bone act in concert during mechanical loading of the joint. The subchondral mineralized zone plays an important role in reducing the axial impact forces, typically encountered during dynamic joint loading 18 and adapts to the mechanical demands during normal and abnormal joint loading. 19 -21 A hypothetical model for OA pathogenesis has been proposed by Burr and Gallant, 22 whereby repetitive joint loading causes an initial increase in bone remodeling that is associated with increased vascular invasion of the deep layers of cartilage, which allows unopposed access to the cartilage by chondrolytic enzymes. These enzymes cause a breakdown of the extracellular matrix, loss of proteoglycan and collagen, and thus a loss of cartilage compressive stiffness, and an overload of the joint. Some of these bone remodeling changes are visible on positron emission tomography (PET) imaging. Paradoxically both early-stage increased remodeling and bone loss and the late-stage slow remodeling and subchondral densification are important components of the pathogenic process that leads to OA.
Using MRI for quantifying trabecular architecture, investigators have found a relationship between bone structure and articular cartilage morphology in patients with OA, especially the loss of trabecular bone in regions not adjoining the regions of cartilage loss. 23,24 Subchondral bone changes are present prior and during the development of OA and increased bone blood flow and bone remodeling, as demonstrated by [18F]-sodium fluoride (NaF) PET, 25 may be associated with patellofemoral pain and later stage morphological changes in cartilage. Draper et al 25 showed that pain is correlated to mean normalized standardized uptake value (SUV) measures obtained from PET imaging; so detecting early changes in bone remodeling could help in understanding the disease, relate it to changes in cartilage and whole-joint degeneration and possibly prevent the progression of OA, and provide strategies for reducing symptomatic OA in the future. As the authors 25 describe that even though most edema and cartilage lesions are present, bone metabolic abnormalities are seen where no lesions or structural changes are present on MR images.
The primary goal of this first-in-human study was to demonstrate bone–cartilage interactions in the whole knee joint in patients with OA using simultaneous PET-MRI to understand the pathophysiology of the disease. Positron emission tomography and MR provide different information about the OA in a patient and by combining these two modalities, we can obtain better and more accurate information about the pathophysiology of the disease and its progression.
The interaction between the bone and the cartilage is especially critical in early onset of the disease not only to determine the disease profile but also be able to detect early changes that most likely will show in the bone and therefore will be visible on PET imaging prior to the MRI of the disease.
With simultaneous detection of early cartilage biochemical degeneration using quantitative MR and bone remodeling in adjoining and nonadjoining regions, we can elucidate the natural history of the disease and assess therapeutic targets in the treatment of OA in the future. 26,27
Materials and Methods
Patient Population
Sixteen patients with knee OA (radiographic or symptomatic) were recruited compliant with the regulations of the Committee of Human Research (CHR), the institutional review board (IRB) at the University of California, San Francisco. Prior to the start of the study, all patients signed a written consent form approved by the CHR. The inclusion criteria were age >35 years, knee pain, aching, or stiffness on most days per month during the past year, or use of medication for knee pain on most days per month during the past year. The exclusion were (1) concurrent use of an investigational drug, (2) history of fracture or surgical intervention in the study knee, and (3) contraindications to MR. Radiographs were obtained from all patients to determine the KL score as a metric of prevalence and severity of radiographic OA. The score ranged from 0 to 4, where 0 showed no features of OA on the radiographs and 4 showed large osteophytes, JSN, severe sclerosis, and definite bony deformity. 5
All patients filled the validated patient-reported outcomes questionnaire (KOOS) 28 that provided a metric of pain, stiffness, and scores ranged from 0 to 100, where lower scores represented higher pain and symptomatic OA.
Positron Emission Tomography-Magnetic Resonance Imaging Examination Protocol
An intravenous catheter was placed, and the patient was positioned feet-first in a 3-T PET-MR scanner (GE Healthcare, Milwaukee, Wisconsin). An external medium-sized RF flex coil (GE Healthcare) was used due to the significantly lower attenuation effect on the PET signal (ie, low rate of stopping, 511 keV photons) compared to the conventional knee coil. The patients were injected with an average of 340.4 MBq of [18F]-NaF at the onset of the PET-MR scan. A dynamic PET scan was acquired from the time of injection for 60 minutes with MR sequences running concurrently. The MRI sequences acquired simultaneously with the PET acquisition were (1) high-resolution 3D fast spin echo (FSE, CUBE) and (2) quantitative sagittal 3D combined T1ρ/T2 (Table 1). 29 All PET reconstructions were performed using 3D Ordered Subsets Expectation Maximization algorithm with time-of-flight temporal resolution of approximately 400 ps. Magnetic resonance acquisition parameters and PET acquisition parameters are shown in Tables 1 and 2, respectively.
Magnetic Resonance Imaging Acquisition Parameters.a

Abbreviations: 3D, three-dimensional; FSE, fast spin echo; MRI, magnetic resonance imaging; TE, echo time; TR, repetition time; WORMS, Whole-Organ Magnetic Resonance Imaging Score; TSL, Spin-Lock Time; FOV, Field of View.
aThe table lists the MR acquisition parameters for the 3 MR sequences used: (1) localizer, (2) high-resolution 3D FSE CUBE, and (3) quantitative combined T1ρ/T2.
bXiaojan LI, Magn Reson Med. In vivo T(1rho) mapping in cartilage using 3D magnetization-prepared angle-modulated partitioned k-space spoiled gradient echo snapshots (3D MAPSS). Magn Reson Med. 2008 Feb; 59(2):298-307.
Positron Emission Tomography Acquisition Parameters.a

Abbreviations: avg, average; PET, positron emission tomography; max, maximum; SUV, standardized uptake value.
aThe table lists the PET acquisition parameters for the dynamic PET acquisition.
Magnetic Resonance Grading for Assessing Cartilage Lesions and OA Status
A board-certified radiologist (M.B.) graded the morphological MR images (CUBE, Table 1) using WORMS grading. 6 Cartilage lesions were graded as WORMS = 0 (normal thickness), WORMS = 1 (normal thickness, but increased signal intensity), WORMS = 2 (partial thickness focal lesion less than 1 cm at greatest width), WORMS = 2.5 (full thickness focal lesion less than 1 cm at greatest width), WORMS = 3 (multiple areas of partial lesions less than 1 cm at greatest width, or a grade 2 lesion wider than 1 cm, but less than 75% of the region), WORMS = 4 (diffuse partial thickness loss greater than 75% of the region), WORMS = 5 (multiple areas of full thickness lesion greater than 1 cm but less than 75% of the region), and WORMS = 6 (diffuse full thickness loss greater than 75% of the region). The summary of patient characteristics is shown in Table 3.
Patient Evaluation.a
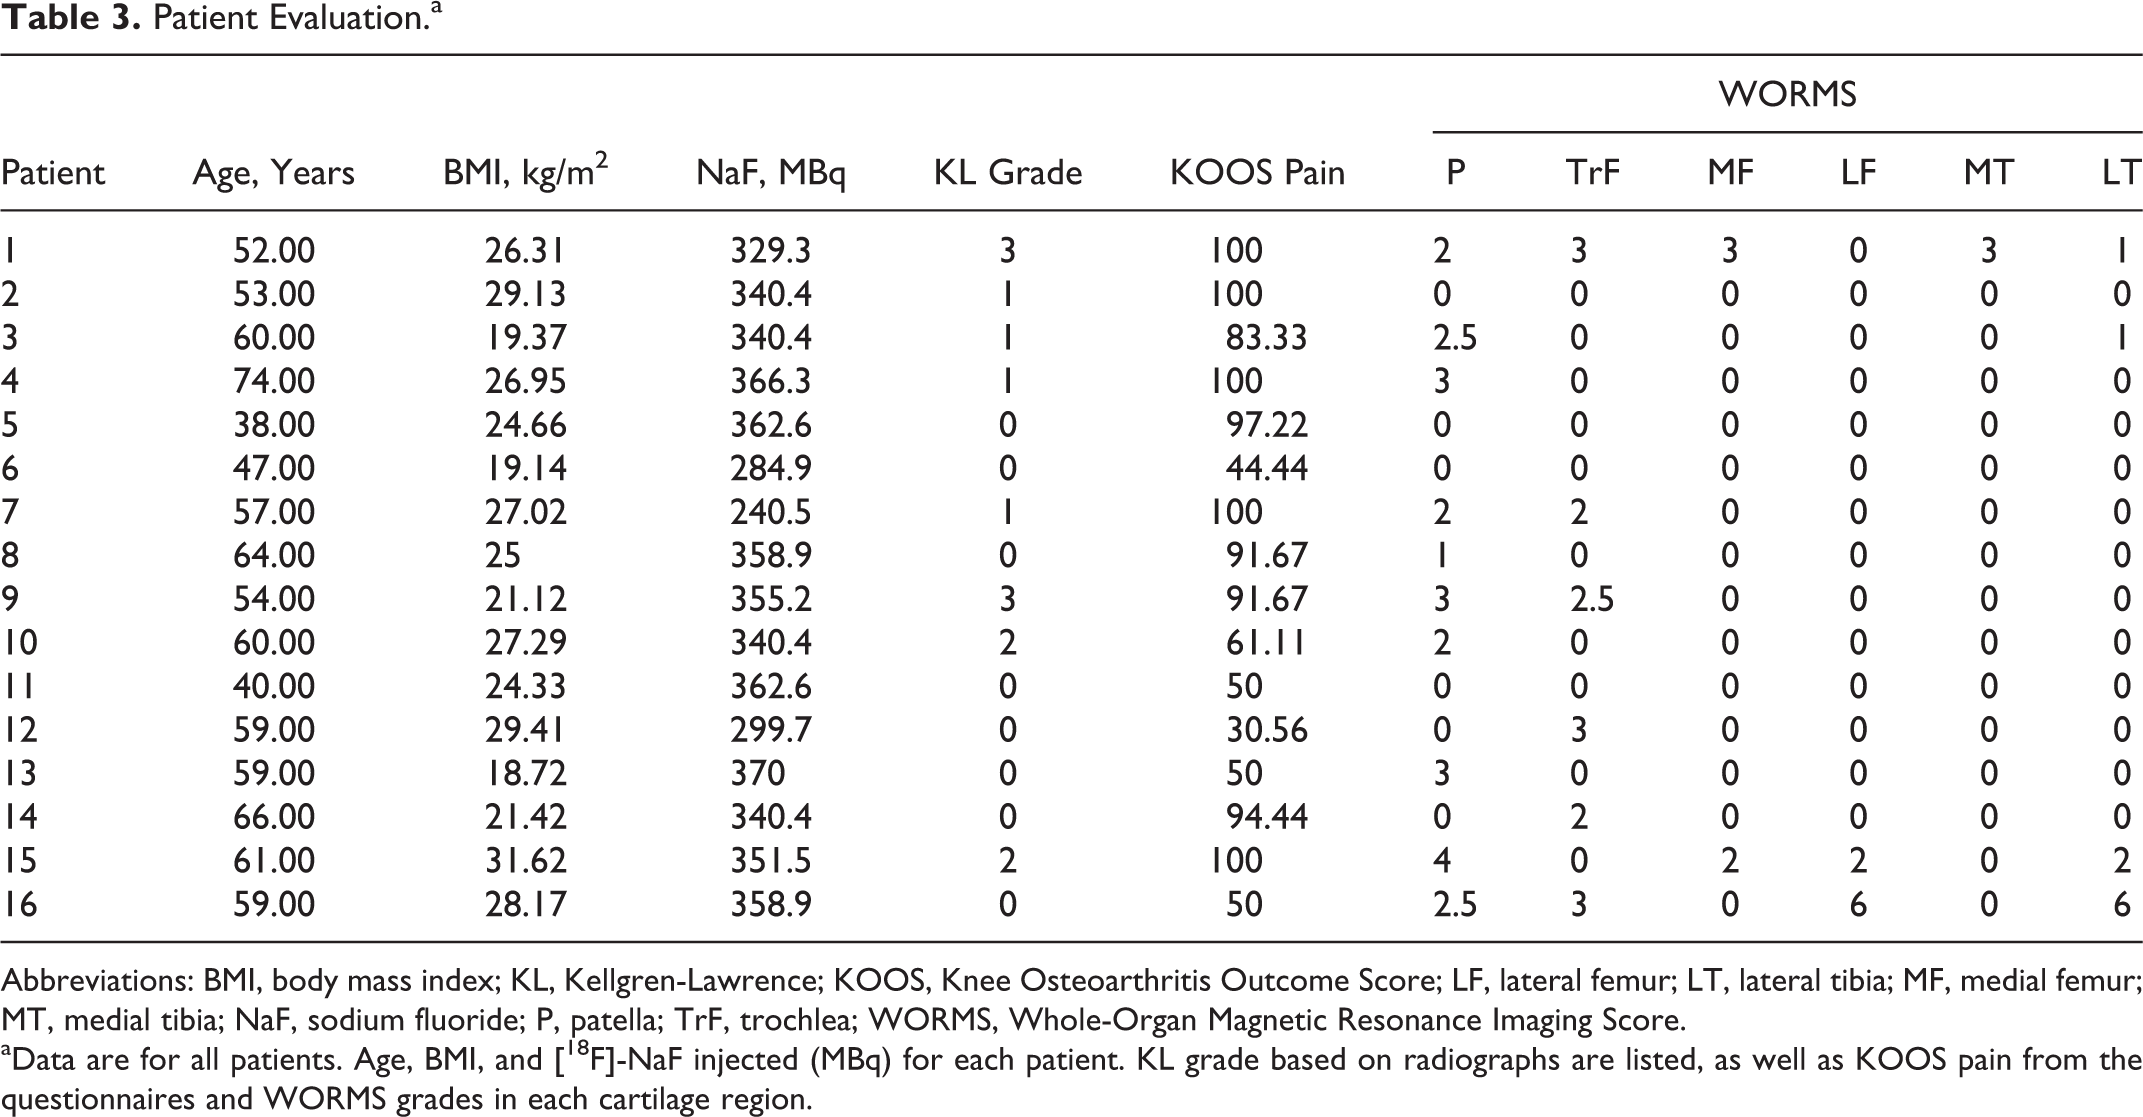
Abbreviations: BMI, body mass index; KL, Kellgren-Lawrence; KOOS, Knee Osteoarthritis Outcome Score; LF, lateral femur; LT, lateral tibia; MF, medial femur; MT, medial tibia; NaF, sodium fluoride; P, patella; TrF, trochlea; WORMS, Whole-Organ Magnetic Resonance Imaging Score.
aData are for all patients. Age, BMI, and [18F]-NaF injected (MBq) for each patient. KL grade based on radiographs are listed, as well as KOOS pain from the questionnaires and WORMS grades in each cartilage region.
Positron Emission Tomography Image Analysis
Physiologically, after intravenous injection of the radiopharmaceutical, [18F] ions are extracted from plasma in proportion to bone perfusion and quantitative studies of uptake are possible using dynamic PET. 30 The uptake of the fluoride ion in bone is rapid and the initial uptake is a function of bone blood flow; after residing in the perivascular fluid, an exchange of the fluoride ion with hydroxyl groups in the hydroxyapatite occurs and this is proportional to the surface area of the bone available, which is typically higher in immature bone, with high osteoblastic activity and remodeling. 31,32 The rate constants for these physiological processes calculated by the Patlak analysis method using dynamic multiframe data of PET in a region of interest (ROI) involves linear regression of curve fitting. Hawkins et al showed that a multicompartment nonlinear model including both bound and unbound fluoride ions were in good agreement with Patlak analysis as used in this study. 33 The Patlak graphical analysis method provided the influx rate constant Ki from the slope of the linear portion of the plot, reflecting bone remodeling. Both kinetic and simplified models have been shown to accurately quantify bone turnover using [18F]-NaF PET. 34 The most widely used parameters for semiquantification of PET measures, which do not require dynamic acquisitions, are the standardized uptake values (SUVavg and SUVmax) that are a measure of uptake and bone remodeling in case of [18F]-NaF, within a ROI decay corrected and normalized for the injected activity and for patient weight or lean body mass.
All bone ROIs were manually segmented as circular regions of interest in PMOD (PMOD Technologies Ltd, Zurich, Switzerland). All bone regions that were segmented were adjacent to the respective cartilage regions (ROIs)—patella (P), trochlea (TrF), medial femur (MF), medial tibia (MT), lateral femur (LF), and lateral tibia (LT). The regions were the same size across all patients and did not overlap with the cartilage. The last 10 minutes of the 60-minute dynamic PET acquisition were summed, and the data were analyzed with both maximum and average SUVs (SUVmax and SUVavg). The entire 60-minute PET acquisition was used to do kinetic analysis by using the data from an ROI placed in the popliteal artery as the input function. The input function was corrected for the partial volume effect by acquiring phantom data with different sized cylinders, with known activity and correcting for the partial volume. The 60-minute dynamic PET data were assessed using a linear Patlak graphical analysis method; the slope from the Patlak plot, Ki (ie, [18F]-NaF influx rate contrast—an estimate of uptake rate) in each bone compartment (adjacent to the cartilage compartments) was computed. Average and maximum SUVs (SUVavg and SUVmax) and the Ki values can be seen in Table 4.
Summary of Patient Data.a
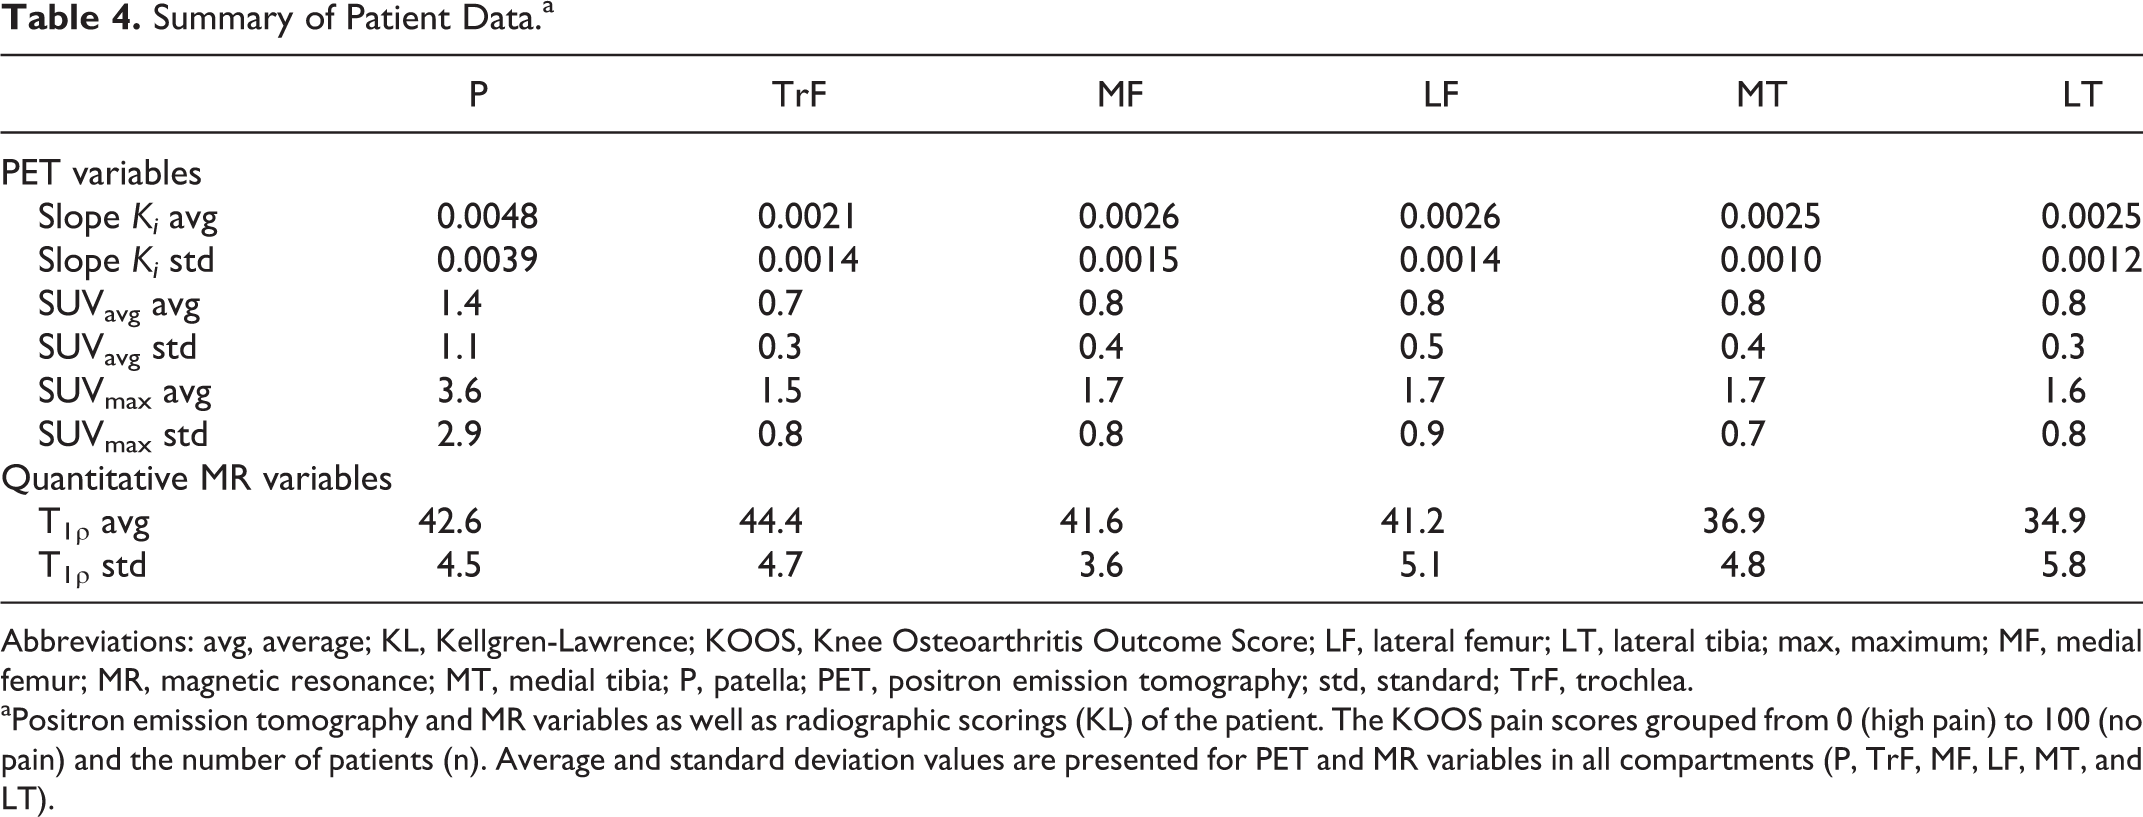
Abbreviations: avg, average; KL, Kellgren-Lawrence; KOOS, Knee Osteoarthritis Outcome Score; LF, lateral femur; LT, lateral tibia; max, maximum; MF, medial femur; MR, magnetic resonance; MT, medial tibia; P, patella; PET, positron emission tomography; std, standard; TrF, trochlea.
aPositron emission tomography and MR variables as well as radiographic scorings (KL) of the patient. The KOOS pain scores grouped from 0 (high pain) to 100 (no pain) and the number of patients (n). Average and standard deviation values are presented for PET and MR variables in all compartments (P, TrF, MF, LF, MT, and LT).
Quantitative MR Image Analysis
All cartilage regions were automatically segmented as described by Pedoia et al. 35 One patient with average weight and body mass index (BMI) was selected as the reference. Six ROIs were semiautomatically segmented on the reference image—P, TrF, MF, LF, MT, and LT. The 3D FSE CUBE previously rigidly registered on the first Spin-Lock Time (TSL) image of T1ρ sequence was used for the semiautomatic segmentation of the reference. Piecewise rigid registration was applied along the echoes to take into account nonrigid movement of the articulation during the scan. Cartilage ROIs were used to define the borders of the 3 masks that only included the femur, tibia, and P bones. Those masks were then used to constrain the piecewise registration. Each registration was initialized by the results of the one obtained on the previous echo; this approach allowed for good registration performances even in the later echoes characterized by poor SNR.
Nonrigid registration of all images on the reference space was performed. T1ρ maps were obtained by fitting the transformed T1ρ-weighted images using a Levenberg-Marquardt monoexponential, (
Three-dimensional representations of the SPM were generated using a technique based on Laplace equation, previously used to generate cartilage thickness maps. 36 The technique yields a one-to-one matching between points in the bone–cartilage interface and points in the articular surface with no crossings. Laplace equation was numerically solved in 3 dimensions with Dirichlet boundary conditions obtaining a potential map. A vector field was generated to lead each point in the bone–cartilage interface to a point in the articular surface. Average R values along this trajectory are computed and projected on the triangulated mash obtained from 3D bone segmentation of the reference knee. A visual inspection of the SPMs was then conducted to identify global pattern of association between bone remodeling and cartilage relaxation times.
Results
Study Population
Sixteen patients with varying degrees of knee OA were studied using an integrated PET-MR system (GE Healthcare, Waukesha, Wisconsin). Table 3 lists the patient demographics, isotope dose, the OA status, and pain. The average age of the patients was 57 years and average BMI was 25.3 kg/m2. The average [18F]-NaF dose injected was 340.4 MBq in 11 males and 5 females. Twelve of the patients had minimal or no sign of radiographic OA (KL grade 0 and 1); however, they did have some pain based on the KOOS questionnaires. Four of the patients had either KL grade 2 (definite osteophytes—possible JSN) or KL grade 3 (multiple osteophytes—definite JSN—possible bony deformity). The patients had varying degrees of pain assessed using the patient-reported questionnaire—KOOS (average KOOS = 78; range, 30.6-100). Magnetic resonance-derived WORMSs showed the highest lesion load in the patellar cartilage (Table 3). Quantitative MR images provided T1ρ in each of the above cartilage compartments (Table 4). Figure 1 shows an example of the T1ρ map of a patient with KL grade 2 and WORMS grade 2 in the TrF. In this example, the high spatial heterogeneity of the cartilage composition is notable; clusters of higher T1ρ in the articular layer of the P and the TrF as well as in the MT are demonstrated.

Voxel-based T1ρ maps. An atlas-based voxel-by-voxel T1ρ map that shows regions in the medial tibia (MT), the medial femur (MF), patella (P), and in the trochlea (TrF). The T1ρ color maps are overlaid on a gray scale magnetic resonance (MR) image and the color bar represents relaxation times from 0 ms (blue) to 70 ms (red).
Quantitative and Semiquantitative PET
The average and maximum [18F]-NaF uptake values as SUVavg and SUVmax in all bone compartments (Figure 2A) were plotted against [18F]-NaF uptake rate (slope Ki ), which is obtained from kinetic modeling with a linear Patlak method. Slope Ki correlate with the semiquantitative SUVavg and SUVmax (R 2 = .7) in all bone compartments (Figure 2B and C).

Correlations between quantitative and semiquantitative positron emission tomography (PET) measures. A, PET-magnetic resonance (MR) fused image in the lateral and medial side of the knee. Bone compartments are showed as regions of interest (ROIs) in the lateral and medial side of the knee in compartments—patella (P), trochlea (TrF), lateral femur (LF), lateral tibia (LT), medial femur (MF), medial tibia (MT). B and C, Correlations between NaF uptake at 60 minutes (standardized uptake value [SUV]) in all bone compartments plotted with the uptake rate (Ki ) in the same compartments. SUVavg and SUVmax have high correlations with slope Ki (R 2 = .71 and 0.69).
The uptake rate defined by slope Ki obtained from the Patlak method in all compartments is presented as (average ± standard deviation)—P: 0.005 ± 0.0039, TrF: 0.0023 ± 0.0017, MF: 0.0028 ± 0.0017, MT: 0.0028 ± 0.0014, LF: 0.0028 ± 0.0015, and LT: 0.0027 ± 0.0013 (Table 5).
Sodium Fluoride Uptake Associated With Pain.a

Abbreviations: KOOS, Knee Osteoarthritis Outcome Score; LF, lateral femur; LT, lateral tibia; MF, medial femur; MT, medial tibia; NaF, sodium fluoride; P, patella; SD, standard deviation; SUV, standardized uptake value; TrF, trochlea; WORMS, Whole-Organ Magnetic Resonance Imaging Score.
a[18F]-NaF uptake rate (slope Ki ) in the bone compartments (mean ± SD), comparison between compartmental uptake rate found with paired t test (P < .05). [18F]-NaF uptake (SUVavg) in the bone of the P is divided into those with lesion based on WORMS, and those without lesions, as well if they were with pain (KOOS < 90) or without pain (KOOS > 90), these groups (NaF uptake in the P; SUVavg) were approaching significance with an unpaired t test with P < .1.
bSignificance <.05 compared to P.
cSignificance <.05 compared to TrF.
dApproaching significance P < .1.
A significant difference (paired t test, P < .05) was found in the P compartment compared to all other bone compartments and between the TrF and the LF as well as between the TrF and the MF bone. Ten (63%) patients had the fastest uptake rate in the P (slope Ki ). In 25% of the patients, the highest uptake rate was in the lateral and MT resulting in the tibia being the compartment with the second fastest average uptake rate. However, the average slope Ki in the tibia was only significantly different from P (Table 5). The same trends are seen for SUVmax, where 63% of the patients have the highest uptake in the P (SUVmax) and the second highest [18F]-NaF uptake is found in the femur.
The average standardized uptake values (SUVavg) showed a dependence on the presence of lesions in the P but also on the patient’s pain (Table 5). In patients with WORMS of 0 and 1 indicating no lesions, or mild OA, the patients with pain had higher SUVavg values (SUVavg = 2.0) compared to those without pain (SUVavg = 0.9), showing significant trends, P < .1. However, in the presence of morphological lesions in cartilage, WORMS >1, those without pain (SUVavg = 1.9) had higher SUVavg values compared to those with pain (SUVavg = 0.8), also approaching significance, P < .1.
Knee Bone–Cartilage Interactions
Correlations between the remodeling in the bone and degeneration in the cartilage were observed across several bone and cartilage compartments, and interactions were seen in adjacent regions but also in compartments, which were not adjoining. The highest correlations between the PET values from the bone and the T1ρ values from the cartilage were seen with Ki in the MT (Figure 3), and with the SUVmax in the P (Figure 4) and in the LT (Figure 5). The color bar ranges from strong negative correlations (light blue, purple, and blue) to strong positive correlations (red, green, and yellow) denoted with a correlation coefficient, R (range: −1.0 to 1.0, where the P value = 0.0001 for R = ±.8). A scatterplot for the average values for all patients are depicted in the white box selected regions (Figures 3 –5), where there are large clusters of voxels with moderate to strong correlations. The ellipse represents 95% confidence interval.
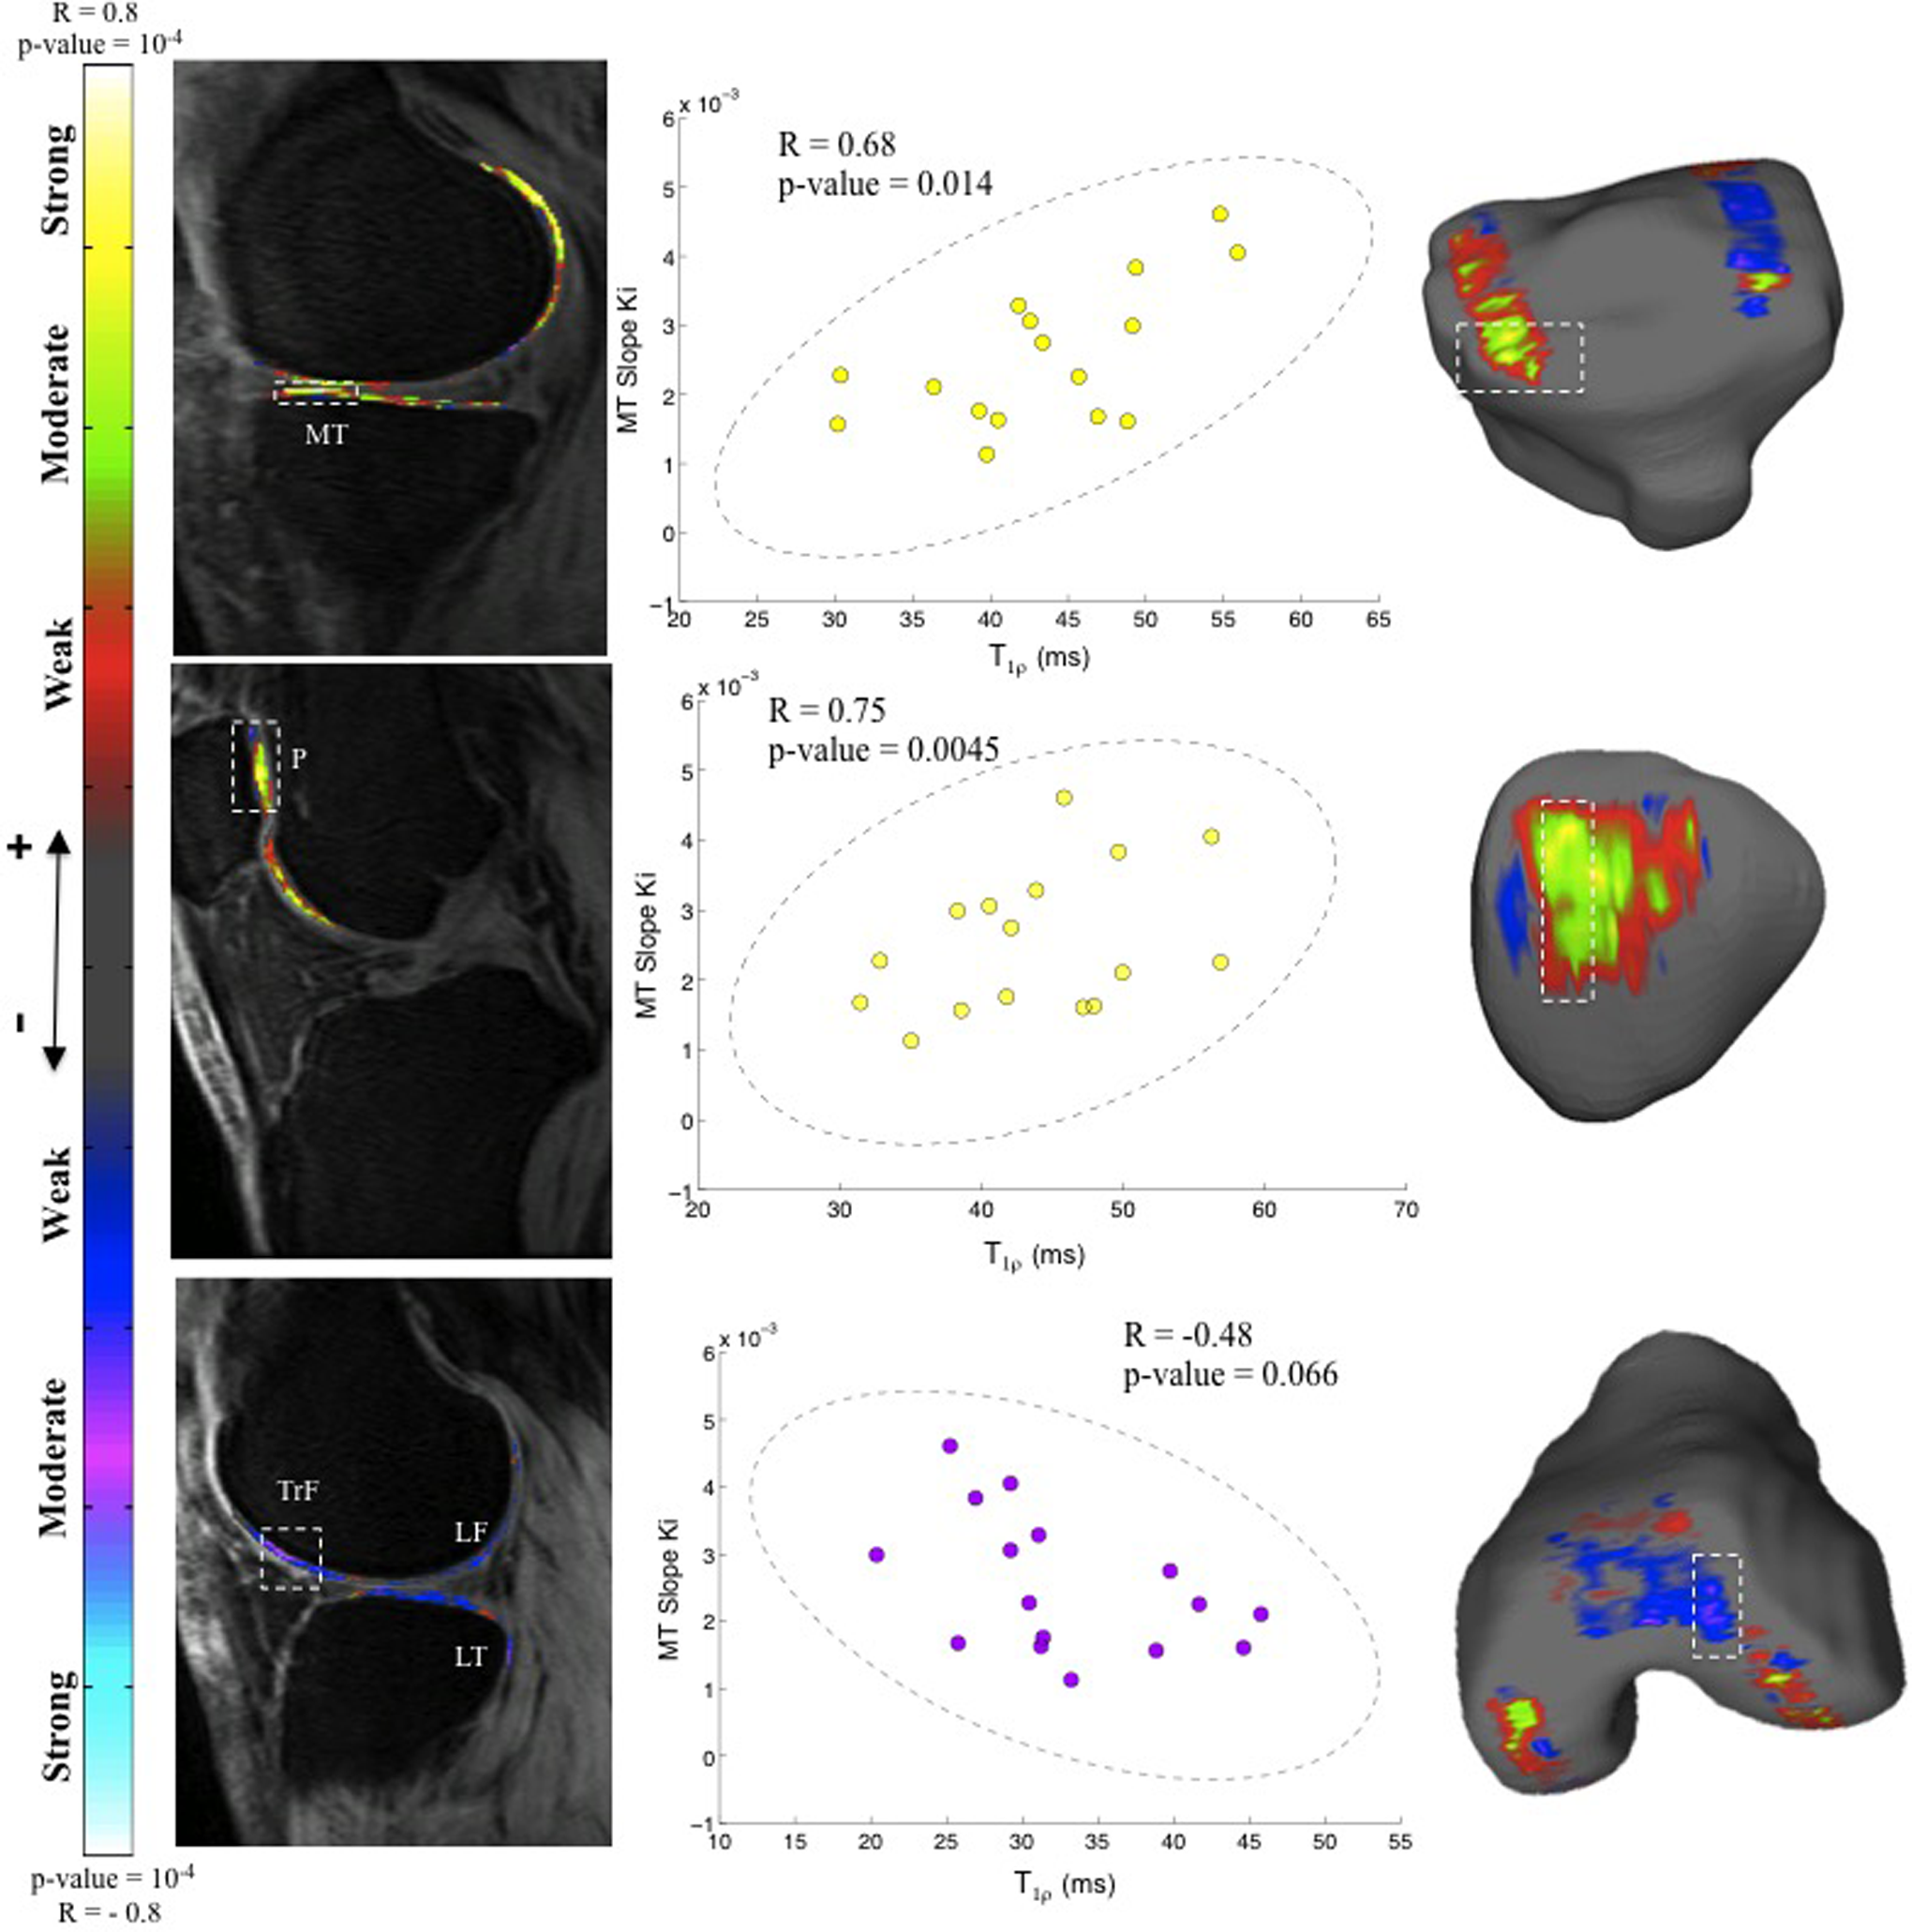
Voxel-based T1ρ maps from the cartilage correlated with slope Ki from the bone of the medial tibia (MT). The color map represents the Pearson correlation R values representing positive and negative correlations. The right side shows the scatterplots of the average value of the voxels in white dashed boxes from the magnetic resonance (MR) images. The ellipse illustrates the 95% confidence interval. (Top) Anterior MT cartilage shows a strong positive correlation with the slope Ki from MT bone (R = .68, P = .0014). (Middle) The patella cartilage shows a strong positive correlation with slope Ki from MT bone (R = .75, P = .0045). (Bottom) The trochlea (TrF) cartilage shows a moderate negative correlation with slope Ki from MT bone (R = −.48, P = .066).

Voxel-based T1ρ maps from the cartilage correlated with standardized uptake value (SUVmax) in the bone of the patella (P). The color map represents the Pearson correlation R values representing positive and negative correlations. The right side shows the scatterplots of the average value of the voxels in white dashed boxes from the magnetic resonance (MR) images. The ellipse illustrates the 95% confidence interval. (Top) The bone layer of the P cartilage shows a moderate positive correlation with SUVmax from the P bone (R = .42, P = .10). (Middle) The articular layer of the P cartilage shows a moderate negative correlation with SUVmax from the P bone (R = −.50, P = .048). (Bottom) The trochlea (TrF) cartilage shows a strong negative correlation with SUVmax from the P bone (R = −0.72, P = .002).

Voxel-based T1ρ maps from the cartilage correlated with standardized uptake value (SUVmax) from lateral tibia (LT) bone. The color map represents the Pearson correlation R values representing positive and negative correlations. The right side shows the scatterplots of the average value of the voxels in white dashed boxes from the magnetic resonance (MR) images. The ellipse illustrates the 95% confidence interval. (Top) The cartilage of the lateral tibia (LT) shows a strong positive correlation with SUVmax from the LT bone (R = .74, P = .0042). (Middle) The cartilage in the posterior lateral femur shows a strong positive correlation with SUVmax from the LT bone (R = .71, P = .0062). (Bottom) The cartilage in the medial femur (MF) shows a strong negative correlation with SUVmax from the LT bone(R = −.61, P = .012).
The slope Ki obtained from the MT bone was correlated with the T1ρ relaxation times in the cartilage of the MT, the posterior MT, P, and TrF (Figure 3).
A strong positive correlation was observed between T1ρ relaxation times in the cartilage of the MT with the MT slope Ki (R = .68, P = .0014), and similarly in the P (R = .75, P = .0045), whereas a moderate negative correlation was observed in the TrF with the MT slope Ki (R = −.48, P = .066; Figure 3).
The SUVmax in the P bone was correlated with the T1ρ in the bone layer of the cartilage (R = .42, P = .10), and the articular layer (R = .50, P = .048) of the P cartilage, and the SUVmax in the P bone was strongly negatively correlated with T1ρ from the TrF cartilage (R = −.72, P = .002; Figure 4).
The SUVmax in the LT bone was correlated with T1ρ in the LT cartilage (R = .74, P = .0042), LF cartilage (R = .71, P = .0062), and MF cartilage (R = −.61, P = .012; Figure 5).
Discussion
Kinetic [18F]-NaF/T1ρ PET-MR studies were performed in patients with different degrees of knee OA at the University of California, San Francisco, to investigate the interaction of the cartilage with the bone. A direct correlation was identified between the cartilage biochemistry, quantitative MR biometrics, and PET evidence of bone remodeling in patients with knee OA. This demonstration of bone–cartilage interactions in patients with knee OA in adjoining and nonadjoining regions leads us to speculate about the concept of the Bone–Cartilage Connectome. Our results support the complex interplay between biomechanics and joint loading as well as biochemistry and tissue degeneration as a composite in OA, a disease affecting the whole joint, showing even trends with pain. Both imaging modalities are critical to obtain a comprehensive overview of the disease to get to the core of the pathophysiology of OA with the aim of treatment; however, larger longitudinal studies are further needed.
Despite the relatively small sample size, the correlations between [18F]-NaF uptake in the bone, morphological lesions in MR, and pain scores approached statistical significance (P < .1). Based on our results, we speculate that early OA is initiated by increases in repetitive loading of the P, with subsequent increases in bone remodeling and release of degradative proteinases, which depletes proteoglycan from the extracellular cartilage matrix. On MRI, this manifests as increases in T1ρ. Several knee nerve endings are close to the patellar fat pad; we speculate that the degradative enzymes irritate the nerve endings, giving rise to pain. Pain was present in both knees with high and low metabolic activity, with different stages of OA suggesting that pain is complex and subjective. It is likely that the threshold for feeling the pain is dependent on the patient and on the length of the OA disease. Studies showed that pain correlates with T2 relaxation times in early OA and can therefore be a quantitatively measurable biomarker for knee pain 37,38 ; however, due to the small sample size, this only approaches statistical significance in this study. Given these findings, future studies will be able to study pain more thoroughly using the PET-MRI technology and our experimental setup as a basis.
A discrepancy between [18F]-NaF uptake and morphological MR lesions in adjoining regions, along with increased uptake in patients with pain was also seen by Draper et al, 25 using PET/CT and MR that were done sequentially. Our study confirmed the trend, however, our investigation of early changes in cartilage biochemistry, the automatic atlas-based segmentations 35 and voxel-based T1ρ, and SPM further revealed complex interactions. Subchondral bone is known to be involved in OA development and subchondral sclerosis is frequently seen in patients with OA, as is trabecular bone osteopenia. It remains unclear whether bone changes precede cartilage deterioration or are involved in the progression of the disease. 39 Interestingly, in this study, in the presence of morphological lesions, lower remodeling was seen in patients with pain. The MR morphological grading demonstrated multiple areas of partial cartilage loss/defect in the TrF but no lesions in the P. Patella showed both the highest and fastest remodeling (Table 5), indicating that loading affects different knee compartments differently, perhaps due to biomechanical loading and perhaps consistent with the findings of Hunter et al who found that knee pain was highly associated to degeneration in the cartilage of the P. 38
Increased rate of bone turnover using both kinetic and SUV data was seen in several compartments, where uptake of [18F]-NaF was seen simultaneously with early degenerative changes in the cartilage. Increased bone turnover was also seen, when there was mechanical overload, such as the contact areas, which can also cause damage to the bone that leads to remodeling, that does not necessary increase the bone density but could cause bone turnover to increase. 40 Burr and Schaffler suggested that it was only the cartilage and the adjacent bone that was significant for the disease progression of OA.39 However, in this study, we found compelling evidence that it was not only the adjacent regions that affect the health of the knee but also bone remodeling at a greater distance to the cartilage regions with increased stress as seen from T1ρ values from the cartilage. In order to establish the relationship more conclusively, clearly, longitudinal data and larger sample sizes are necessary.
As an example for the nonadjacent connection, the slope Ki from the MT was positively correlated with the T1ρ in the cartilage on the medial femoral-tibia side and on the P and was negatively correlated with T1ρ in the cartilage on the lateral femoral-tibia side of the knee; this could relate to the loading pattern of the knee, so that the loading shifts from the lateral side of the knee to the medial. Vincent et al 41 showed that once OA has occurred, the mechanical and morphological characteristics lead to further degeneration of the cartilage. Using voxel-based relaxometry, we were able to distinguish between different relationships between bone–cartilage associated with the different layers of the cartilage, this was seen in several compartments, such as the TrF and the LT but especially in the P, that was clearly separated into an articular layer and a bone layer. T1ρ in the 2 layers was differently correlated with the slope Ki of the bone. As a result, we recommend that the cartilage not be treated as a single region, since several significant clusters were observed locally in the different cartilage compartments (Figures 3 –5). Our method was more sensitive to local changes in the cartilage and therefore early cartilage degeneration together with bone remodeling might provide us with biomarkers for early OA, changes in which may potentially be reversible.
Although the cartilage and bone has been investigated in patients with knee OA, it has never been assessed simultaneously using the voxel-by-voxel-based concept, relating adjoining and distance regions, and focusing on cartilage biochemical degeneration and bone remodeling as early markers of OA. One of the limitations in this study was the relatively small sample size and the broad range of disease severity. However, the results can be used for hypothesis generation for further elucidating the interaction between bone–cartilage, and clearly further studies are warranted, for example in patients with Anterior Cruciate Ligament (ACL) injury who are at risk of getting OA maybe considered to be a good model for studying early OA changes. 42,43
Not only have we shown that increased uptake of [18F]-NaF in the knee OA, but we have also shown that quantitative PET metrics correlate with the semiquantitative (R 2 = .7) metrics consistent with the literature, 34 thus supporting the use of both metrics to characterize bone remodeling. The benefit of the PET-MR scanner is that it saves time and provides a platform to study direct correlations between cartilage degeneration and the dynamic process of bone remodeling providing a better diagnostic tool for the evaluation of OA. If the kinetic PET data in patients with OA are replaceable by the static data, one can save time on the PET imaging and only acquire short sequences, leaving enough time for example to acquire MR of both knees instead of one. The PET-MR technology together with the initial finding of the connection between the bone and the cartilage can help us understand the disease more thoroughly. However, further studies are needed to evaluate these connections.
The development of effective disease-modifying drugs in OA is in progress to define the molecular mechanisms involved in the initiation and progression of OA. The dysregulation in cartilage breakdown and subchondral bone remodeling may be improved by selective inhibitors of matrix metalloproteinases and proteases. 44 Irrespective of what the molecular target might be, if subchondral bone is targeted, or bone–cartilage interactions are to be considered, it will be important to assess these tissue changes in 3 dimensions across the whole joint.
The interactions between the bone and the cartilage highlight the role of biomechanical loading and thus demonstrates linkages between different regions of the entire knee with regard to the early degenerative changes in cartilage, bone remodeling, and lesion formation can be used to not just diagnose but to also monitor and potentially develop therapeutic approaches at an early stage in order to prevent severe OA.
Footnotes
Acknowledgments
The authors like to thank Melissa Guan, Vahid Ravanfar, Dan Vigneron, Anand Venkatachari, Jim Slater, and Nathan Jenkins for their help with this study and for the endless discussions that contributed to this work. The authors acknowledge the funding sources and research grants from GE Healthcare and from National Institutes of Health P50 AR060752.
Declaration of Conflicting Interests
The author(s) declared no potential conflicts of interest with respect to the research, authorship, and/or publication of this article.
Funding
The author(s) disclosed receipt of the following financial support for the research, authorship, and/or publication of this article: This study was funded by GE Healthcare and research grants from National Institutes of Health P50 AR060752.