Cyclodextrins are well-characterized, barrel-shaped molecules that can solubilize organic small molecules in aqueous solution via host–guest interactions. As such, cyclodextrins are used as excipients for experimental therapeutics in vivo. We observed unanticipated modifications to bioluminescence imaging (BLI) signal intensity when 2-hydroxy-propyl-β-cyclodextrin (HPCD) was coinjected as an excipient. We hypothesized that HPCD binds d-luciferin and interferes with the BLI signal. Using luciferase-expressing cell lines, we showed that HPCD lowers the BLI signal in a concentration-dependent manner. Flow cytometry revealed that HPCD resulted in reduced cellular accumulation of d-luciferin, and mass spectrometry revealed d-luciferin HPCD species, confirming a direct interaction. In vivo imaging using a luciferase mouse model demonstrated that HPCD reduced luciferin-mediated BLI compared to luciferin alone. The implications of using HPCD as an excipient in BLI studies are discussed.
Cyclodextrins are a family of biocompatible cyclic oligosaccharides used in the pharmaceutical industry to improve the aqueous solubility of small-molecule therapeutics.1 Cyclodextrins form a barrel shape and display relatively high solubility as the external surface is endowed with hydrophilic hydroxyl groups, whereas the interior is relatively nonpolar, creating a lipophilic cavity.2–4 This interior can act as a “host” for lipophilic “guest” small molecules (or a lipophilic moiety within a small molecule), increasing the apparent solubility of a therapeutic.5 As the host cyclodextrin and guest molecule form a noncovalent association, the inclusion is reversible, allowing “solubilized” drug to be protected from the aqueous environment until it dissociates from the cyclodextrin and diffuses across the membrane.2–4 Cyclodextrin-containing formulations have been approved for prostaglandins and nonsteroidal anti-inflammatory drugs, primarily for parenteral administration, in order to increase bioavailabilty.6–8
We have reported the development of a mouse imaging strategy utilizing the fact that the small molecule d-luciferin is a substrate for the ATP-binding cassette (ABC) transporter ABCG2.9 In a mouse model expressing firefly luciferase in the brain, bioluminescent imaging (BLI) signal is low, as ABCG2 at the blood–brain barrier (BBB) pumps the drug back into the blood. In the presence of small-molecule inhibitors of ABCG2, d-luciferin brain penetrance is elevated and BLI signal increases. A practical challenge of working with third-generation ABC transporter inhibitors is that they are inherently lipophilic and as a result display poor solubility.10 For example, the P-glycoprotein inhibitor tariquidar was formulated for intravenous administration in human clinical trials in a solution containing ethanol and polyethylene glycol (PEG).11 Similarly, the ABCG2 inhibitor Ko143 requires a dimethyl sulfoxide (DMSO)-PEG–saline formulation to enable in vivo studies in mice, an excipient that can produce unwanted toxicities.12
Utilizing the ability of cyclodextrins to solubilize lipophilic molecules demonstrating poor solubility, Zander et al reported the use of the ABCG2 inhibitor Ko143 in a formulation containing 15% w/v 2-hydroxy-propyl-β-cyclodextrin (HPCD)13 to improve solubility. When we tested this formulation as part of a BLI protocol, we observed unexpected changes in BLI signal intensity compared to control mice injected with d-luciferin dissolved in other formulations. It is known that small molecules can compete for binding to cyclodextrins,14–16 and we hypothesized that changes in BLI signal intensity may be due to cyclodextrin complex formation with d-luciferin and that this change in free d-luciferin concentrations leads to possible artifacts in BLI.
For this reason, we examined the effect of HPCD on d-luciferin-mediated bioluminescence in cells transfected with firefly luciferase (fLuc). We then assessed whether lipophilic small-molecule inhibitors of ABC transporters increased cellular bioluminescence by displacement of the luciferin-CD complex. Matrix-assisted laser desorption ionization time-of-flight mass spectrometry (MALDI-TOF MS) analysis of cyclodextrin in the presence of d-luciferin was performed to assess whether the complexation of cyclodextrin and d-luciferin could be detected. Finally, transgenic glial fibrillary acidic protein (GFAP)-fLuc mice were injected with d-luciferin with and without HPCD in order to confirm that cyclodextrins have an effect on d-luciferin intensities. The implications of our observations on BLI experimental design and utilization of cyclodextrins for solubilizing ABC transporter inhibitors are discussed.
Materials and Methods
Chemicals
d-Luciferin was purchased from Gold Biotechnology (St Louis, Missouri). (2 R)-anti-5-f3-[4-(10,11-dichloromethanodibenzo-suber-5-yl)piperazin-1-yl]-2-hydroxypropoxygquinoline trihydrochloride (DCPQ) was provided by Victor W. Pike (National Institutes of Mental Health, Bethesda, Maryland). Nilotinib and gefitinib were purchased from Cayman Chemical (Ann Arbor, Michigan). Ko143 was purchased from Tocris Bioscience (Bristol, United Kingdom). Tariquidar was purchased from Celon Labs (Hyderabad, India). All other chemicals were purchased from Sigma-Aldrich (St Louis, Missouri) unless stated otherwise. Stock solutions of inhibitors were prepared in DMSO, while d-luciferin and HPCD were prepared in phosphate-buffered saline (PBS).
Cell Lines
Human embryonic kidney (HEK)/empty/fLuc cells transfected with firefly luciferase were provided by Martin G. Pomper (Johns Hopkins Medical Institutions, Baltimore, Maryland) and were grown in minimum essential medium (Life Technologies, Carlsbad, California) supplemented with 1 mg/mL G418 and 100 μg/mL hygromycin B. KB-3-1 cells were grown in Dulbecco-modified Eagle medium.17 All media were supplemented with 10% fetal bovine serum (Gibco, Grand Island, NY), penicillin/streptomycin, and 2 mmol/L glutamine. All cell lines were grown in an incubator at 37°C in 5% CO218 and subcultured utilizing a 0.25% trypsin, 0.9 mmol/L EDTA solution and were used for experiments between passages 4 and 20.
In Vitro Bioluminescence Assay
Cells were plated at a density of 10 000 cells/well in 96-well opaque plates (BD-Falcon, San Jose, CA) and incubated for 24 to 48 hours in a 37°C incubator. Medium was then aspirated and depending on the experiment, luciferin, HPCD, tariquidar, elacridar, gefitinib, Ko143, DCPQ, or nilotinib was added. Plates were returned to the incubator for 10 minutes, after which bioluminescence was measured using a Tecan Infinite M200 Pro (Männedorf, Switzerland) plate reader.
Flow Cytometry
Cellular accumulation of d-luciferin was measured with an LSR II flow cytometer (BD Biosciences, San Jose, California). For each experimental condition, 5 × 10⁵ cells were suspended in PBS. Cells were incubated in the dark at 37°C for 45 minutes with d-luciferin (108 μmol/L). At that point, ice-cold PBS was added and the samples centrifuged with the supernatant discarded. Cells were resuspended in ice-cold PBS and kept on ice until flow cytometry analysis (<1 hour). Cells were gated for forward versus side scatter, and the geometric mean of fluorescence intensity of d-luciferin was measured for 20 000 events, using excitation at 355 nm and emission at 530 nm. Fluorescence-activated cellular sorting data were analyzed using FlowJo software (Tree Star, Inc, Ashland, Oregon).
Mass Spectrometry
The mass of cyclodextrin free or in the presence of d-luciferin was determined by MALDI-TOF MS on a MALDI micro MX (Waters, Milford, Massachusetts). Compounds were diluted 1:1 in α-cyano-4-hydroxycinnamic acid and analyzed using positive reflectron mode.
Animals
The FVB/N-Tg (GFAP-fLuc)-Xen mouse model (Taconic Farms) is a transgenic mouse line that carries the fLuc gene under the transcriptional control of the mouse GFAP promoter.19 Basal expression of the reporter is observed primarily in the brain. Animal experiments were performed in accordance with the Guide for Care and Use of Laboratory Animals20 and were approved by the National Cancer Institute Animal Care and Use Committee.
Formulations for Mice
d-Luciferin solutions were prepared in sterile normal saline at a concentration of 4.5 mg/mL and stored at −20°C. A dosage of 18 mg/kg d-luciferin was utilized, as it provided a low baseline signal from the brain. The HPCD solutions were prepared at a concentration of 15% (w/v) in PBS and sterilized through a 0.22 μmol/L filter.
In Vivo Bioluminescence
Animals were anesthetized with isoflurane (4% induction, 1.5% maintenance) in O2 for the duration of the procedure. Bioluminescent signals were detected using an IVIS100 imager (Perkin Elmer, Waltham, Massachusetts). All drug conditions were injected intraperitoneally (IP), after which animals were imaged for 60 minutes in the supine position. Images were captured in a sequence with 30-second exposure every 60 seconds. The BLI data were analyzed using LivingImage software (PerkinElmer) with the same region of interest (ROI) around the cranium used for the entire sequence. Background subtraction was applied to each data point.
Statistical Analysis
Statistical analysis was done using Graphpad Prism 6.0 (La Jolla, California). Mean values ± SD were analyzed with a 2-tailed, unpaired t test, with statistical significance defined as P < .05.
Results
HPCD Attenuates Bioluminescence In Vitro
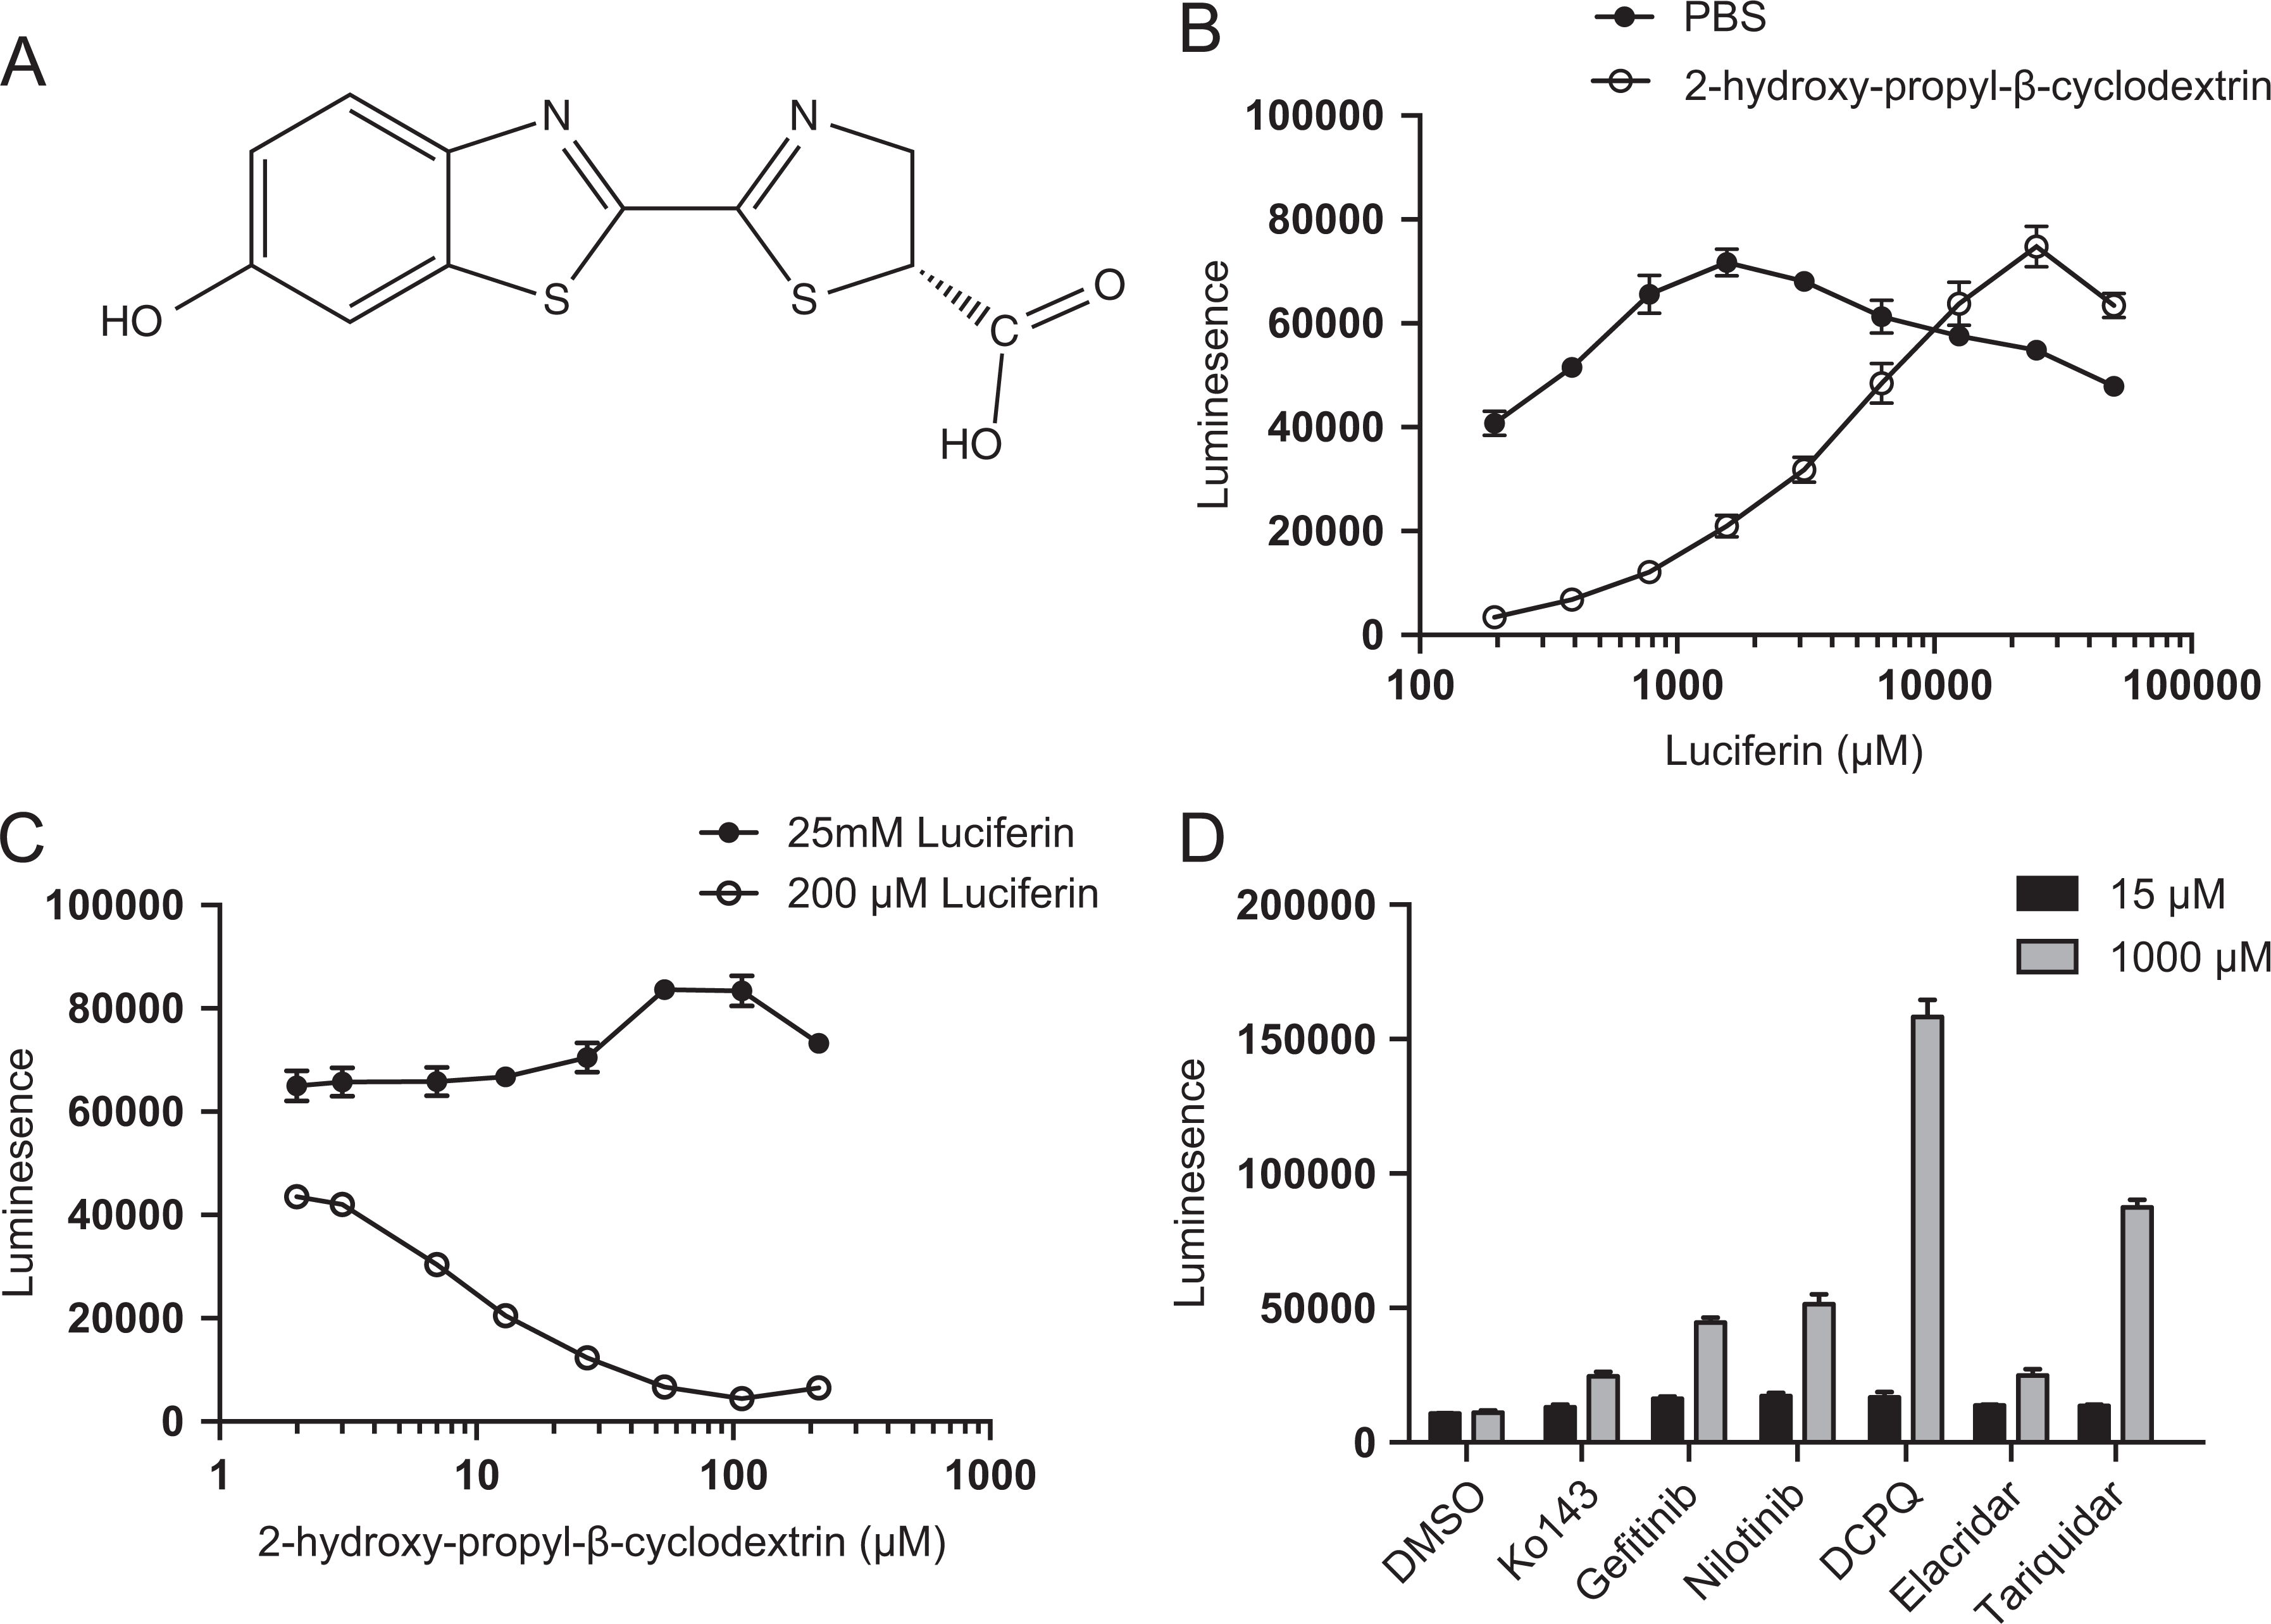
We first examined the interaction of HPCD (structure shown in Figure 1A) with d-luciferin. Increasing concentrations of d-luciferin dissolved in either 15% HPCD or PBS were incubated with HEK 293 cells expressing fLuc (Figure 1B). Bioluminescence was 12-fold lower in cells when 200 µmol/L d-luciferin was dissolved in HPCD solution compared to PBS solution. The BLI signal was maximal with 1.5 mmol/L d-luciferin in PBS, but higher d-luciferin concentrations were needed in the presence of HPCD to reach similar intensity levels to PBS-dissolved d-luciferin. We next varied HPCD concentration with a constant high (25 mmol/L) or low (200 μmol/L) concentration of d-luciferin (Figure 1C). While bioluminescence arising from the high 25 mmol/L concentration of d-luciferin was not affected by any concentration of HPCD, the lower 200 μmol/L concentration demonstrated attenuation of signal at 7 μmol/L of HPCD (1% HPCD) and was almost completely abrogated at 108 μmol/L HPCD (15% HPCD).
Cyclodextrin attenuates bioluminescence in vitro. A, Structure of d-luciferin. B, Bioluminescence from HEK firefly luciferase (fLuc) cells incubated with vehicle (PBS) or 15% HPCD and increasing concentrations of d-luciferin. C, Bioluminescence from HEK fLuc cells incubated with 25 mmol/L or 200 μmol/L luciferin and increasing concentrations (μmol/L) of HPCD. D, To study the binding effects of commonly used ATP-binding cassette (ABC) transporter inhibitors, HEK fLuc cells were incubated with constant luciferin (100 μmol/L) and HPCD (108 μmol/L) in the presence of 15 or 1000 μmol/L tariquidar, elacridar, Ko143, gefitinib, nilotinib, and (2 R)-anti-5-f3-[4-(10,11-dichloromethanodibenzo-suber-5-yl)piperazin-1-yl]-2-hydroxypropoxygquinoline trihydrochloride (DCPQ). Data represent mean ± standard deviation (SD) of at least 3 separate observations.
We had hypothesized that our observed reduction in bioluminescence signal in animals was due to the complexation of d-luciferin with HPCD. To address this directly, we prepared solutions of HPCD in the absence and presence of d-luciferin and examined them by MALDI-TOF MS. The HPCD solution revealed a maximal peak at 1512 Da, with adjacent peaks separated by 58 Da, corresponding to 2-hydroxyl propyl groups on HPCD. In the presence of d-luciferin, low-intensity peaks corresponding to an increase of 280 Da, the mass of d-luciferin, were observed (Figure 2). Each HPCD peak was also accompanied by an increase of 16 Da, consistent with HPCD oxidation.
Mass spectra demonstrating covalent modification of cyclodextrin by luciferin. The top panel shows the mass spectrum of cyclodextrin alone, and the bottom panel shows the mass spectrum following incubation of cyclodextrin with luciferin. Shifted masses that correspond to the addition of luciferin are indicated with dashed lines in the lower panel. These masses are not observed in cyclodextrin alone as shown by the absence of signals at the positions with the dashes in the upper panel.
Binding of HPCD to d-Luciferin
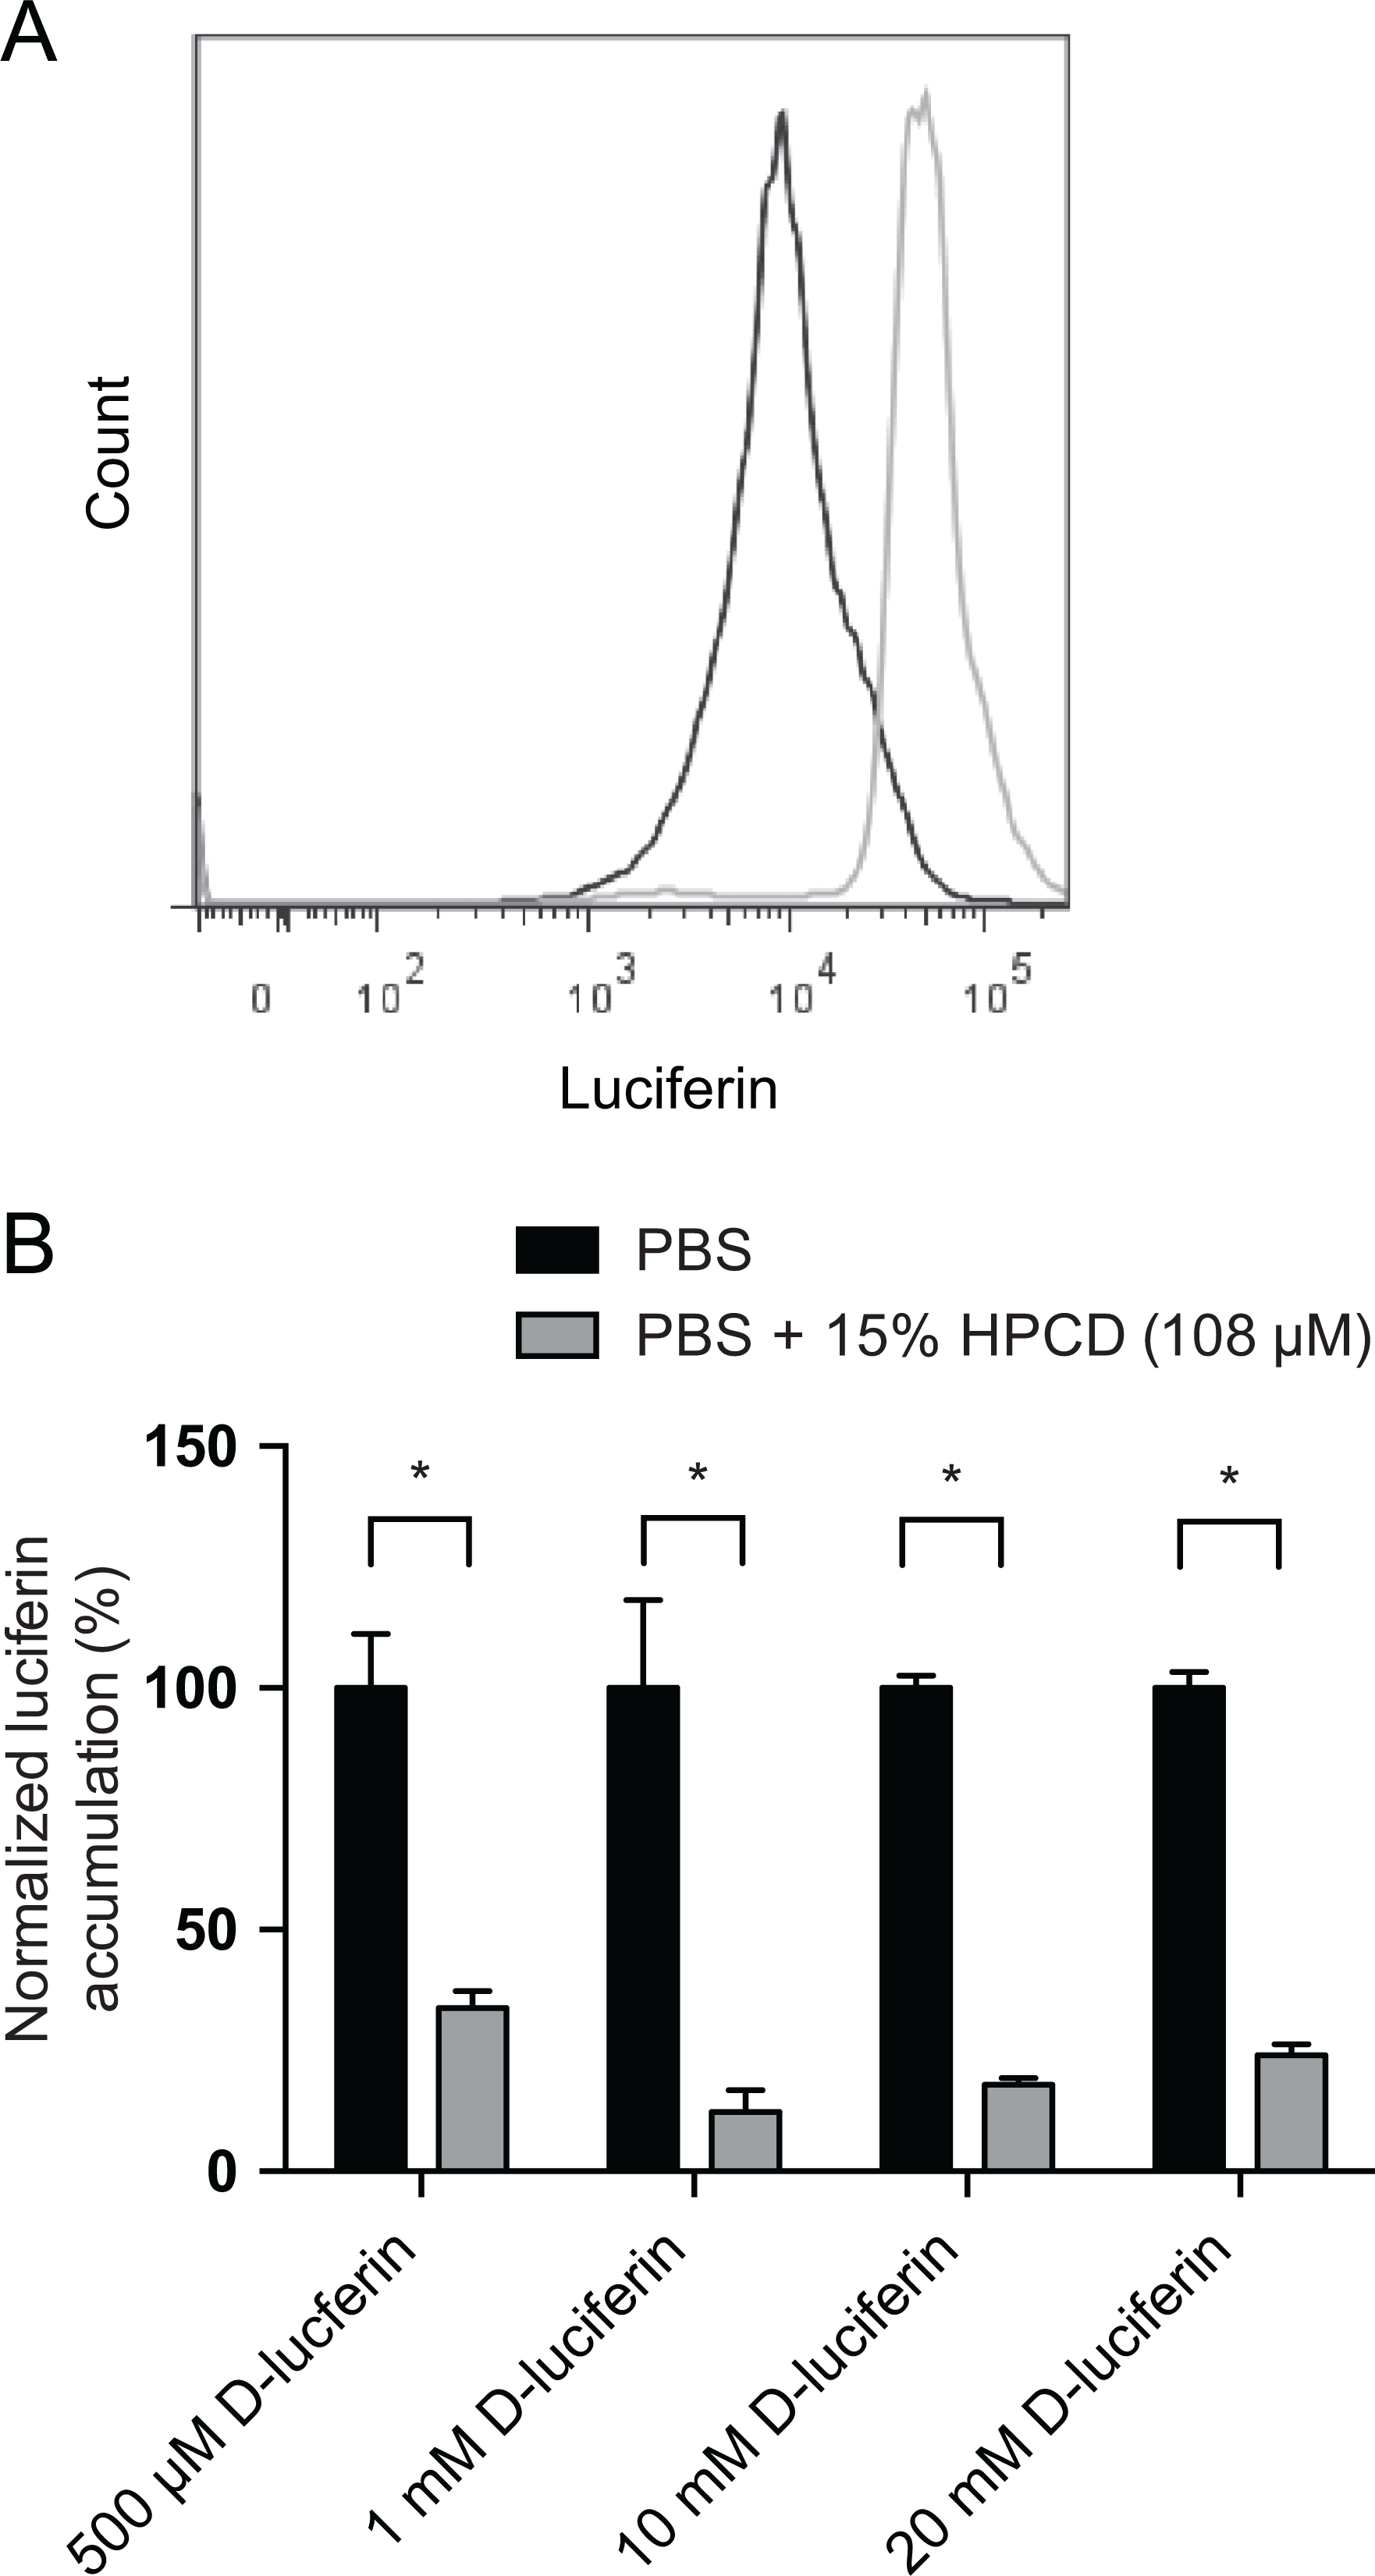
To directly assess whether the interaction between HPCD and d-luciferin was responsible for reducing cellular levels of d-luciferin, and was therefore responsible for lower cellular BLI signal, we used flow cytometry. Cells were incubated with several concentrations of d-luciferin in the presence of 15% (108 µmol/L) HPCD or PBS. Cells (KB 3-1) were then analyzed by flow cytometry, utilizing d-luciferin’s inherent fluorescence properties (excitation = 350 nm and emission = 530 nm)21 to directly measure cellular d-luciferin accumulation. Cells accumulated relatively high levels of d-luciferin (gray, Figure 3A), whereas cellular fluorescence levels were lowered by the presence of HPCD (black, Figure 3A). Quantitation of flow cytometry data demonstrated that HPCD-treated cells showed decreased accumulation of d-luciferin at all concentrations tested (Figure 3B).
2-hydroxy-propyl-β-cyclodextrin (HPCD) decreases cellular d-luciferin accumulation in vitro. A, Flow cytometry histograms showing d-luciferin accumulation in KB-3-1 cells in the absence (gray) and presence (black) of 15% HPCD. B, Quantification of d-luciferin accumulation at concentrations of 500 μmol/L, 1 mmol/L, 10 mmol/L, and 20 mmol/L were measured with and without 108 μmol/L of HPCD by flow cytometry. Data represent mean ± standard deviation (SD) of at least 3 separate observations (*P ≤ .001)
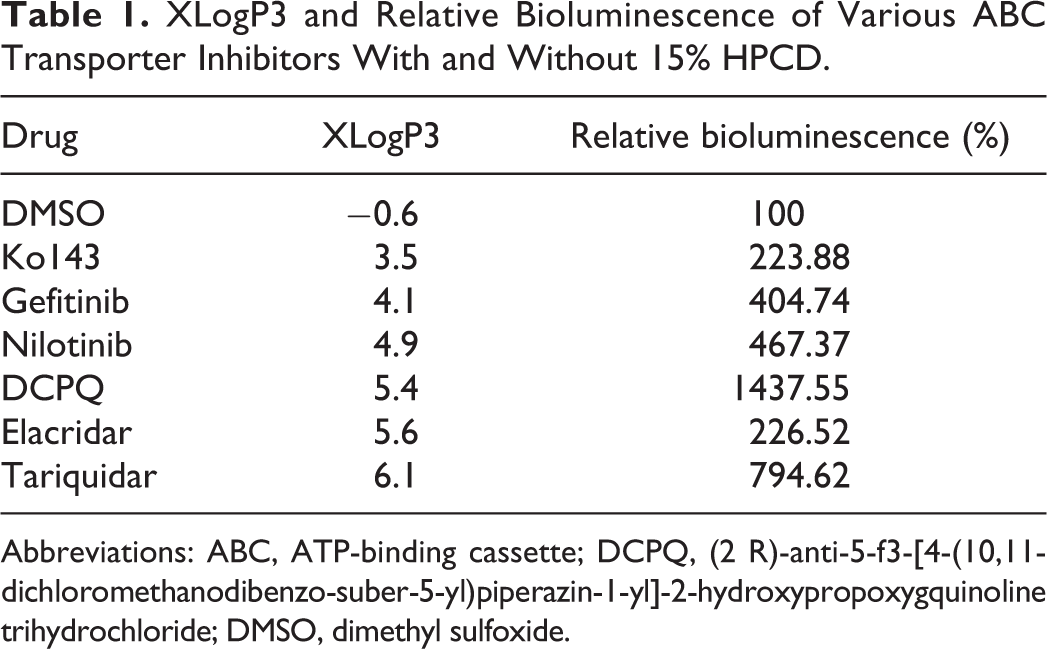
Given that d-luciferin binds to HPCD, we sought to determine the effect of commonly used ABC transport inhibitors on the interaction of d-luciferin and HPCD, specifically whether the inhibitors could compete for HPCD binding and elevate free d-luciferin levels. The HEK fLuc cells were incubated with increasing concentrations of each inhibitor or DMSO control, in the presence of d-luciferin (1 mmol/L) and HPCD (108 μmol/L). All inhibitors resulted in an increase in bioluminescence, with tariquidar and DCPQ eliciting the strongest increase in signal (Figure 1D). A general (but not statistically significant) trend could be observed between increasing lipophilicity (xLogP3) of the inhibitor and greater displacement of d-luciferin from HPCD (Table 1).
XLogP3 and Relative Bioluminescence of Various ABC Transporter Inhibitors With and Without 15% HPCD.
To understand the implications of the HPCD–d-luciferin interaction in vivo, we utilized a mouse model expressing fLuc behind the GFAP promoter to measure the BLI brain signal produced. When mice were injected intraperitoneally (IP) with d-luciferin immediately followed by 15% HPCD solution, there was a dramatic decrease in signal over 60 minutes compared to d-luciferin followed immediately by PBS control (Figure 4A). When a solution of 15% HPCD was premixed with d-luciferin prior to injection (green, Figure 4A), the effect was even more pronounced. The area under the time–activity curve (AUC) revealed a significant decrease in signal for the HPCD-treated animals for both sequentially injected and the premixed solution compared to PBS, respectively (2119 ± 388, 1106.1 ± 119, and 4596 ± 579, P < .01; Figure 4B, images shown in 4C).
Cyclodextrin decreases bioluminescence in vivo. A, Time activity curves of bioluminescence from GFAP-firefly luciferase (fLuc) mice injected with 18 mg/kg d-luciferin and phosphate-buffered saline (PBS), or 15% 2-hydroxy-propyl-β-cyclodextrin (HPCD), or a premixed solution of 15% HPCD /d-Luciferin. B, Area under the curve analysis of the time activity curves in (A). Data were normalized to the maximum total flux (photons/sec) from the PBS-treated animal and represent mean ± standard deviation (SD) of at least 4 different experiments. C, Representative bioluminescent images of the GFAP-fLuc mice showing (from left to right) GFAP-fLuc mice injected with 18 mg/kg d-luciferin in PBS, or 15% HPCD, or a premixed solution of 15% HPCD. Brain signal arises from the ears in individual images.9,22
Discussion
The aim of this study was to examine a potential interaction between d-luciferin and HPCD, based on what we observed incidentally as part of testing formulations for an experimental therapeutic inhibitor of ABCG2. Utilizing in vitro model systems, we demonstrated that HPCD has a concentration-dependent effect on accumulation of d-luciferin in cells, causing a decrease in bioluminescence. The BLI signal attenuation was also shown in animals coadministered with d-luciferin and HPCD as part of drug formulations. We further show that various ABC transporter inhibitors can displace d-luciferin from HPCD, increasing BLI signal.
d-luciferin and luciferase have been utilized extensively in biomedical research as a gene reporter system and to measure tumor burden in animals.23,24 We recently reported that d-luciferin is a specific substrate for the ABC transporter ABCG2 at the BBB and that pharmacological inhibition of this transporter results in increased BLI intensity in the brain.9 As we worked to expand this model to image pathologies in the brain, more facile and less toxic excipients were needed to deliver the ABCG2 transport inhibitor Ko143. Zander et al reported the use of IP injections of Ko143 dissolved in a 15% solution of HPCD as an adjuvant to increase cellular accumulation of the ABCG2 substrate topotecan in ABCG2-positive tumors.13 When we used this formulation in our mice, we noticed an unanticipated decrease of BLI signal in the Ko143 (15% HPCD)-treated animals compared to PBS control mice coadminstered with d-luciferin. We were intrigued to note that in vivo bioluminescent signal slowly increases over the entire time course observed in the mice injected with luciferin immediately followed by HPCD, whereas premixed luciferin/HPCD produced an enduring but low signal as anticipated based on results. We speculate that the increase in signal over time is due to a complex equilibrium involving rapid binding and slow release of luciferin.
In vitro results confirm that HPCD affects BLI signal in a dose-dependent manner, with higher d-luciferin concentrations required to overcome the effect of HPCD. By measuring d-luciferin using flow cytometry, we directly showed that by binding to d-luciferin, HPCD lowers the cellular accumulation of d-luciferin. Finally, using MS, we were able to show the complexation product of d-luciferin with HPCD. The in vivo experiments mirrored the in vitro results, and we demonstrated signal attenuation when mice were coinjected with HPCD. These results demonstrate a clear effect of HPCD on the ability of d-luciferin to distribute and metabolize into luminescence. We also demonstrated that a variety of experimental therapeutic ABC transporter inhibitors interact with HPCD and displace d-luciferin, elevating the BLI signal.
To our knowledge, the impact of cyclodextrins on d-luciferin has not been previously reported in the literature. The implication is important, as the effect could serve to produce false negative and false positive results; negative when HPCD binds d-luciferin and artificially lowers signal, and positive when displacement of d-luciferin by a coadministered drug liberates d-luciferin and artificially elevates signal. For example, in the context of ABC transporter inhibition experiments in the BBB model reported by us, when an inhibitor formulated with HPCD is injected, it results in an increase in the free d-luciferin in plasma compared with the HPCD vehicle control. This would result in elevated BLI signal caused by the HPCD interaction, rather than by ABC transporter inhibition.
To be clear, we did not use HPCD in our report but have subsequently contemplated its use and, as a result of the findings presented here, have decided against it. The use of multiple controls would normally be expected to allow the experimenter to be vigilant to unanticipated changes, but in the scenario described here, the anticipated elevated signal would satisfy the hypothesis of transporter inhibition. The use of cyclodextrins when conducting bioluminescence-based imaging protocols should be well controlled to ensure changes in BLI correspond to the experimental design.
Footnotes
Acknowledgment
We thank George Leiman for editorial assistance.
Declaration of Conflicting Interests
The author(s) declared no potential conflicts of interest with respect to the research, authorship, and/or publication of this article.
Funding
The author(s) disclosed receipt of the following financial support for the research, authorship, and/or publication of this article: This research was funded by the Intramural Research Program of the National Institutes of Health, the National Cancer Institute.
References
1.
ChallaRAhujaAAliJ. Cyclodextrins in drug delivery: an updated review. AAPS PharmSciTech. 2005;6:E329–E357.
2.
CriniG. Review: a history of cyclodextrins. Chem Rev. 2014;114(21):10940–10975.
3.
DavisMEBrewsterME. Cyclodextrin-based pharmaceutics: past, present and future. Nat Rev Drug Discov. 2004;3(12):1023–1035.
4.
Laza-KnoerrALGrefRCouvreurP. Cyclodextrins for drug delivery. J Drug Target. 2010;18(9):645–656.
5.
RawatSJainSK. Solubility enhancement of celecoxib using beta-cyclodextrin inclusion complexes. Eur J Pharm Biopharm. 2004;57(2):263–267.
6.
CarrierRLMillerLAAhmedI. The utility of cyclodextrins for enhancing oral bioavailability. J Control Release. 2007;123(2):78–99.
7.
ChellyJESinglaSKMelsonTI. Safety of a novel parenteral formulation of diclofenac after major orthopedic or abdominal/pelvic surgery in a population including anticoagulated, elderly or renally insufficient patients: an open-label, multiday, repeated dose clinical trial. Pain Med. 2013;14(5):749–761.
8.
UekamaKHiedaYHirayamaF. Stabilizing and solubilizing effects of sulfobutyl ether beta-cyclodextrin on prostaglandin E1 analogue. Pharm Res. 2001;18(11):1578–1585.
9.
BakhsheshianJWeiBRChangKE. Bioluminescent imaging of drug efflux at the blood-brain barrier mediated by the transporter ABCG2. Proc Natl Acad Sci U S A. 2013;110(58):20801–20806.
10.
DarbyRACallaghanRMcMahonRM. P-glycoprotein inhibition: the past, the present and the future. Curr Drug Metab. 2011;12(8):722–731.
11.
FoxEBatesSE. Tariquidar (XR9576): a P-glycoprotein drug efflux pump inhibitor. Expert Rev Anticancer Ther. 2007;7(4):447–459.
12.
SaneRAgarwalSMittapalliRK. Saturable active efflux by p-glycoprotein and breast cancer resistance protein at the blood-brain barrier leads to nonlinear distribution of elacridar to the central nervous system. J Pharmacol Exp Ther. 2013;345(1):111–124.
CominiSOlivierPRiottotM. Interaction of beta-cyclodextrin with bile acids and their competition with vitamins A and D3 as determined by 1H-NMR spectrometry. Clin Chim Acta. 1994;228(2):181–194.
15.
StellaVJRaoVMZannouEA. Mechanisms of drug release from cyclodextrin complexes. Adv Drug Deliv Rev. 1999;36(1):3–16.
16.
TokumuraTNanbaMTsushimaY. Enhancement of bioavailability of cinnarizine from its beta-cyclodextrin complex on oral administration with DL-phenylalanine as a competing agent. J Pharm Sci. 1986;75(4):391–394.
17.
CornwellMMGottesmanMMPastanIH. Increased vinblastine binding to membrane vesicles from multidrug-resistant KB cells. J Biol Chem. 1986;261(17):7921–7928.
18.
ZhangYByunYRenYR. Identification of inhibitors of ABCG2 by a bioluminescence imaging-based high-throughput assay. Cancer Res. 2009;69(14):5867–5875.
19.
ZhuLRambozSHewittD. Non-invasive imaging of GFAP expression after neuronal damage in mice. Neurosci Lett. 2004;367(2):210–212.
20.
Health NIo. Guide for the Care and Use of Laboratory Animals, 8th Ed. Washington, DC: The National Academies Press; 2001.
21.
BowieLJ. Synthesis of firefly luciferin and structural analogs. Method Enzymol. 1978;57:15–28.
22.
LeeJBorboaAKBairdA. Non-invasive quantification of brain tumor-induced astrogliosis. BMC Neurosci. 2011;12:9.
23.
EdingerMCaoYAHornigYS. Advancing animal models of neoplasia through in vivo bioluminescence imaging. Eur J Cancer. 2002;38(16):2128–2136.
24.
SatoAKlaunbergBTolwaniR. In vivo bioluminescence imaging. Comp Med. 2004;54(6):631–634.