
Abstract
Introduction:
In this study, the influence of physiological determinants on 18F-fluoro-
Materials and Methods:
TASTPM (Tg) and age-matched C57BL/6 J (WT) mice were fasted for 10 hours, while another group was fasted for 20 hours to evaluate the effect of fasting duration. The effect of repeatedly scanning was evaluated by scanning Tg and WT mice at days 1, 4, and 7. Brain 18F-FDG uptake was evaluated in the thalamus being the most indicative region. Finally, the cerebellum was tested as a reference region for the relative standard uptake value (rSUV).
Results:
When correcting the brain uptake for glucose, the effect of different fasting durations was attenuated and the anticipated hypometabolism in Tg mice was demonstrated. Also, with repeated scanning, the brain uptake values within a group and the hypometabolism of the Tg mice only remained stable over time when glucose correction was applied. Finally, hypometabolism was also observed in the cerebellum, yielding artificially higher rSUV values for Tg mice.
Conclusion:
Corrections for blood glucose levels have to be applied when semiquantifying 18F-FDG brain uptake in mouse models for AD. Potential reference regions for normalization should be thoroughly investigated to ensure that they are not pathologically affected also by afferent connections.
Introduction
Positron emission tomography (PET) is a noninvasive imaging technique that permits in vivo monitoring of physiological and pathological processes.
1
A common PET radiotracer frequently employed in clinical and preclinical studies is 2-deoxy-2-18F-fluoro-
It is therefore important that these 18F-FDG imaging protocols are standardized eliminating confounding factors, as these can potentially alter the outcome of the experiment. Most 18F-FDG imaging studies, including those in imaging for AD, make use of semiquantitative measures: the percentage of injected dose (%ID/g) or the standard uptake value (SUV), thereby eliminating the need for long scan durations or invasive catheterization to obtain the plasma input function required for absolute quantification. The %ID/g represents the ratio of tissue uptake and the injected dose, while SUV additionally normalizes the %ID/g by the body weight of each individual animal. Without a standardized protocol, these measures can be biased by confounding factors both in humans 21,22 and in small animals. 23 There have been several comprehensive studies investigating potential influencing factors such as blood glucose levels, 20,24,25 the administration route, 20 fasting, 20,23,24 anesthesia, 23,26 -29 body temperature, 23 and stress. 24,30 -32 Most of these influence 18F-FDG uptake by directly changing the blood glucose levels or by altering the glucose need. The glucose need, and thus the 18F-FDG uptake, will be lower with higher endogenous glucose levels. Stress (ie, corticosterone) and anesthesia such as isoflurane and ketamine cause endogenous glucose levels to increase. Fasting on the other hand lowers endogenous glucose levels. A low body temperature will cause a higher glucose need and thus higher 18F-FDG uptake in the brown fat tissue.
In this study, we use double transgenic TASTPM mice 33 as our experimental model of cerebral amyloidosis, as these mice have been reported to demonstrate cerebral hypometabolism with increasing age by both ex vivo 34 and in vivo measurements. 35,36 We aim to quantify the possible confounding effects of fasting duration, repeatedly scanning, and a normalization method on the differential 18F-FDG brain uptake in these TASTPM (transgenic, Tg) mice versus wild-type (WT) littermate controls. In particular, we search for the best approach to normalize for physiological determinants such as glucose and body weight.
Materials and Methods
Animals
TASTPM mice overexpress the hAPP695swe mutation and the presenilin-1 M146 V mutation under the control of the neuron-specific Thy-1 promoter. These mice display accelerated amyloid deposition with plaques forming as early as 3 months. The cerebral Aβ 1-42 load is greater and results in the formation of dense core amyloid plaques. 37 Age-matched C57BL/6 J littermates were used as controls (WT). Mice (n = 25 Tg; n = 26 WT, male) were 14.29 ± 0.76 (standard deviation) months of age and were treated in accordance with the European Ethics Committee (decree 86/609/CEE). The study protocol was approved by the local Animal Experimental Ethical Committee of the University of Antwerp, Belgium (2012-25). The animals were kept under environmentally controlled conditions (12-hour light–dark cycle, 20°C-24°C and 40%-70% relative humidity) in individually ventilated cages with food (ssniff R/M-H; Bio Services, the Netherlands) and water ad libitum. The animals were housed in type M3 cages with 1 male animal per cage and received environmental enrichment. TASTPM animals and their littermate controls were received in kind from GlaxoSmithKline (Stevanage, United Kingdom) through the PharmaCog consortium.
Radiosynthesis of 18F-FDG
The 18F-FDG was synthesized using a cassette-based GE Fastlab synthesis module (GE Healthcare, Belgium). 18F-fluoride was produced by bombarding 18O-enriched water using a 11-MeV proton beam in an Eclips HP cyclotron (Siemens, Knoxville, Tennessee). The purified 18F-FDG was then diluted with 0.9% NaCl (Baxter, Belgium) and sterile filtered through a 0.22 µmol/L filter. Quality control was performed according to European Pharmacopoeia 7.1. Radiochemical identity was confirmed by high-performance liquid chromatography (HPLC; Dionex; ThermoFisher, Belgium) and radio thin-layer chromatography. Radiochemical purity was determined by HPLC (Dionex, ThermoFisher, Belgium) and ranged from a minimum of 99.56% to a maximum of 99.97%. Radionuclidic identity and purity were confirmed by gamma spectrum analysis (Multi-channel analyzer, Canberra).
Image Acquisition and Processing Protocols
Based on the protocol previously used in TASTPM mice, 35 the animals were injected awake with an intravenous tail vein injection of 18.5 MBq of 18F-FDG in a solution of 0.2 mL. Static µPET scans of 20 minutes were acquired after a conscious uptake period of 45 minutes. Anesthesia was induced by inhalation of isoflurane (5% for induction and 2% for maintenance during preparation and scanning) supplemented with oxygen. Respiration rate and body temperature of the animal were constantly monitored (BioVet, USA) during the entire scanning period. The core body temperature of the animals was maintained via a temperature controlled heating pad.
The PET imaging was performed using 2 Siemens Inveon PET-CT scanners (Siemens Preclinical Solution, Knoxville, Tennessee). 38 The scanner utilizes 1.59 × 1.59 × 10 mm lutetium oxy-orthosilicate crystals grouped in 20 × 20 blocks. The axial and transaxial field of views are 127 and 100 mm, respectively. The animals were scanned in a feet-first-prone position. The energy and timing window were set to 350 to 650 keV and 3.432 nseconds, respectively. The PET images were reconstructed using 4 iterations with 16 subsets of the 2-dimensional ordered subset expectation maximization (OSEM 2D) 39 algorithm following Fourier rebinning (FORE). 40 Normalization, dead time, random, CT-based attenuation and single-scatter simulation (SSS) scatter corrections 41 are applied. The PET images are reconstructed on a 128 × 128 × 159 grid with a pixel size of 0.776 mm and a slice thickness of 0.796 mm. The CT imaging was done using a 220° rotation with 120 rotation steps. Voltage and amperage are set to 80 keV and 500 μA, respectively. The CT images were reconstructed using the Feldkamp filtered-backprojection algorithm.
Each individual PET image was transformed into the space of a standard FDG PET template 42 using brain normalization in PMOD v3.3 (PMOD Technologies, Switzerland). These spatially normalized images were then analyzed using an magnetic resonance imaging mouse whole brain volume-of-interest (VOI) template 43 available in the same software package and a priori coregistered with the FDG PET template. As the scanner was calibrated using a uniform cylinder of activity, whole brain VOI statistics in kBq/cm3 are generated and used to calculate different quantification methods: the percentage of injected dose per gram (%ID/g = 100 × radioactivity concentration in VOI/injected radioactivity) and the SUV (=%ID/g × body weight) without and with (%ID/gglc = %ID/g × glc and SUVglc = SUV × glc) correction for the blood glucose level.
Study Design
In order to design a robust and reproducible imaging protocol, we investigated the effect of fasting duration and of repeatedly scanning as physiological determinants for quantification. Also, we evaluated relative SUV (rSUV) as a methodological determinant for normalization of regional uptake values to a reference region.
The effects of prolonged fasting
TASTPM (n = 13) and age-matched (15 ± 0.02 months) littermate WT mice (n = 14) were divided into 2 groups of different fasting duration. One group (WT n = 7, Tg n = 6) was fasted for 10.41 ± 0.35 (standard error of the mean, SEM) hours and the other group (WT n = 7, Tg n = 7) for 19.77 ± 0.01 (SEM) hours. Baseline and prescan whole blood glucose (mg/dL) were measured (in duplo; One Touch Ultra 2, Lifescan, France) as well as body weight. As the thalamus has been previously shown to demonstrate the most significant decreases in glucose utilization, 34,35 we selected it as a representative hypometabolic region for our investigations.
The effects of repeatedly scanning
A subset of mice, TASTPM (n = 6) and age-matched littermates (n = 7; 15 ± 0.02 months), used in the prolonged fasting experiment (the 10 h fasting group) was scanned 3 consecutive times at day 1, 4, and 7 resulting in an interscan duration of 2 days (Figure 1). Baseline and prescan whole blood glucose was measured and 18F-FDG uptake was evaluated in the thalamus as described earlier.

Experimental design to investigate the confounding effects of repeatedly scanning on 18F-fluoro-
The effects of a reference region
TASTPM (n = 12) and age-matched (13.5 ± 0.02 months) littermates WT (n = 12) mice were scanned with 18F-FDG after fasting for 10.45 ± 0.25 (SEM) hours. Prescan whole blood glucose and body weight were measured. Here, the rSUV was additionally calculated as a normalization method in addition to the employed quantification measures in the previous experiments (The effects of prolonged fasting and The effects of repeatedly scanning sections). The cerebellum was chosen as the reference region, as it is generally devoid of amyloid plaques. Brain 18F-FDG uptake was evaluated in the striatum, cortex, hippocampus, thalamus, cerebellum, basal forebrain and septum, hypothalamus, amygdala, brain stem, cingulate cortex, superior colliculi, midbrain, and inferior colliculi.
Statistical Analysis
Data were analyzed using SPSS v23 and GraphPad Prism 6.0b (GraphPad Software Inc, San Diego, California) and presented as mean ± SEM. After verifying the normality and the homoscedasticity of the data using, respectively, the Shapiro-Wilk test and the Levene test, parameteric tests were used. A Student (2-tailed, unpaired) t test was performed to compare the tracer uptake between Tg and WT animals. Repeated measure analysis of variance was performed to test the glucose level differences over time in the effects of repeatedly scanning experiment.
Results
Glucose Correction is Mandatory if Duration of Fasting Varies
Baseline glucose levels are lower for the Tg mice than for WT as shown in Figure 2A as an inherent genotype effect (significant depending on group allocations). Both fasting durations (10.41 ± 0.35 and 19.77 ± 0.01 hours, respectively) induced substantial reductions in scan blood glucose after fasting as shown in Figure 2B. For those animals that were fasted only for 10.41 ± 0.35 hours, the differences between Tg and WT persisted with transgenic animals still exhibiting lower blood glucose levels albeit not significant. Blood glucose levels were comparable between genotypes for those animals that were fasted longer. Figure 2C shows that also the baseline body weights are lower for the Tg mice than for WT as an inherent genotype effect (significant depending on group allocations). Figure 2D demonstrates that this lower body weight for the Tg compared to WT remains after fasting for both fasting durations. The loss in body weights of all mice decreased after fasting within a range of minimum 5.70% and maximum 14.68% body weight.

Whole blood glucose levels and body weights measured at the baseline (A and C respectively) and before the scan (B and D respectively) of the WT and Tg mice for the different fasting durations (*P < .05; **P < .01).
Without a correction for varying blood glucose levels as for %ID/g and SUV, a significantly higher uptake in the 20-hour fasting group is measured not necessarily representing an intrinsically higher cerebral metabolism but rather due to less competing endogenous glucose as exemplified in Figure 3 for the thalamus. This artificial difference in uptake was adequately attenuated with glucose correction as demonstrated for %ID/gglc and SUVglc. Further, Figure 3 also shows that for these latter 2 glucose-corrected measures, a trend toward the anticipated hypometabolism 35,36 is demonstrated for both fasting durations and is significant for the Tg animals in the 20-hour group if measured with SUVglc. Noteworthy is that SUVglc is known to be a linear overcorrection for nonlinear 18F-FDG brain uptake 44 when body weight differs significantly (Figure 2D). Importantly, if not correcting for body weight and blood glucose (using %ID/g), the reported hypometabolism 35,36 can be misinterpreted as hypermetabolism for the group of animals fasted for 10 hours, as these are displaying a trend toward higher uptake for the thalamus. Figure 4 strikingly illustrates the impact of the physiological determinants on the average group images with SUVglc and %ID/gglc demonstrating the lowest variability if fasting durations varies for both WT and Tg animals, and SUVglc and %ID/gglc also confirming the expected hypometabolism of Tg versus WT animals, 35,36 for both fasting durations with a linear overcorrection for SUVglc (see Figure 2D).
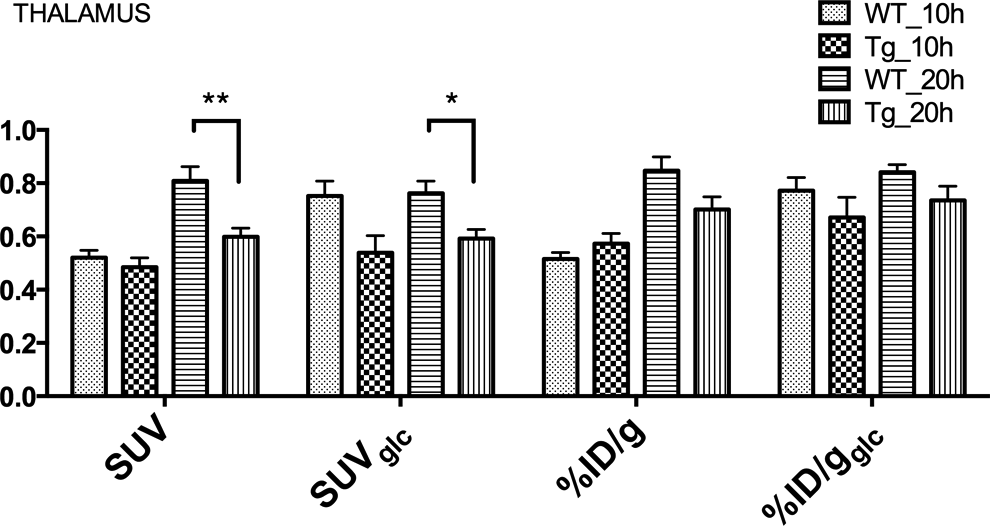
Overview of the different quantification methods in the WT and Tg mice for the 10 hours and 20 hours fasting durations. Uptake is measured in the thalamus (THA; *P < .05; **P < .01). Significance between 10- and 20 hours of fasting is not plotted for clarity.

Semiquantitative measures standard uptake value (SUV), SUVglc, percent injected dose (%ID/g), %ID/gglc expressed as average brain images of the WT and Tg mice for the 10- and 20-hour fasting durations.
Glucose Correction Accounts for the Effect of Repeated Scanning
In comparison to the baseline whole blood glucose levels, initial exposure to fasting for the first scan session (scan 1) induced a substantial decrease in blood glucose levels for both genotypes (Tg; P < .05) as anticipated. However, upon repeated exposure to fasting for scan 2 and 3, these reductions in blood glucose become largely attenuated, with the blood glucose levels of Tg mice for the third scan session (scan 3) essentially even reaching the baseline glucose levels as demonstrated in Figure 5A.

Glucose (A) and body weight (B) changes over time of the WT and the Tg mice (*P < .05, **P < .01).
An initial exposure to fasting for the first scan caused also a nonsignificant decrease in body weight for both genotypes followed by a more stable evolution for later scans (Figure 5B). The loss in body weights of all mice in percentage of the baseline body weight was within a range of minimum 6.07% and maximum 14.04%.
Overall, Figure 6 shows that the brain uptake values within group remained more stable over time with various scan sessions only when glucose correction was applied (%ID/gglc and SUVglc). When additionally correcting for animal weight (SUVglc), the anticipated hypometabolism 35,36 for Tg animals is significant in the thalamus at scans 1 and 2. However, caution is warranted as a linear correction for body weight might overestimate differences between groups with nonnegligible body weight differences. Noteworthy, if not correcting for glucose levels and body weight (%ID/g), an erroneous hypermetabolism may be concluded for the Tg mice after the first scan session, again illustrating the critical importance of correcting for these physiological determinants. This is also demonstrated in Figure 7, as group-averaged images only remain stable over scan sessions and consistently show hypometabolism of Tg versus WT if corrected for whole blood glucose levels. Additionally, a linear correction for body weight might overestimate the intergroup differences in brain glucose metabolism (see Figure 5B).

Graph representing the different image quantifications percent injected dose (%ID/g) and standard uptake value (SUV) with and without glucose correction for the thalamus in WT and Tg mice on the different scan days.

Standard uptake value (SUV), SUVglc, percent injected dose (%ID/g), and %ID/gglc average images showing the different 18F-fluoro-
The Cerebellum is not an Appropriate Reference Region in TASTPM Mice
The body weights of the WT mice (31 g ± 1.2) were significantly (P < .05) higher than the Tg mice (28 ± 0.6 g), and there was no significant difference between the glucose levels of the Tg (128.7 ± 9.6) and the WT (128.1 ± 5.2 mg/dL) mice after 10.45 ± 0.25 hours of fasting.
Figure 8 shows that when correcting for blood glucose levels (%ID/gglc, SUVglc) a significant hypometabolism is measured as expected 35,36 and is the largest for SUVglc potentially being an overestimation due to linear overcorrecting for significant intergroup body weight differences. When not correcting for body weight or glucose (%ID/g), this significant hypometabolism is lost. Importantly, all quantification methods demonstrate that also the cerebellum has a lower brain uptake (SUV and SUVglc; P < .05) of 18F-FDG. Hence, normalizing to the cerebellum (rSUV) as a reference region yielded higher values for Tg (Figure 8), thereby largely eliminating the observed hypometabolism as evaluated with the other quantification measures and even resulting in a trend toward hypermetabolism for some regions.

Graphs representing the different quantification measures percent injected dose (%ID/g) and standard uptake value (SUV) with and without glucose correction and also the relative SUV for WT and TG mice. Uptake is measured in the striatum (STR), cortex (CTX), hippocampus (HIP), thalamus (THA), cerebellum (CB), basal forebrain and septum (BFS), hypothalamus (HYP), amygdala (AMY), brain stem (BS), cingulate cortex (CG), superior colliluli (SC), midbrain (MID), and inferior colliculi (IC). *P < .05; **P < .01; ***P < .001.
Discussion
Clinical 18F-FDG PET studies of patients with AD show a decreased cerebral metabolism both in brain regions affected by Aβ plaque deposition as well as in pathology-free regions. 8,45 It has been shown that these regions affected by Aβ match those brain areas with increased 18F-FDDNP and 11C-PiB retention. 46,47 In the preclinical field, a lot of conflicting data are reported whether transgenic models demonstrate hyper-, 13,14 hypo-, 17 or normometabolism, 15,48 with 18F-FDG PET in comparison to healthy controls. Nevertheless, 18F-FDG as a preclinical biomarker would improve the predictability of drug discovery and development efforts by improving the congruency of preclinical models to clinical reality. Therefore, there is a need to investigate the physiological and methodological factors that can possibly confound the results in such preclinical AD research studies.
Fueger et al 23 already demonstrated the need to fasten (8-12 hours) animals before a 18F-FDG PET scan in order to lower plasma glucose levels and to reduce 18F-FDG uptake in skeletal muscle and brown fat to achieve a higher brain uptake. In our study, we showed that even a higher brain uptake was observed when fasting duration was 19.77 ± 0.01 hours in comparison to 10.41 ± 0.35 hours mainly due to decreasingly low blood glucose levels and not necessarily reflecting altered cerebral glucose metabolic rate. Therefore, it is advisable to always correct for blood glucose levels in order to attenuate any differences in 18F-FDG brain uptake due to different fasting durations. Noteworthy is that when fasting, the mice for 10.41 ± 0.35 hours the inherent difference in plasma glucose levels between WT and Tg mice was maintained, while 19.77 ± 0.01 hours of fasting completely attenuated this difference. Such can be due to increased serum corticosterone levels as Tg mice could be more sensitive to fasting stress by food deprivation, as we and others have previously shown for rats when fasted for 24 hours 24,49 as well as by scan manipulations. However, when animals need to be repeatedly scanned within a short period of time, prolonged fasting leads to substantial weight loss, and fasting durations are preferably much shorter than 19.77 ± 0.01 (8-12 hours). Indeed, Jensen et al 50 summarized the effects of fasting of mice such as changes in hormone balance, body weight, and metabolism among other effects and showed that these changes become larger with longer (overnight) fasting times, as mice consume two-thirds of their total food intake during the night and have a higher metabolic rate than humans. In our study, fasting was done by removing the food pellets and changing the bedding material. This however does not prevent the mice from eating the bedding material and newly produced feces. For this reason, placing the mice on a grid floor during fasting has been recommended 50 but has its implications on animal welfare.
In such a setting with repeatedly scanning and short interscan durations, one equally has to take the blood glucose into account when quantifying the 18F-FDG brain uptake as levels rise over time with the scan sessions (and even more so in Tg mice) for the same reasons. We show here that with repeated scanning, glucose corrected uptake values did not only remove the glucose-induced variability in 18F-FDG uptake over time with scan sessions but also demonstrated the difference between WT and Tg mice more significantly.
In our study, the measures accounting for body weight (SUV and the SUVglc) revealed larger differences between WT and Tg mice compared to the other (%ID/g and %ID/gglc) metrics, since SUVglc corrects for the larger volume as WT mice had significantly higher body weights than Tg mice. These SUV measures may however overestimate the actual 18F-FDG uptake if the larger body weight is mostly due to a higher percentage of body fat, as this accumulates relatively little 18F-FDG. Such an overestimation is known in humans 51 and recently also in rodents. 24 Therefore, the use of a lean body weight 51 or a body surface area 52 has been proposed in clinic. As these corrections are however infrequently done, Thie et al 53 proposed a weight sensitivity index for the SUV.
Also, the transgene status of the TASTPM mice could result in a global change in the glucose metabolic rate in the entire mouse or in organs other than the brain. Therefore, the 18F-FDG uptake in the muscle, liver, brown fat, and myocardium was also evaluated (Supplementary Figure S1). A significant difference in muscle uptake was observed between WT and Tg mice for all quantification measures. However, the difference in muscle uptake is very likely more a consequence of reduced (overall) activity of Tg rather than a globally reduced regional metabolic rate of glucose in Tg mice, as these differences are not consistently observed in the other organs.
To avoid all the aforementioned issues related to glucose and body weight, and also with attenuation or calibration, normalization to a reference region is commonly performed. Moreover, such normalization increases statistical power by reducing variability in global flow or metabolism. 17 However, this approach may yield very inaccurate results if such a reference region is compromised by disease and can thus be a confounding methodological factor. Due to its relative lack of amyloid pathology, the cerebellum is often designated as a reference region. 9,14,54 However, despite the lack of amyloid deposits, we demonstrated a lower 18F-FDG uptake in the cerebellum of Tg mice compared to WT with all quantification measures used which might be caused by amyloid pathology in afferent regions. Waldron et al 35 already showed that regions of decreased 18F-FDG uptake demonstrated by imaging and regions of high amyloid load demonstrated by histology in 13.5 M TASTPM mice are not necessarily correlated.
Applying an rSUV hence leads to comparable 18F-FDG brain uptake in the target regions of Tg and WT, while hypometabolism has been previously proven 35,36 and was confirmed here by us with %ID/gglc and SUVglc, which confirms other pathological alternations between Tg and WT mice, besides plaque load in the cerebellum. It is however possible that SUV is not always sensitive enough to pick up early differences between Tg and WT. Macdonald et al, 18 for example, could not distinguish young 5XFAD mice from WT mice until the age of 13 months. In that study, Tg mice could however already be separated from WT at the age of 2 months when comparing the ratios of alternating regions in the same brain.
Besides the aforementioned physiological (glucose, body weight) and methodological (reference region) determinants, also technical limitations such as spatial resolution have an impact. In mice, regions with high uptake in the head such as the masseter muscles of the jaw or facial glands (salivary, lacrimal, and harderian) may contaminate nearby brain regions due to spillover. On the other hand, the uptake of 18F-FDG in small brain regions may be underestimated due to partial volume effect. The smallest volumes studied here were 8.71 and 7.38 mm3, respectively, from the superior and inferior colliculi, while the other regions were larger than 10 mm3. 43 A study by Welch et al 17 showed that statistical parametric mapping was generally more sensitive than regional analyses, as small clusters of voxels within a VOI can differ significantly even in the absence of significant changes over the whole region. Alternatively, larger rodent species such as transgenic rats expressing mutations related to familial AD have also been proposed 55 and tested. 56
Conclusion
Corrections for blood glucose levels have to be applied when semiquantifying 18F-FDG brain uptake in mouse models for AD to attenuate the effects of varying fasting durations and the impact of repeatedly scanning. The use of SUVglc is advised over the %ID/gglc, as this measure demonstrates the anticipated 18F-FDG uptake difference between WT and Tg mice more clearly. However, SUV should be carefully considered if significant intergroup (between models) or interscan (longitudinally over time) body weight differences exist. Potential reference regions for normalization should be thoroughly investigated to ensure that they are not pathologically affected also by afferent connections.
Footnotes
Acknowledgments
We thank Philippe Joye of our Molecular Imaging Center Antwerp for his technical assistance
Authors’ Note
Steven Deleye and Ann-Marie Waldron contributed equally to this work. This research was performed in conjunction with the European Community’s Seventh Framework Program (FP7/2007-2013) for the Innovative Medicine Initiative under the PharmaCog Grant Agreement n°115009.
Declaration of Conflicting Interests
The author(s) declared the following potential conflicts of interest with respect to the research, authorship, and/or publication of this article: X.L. and M.S. are employed by Janssen Pharmaceutica and J.R. by GSK.
Funding
The author(s) disclosed receipt of the following financial support for the research, authorship, and/or publication of this article: This work was funded by Antwerp University, Belgium, through a junior research position for S.D, and an associate professor position for St.S, and a full professor position for Si.St. Si.St is also supported by Antwerp University Hospital, Belgium through a departemental position.