
Abstract
Objective:
Imaging animal models of Alzheimer disease (AD) is useful for the development of therapeutic drugs and understanding AD. Transgenic Swedish hAPPswe Tg2576 mice are a good model of β-amyloid plaques. We report 18F-fluoro-2-deoxyglucose (18F-FDG) positron emission tomography (PET) imaging of brain and intrascapular brown adipose tissue (IBAT) in transgenic mice 2576 (Tg2576) and wild-type (WT) mice.
Methods:
Transgenic Tg2576 mice and WT mice, >18 months were injected intraperitonally with ≈ 25 to 30 MBq 18F-FDG while awake. After 60 minutes, they were anesthetized with isoflurane (2.5%) and imaged with Inveon MicroPET. Select mice were killed, imaged ex vivo, and 20 µm sections cut for autoradiography. 18F-FDG uptake in brain and IBAT PET and brain autoradiographs were analyzed.
Results:
Fasting blood glucose levels averaged 120 mg/dL for WT and 100 mg/dL for Tg2576. Compared to WT, Tg2576 mice exhibited a decrease in SUVglc in the various brain regions. Average reductions in the cerebrum regions were as high as −20%, while changes in cerebellum were −3%. Uptake of 18F-FDG in IBAT decreased by −60% in Tg2576 mice and was found to be significant. Intrascapular brown adipose tissue findings in Tg2576 mice are new and not previously reported. Use of blood glucose for PET data analysis and corpus callosum as reference region for autoradiographic analysis were important to detect change in Tg2576 mice.
Conclusion:
Our results suggest that 18F-FDG uptake in the Tg2576 mice brain show 18F-FDG deficits only when blood glucose is taken into consideration.
Keywords
Introduction
With increasing prevalence of Alzheimer disease (AD) in an aging population, there is an immediate need of earlier diagnosis and development of treatment strategies for AD. Animal models have become ubiquitous in the study of disease, particularly those involving genetic components, such as AD in an effort to understand human AD. 1,2 The transgenic 2576 (Tg2576) mouse model of AD expresses the Swedish mutation of the amyloid precursor protein (APP SWE) at a high level under control of the hamster prior protein promoter. 3 By 12 months of age, Tg2576 animals show the first signs of β-amyloid (Aβ) deposits in plaques, and older than 20 months of age have extensive plaque pathology. 4 In parallel, animals develop behavioral deficits particularly in spatial memory. 3,5,6 Additional characteristics regarding the age of onset and type of Aβ deposited in the brains of Tg2576 have been described 7 providing animals of appropriate ages that resemble pre-AD Aβ pathology, early AD pathology, and late stage AD pathology. 8 Currently no existing animal model of AD has been shown to exhibit all pathological alterations of human AD, but several exhibit 1 or multiple elements of the disease.
Changes in neuronal brain activity have been assessed by measuring cerebral metabolic rates of glucose using 18F-fluoro-2-deoxyglucose (18F-FDG) positron emission tomography (PET). Loss of neuronal activity (assessed by reduction in regional brain 18F-FDG uptake in AD) and correlation of this loss with disease progression has been indicative of brain pathology in AD. 9 Thus, hypometabolic measures using 18F-FDG PET in human patients with AD have shown diagnostic value, and a relationship of Aβ plaques and 18F-FDG reduction in early detection of AD have been examined. 10 Various neuroimaging methods have been used in mice models of AD. 11 Although with 18F-FDG PET the expectation has been to observe hypometabolism in the transgenic AD mice model brains, recent studies point to varying results. There are reports of little change, to decreases or to increases in 18F-FDG uptake in the brains of transgenic AD models. These findings have pointed to the limitations in translation of the animal AD models to human AD. 12,13
Several reports have shown degeneration of the locus coeruleus in the AD brain 14 thus affecting norepinephrine (NE) levels in the brain. 15 Similarly, in the Tg2576 mice, a significant reduction in NE levels (40% reduction in hippocampus compared to wild type [WT] in 23-month-old animals) have been reported in older animals, 16 whereas little change was reported in younger animals. 17 Nerve fibers containing NE innervate brown adipose tissue (BAT). 18 Norepinephrine acting on β3-adrenoreceptor is most studied for BAT metabolism and enhances glucose uptake in BAT in vivo. 19 Increasing NE by atomoxetine, a highly selective inhibitor of presynaptic norepinephrine transporter (NET) increased 18F-FDG BAT activity in mice 20 and administration of NE also increased 18F-FDG BAT activity in mice. 21 Since Tg2576 mice exhibit lowered NE levels in the brain, assessment of 18F-FDG BAT activity in the Tg2576 mice may also be important as a potential marker to study alterations in NE levels in this animal model. No reports are available on BAT metabolism in the Tg2576 mice.
Thus, we chose whole-body imaging using 18F-FDG to measure the cerebral and BAT metabolism of aged Tg2576 and compare them with WT mice. Our goals in this 18F-FDG imaging study were the following: (1) carry out whole-body PET imaging of Tg2576 and WT mice to evaluate brain and BAT metabolic activity and (2) carry out ex vivo autoradiographic analysis of brain sections in select mice in order to ascertain in vivo findings.
Material and Methods
Animals
This study was conducted under protocols approved by the University of California Irvine Institutional Animal Care and Use Committee. Transgenic Tg2576 and WT mice were purchased commercially from Charles River Laboratories. The mice were both male and female age paired, litter mate, transgenic (Tg2576, n = 7 mice, 18-month-old, 4 females, 3 males), and WT C57BL/6 mice (n = 7, 18-month-old, 4 females, 3 males). The subjects were housed in pairs with either Tg2576 or WT and were kept in a climate controlled room (24.4°C), with a 12:12-hour light cycle. During housing, subjects had access to food and water ad libitum. Blood glucose was measured using a glucometer (Contour, Bayer, Japan).
In Vivo PET
Subjects were fasted in the scanner room, in a dark quiet place, for 24 hours prior to experiments (special bedding, “Nestlets,” consisting material made from paper or cotton fiber was used to avoid animals chewing regular bedding). 18F-FDG was purchased commercially from PETNET. Subjects were sampled for glucose, then injected intraperitonally with 29 to 37 Mbq in 0.9% sterile saline 0.3 mL, while awake without isoflurane anesthesia. Subjects were then returned to their cages and allowed to uptake the tracer in an awake, unrestrained state for 60 minutes. The subjects were then anesthetized with isoflurane, 4% induction, maintained at 2.5%, placed on a warming pad inside the Siemens Inveon PET scanner with their brain aligned in the center. Imaging took place for 60 minutes, from 65-minute postinjection of 18F-FDG to 125 minutes. Attenuation scans were then performed with a Cobalt-57 (Co-57) point source. Once imaging was completed, subjects were removed from the scanner and returned to their cages.
Ex Vivo PET and Autoradiography
Select subjects for each type (n = 2 Tg2576 and n = 2 WT), after scanning, were chosen for ex vivo PET, autoradiography, and plaque staining. The brain was removed, frozen, and placed back into the scanner. An additional 1-hour acquisition was completed with an attenuation scan. Brains were then sectioned at 20 µm thick. Forty sections from each brain were set to glass slides, then placed on Perkin Elmer—multisensitive, medium film, and left undisturbed overnight. The following day, the film was exposed using a Cyclone Phosphor Imaging System (Packard Instruments, Boston, MA, USA) and Optiquant. After autoradiography and radioactive decay (>48 hours), sections were stained with thioflavin-S for confirmation of Aβ in Tg2576, and absence in WT animals.
Image Reconstruction and Analysis
Scanning data were acquired by the Inveon MicroPET in full list mode. List mode data were sorted into a single frame, 3-dimensional sinogram, which were rebinned using a Fourier rebinning algorithm. The images were reconstructed using 2-dimensional filter back projection using a Hanning filter with a Nyquist cutoff at 0.5 and corrected for attenuation using the Co-57 attenuation scan data. Calibration was Bq/cm3 units using a germanium-68 phantom, scanned in the Inveon and reconstructed under the same parameters as the subjects.
Analysis was conducted using PMOD version 3.0 software, and an averaged mouse brain atlas-based volume of interest (VOI) set obtained from Brookhaven National Laboratories. 22 The VOI atlas encompasses the entire brain and divides it into 20 VOIs. The images and atlas were coregistered using anatomical guides including the brain stem, ventral edge of hypothalamus, dorsal edges of the cortex, Harderian glands, the olfactory bulb, and ventricles. Activity was normalized using standard uptake value (SUV = [18F-FDG activity in each VOI, VOI in kBq/mL]/[injected dose in kBq]/body weight of each animal in g) methods typically used during the use of 18F-FDG. 20 Averaged blood glucose levels were used to obtain SUVglc (SUV × glucose). Ex vivo images, reconstructed using the same methods, were analyzed qualitatively for comparison. Autoradiographs were analyzed using Optiquant software (Version 5.0.0.2). The 40 sections from each subject were averaged and analyzed.
The magnitude of BAT 18F-FDG was analyzed using VOIs drawn on PET images for interscapular BAT (IBAT). Similarly to previously described methods, 20 the VOIs were delineated visually by autocontouring the 18F-FDG activity that was clearly above normal background activity in mice treated with drugs. The VOIs were delineated visually using a standard computed tomography (CT) image. All in vivo images were analyzed using PMOD software (PMOD Technologies, Zurich, Switzerland) and Inveon Research Workplace software (Siemens Medical Solutions, Knoxville, Tennessee).
Statistical differences between groups were determined using 2-tailed 2-sample unequal variance Students t test in Microsoft Excel. A P value of <.05 was considered to indicate statistical significance.
Results
Cerebral Glucose Metabolism
In mouse, nonfasted glucose measurements were averaged to be ∼158 mg/dL and after 24 hours of fasting average values were 120 mg/dL for WT mice and 100 mg/dL for Tg2576 mice. All mice exhibited 18F-FDG uptake in the brain, extracranial uptake, BAT and excreted in the urinary bladder as seen in whole-body images of WT and Tg2576 mice. Brain uptake of 18F-FDG in both the groups, Tg2576, and WT followed a similar pattern in the brain. Figure 1 shows coregistered 18F-FDG PET images with a magnetic resonance (MR) mouse template (Figure 1A), showing coronal, sagittal and transaxial brain slices of representative animals from the WT (Figure 1B) and Tg2576 (Figure 1C) group. PET images revealed 18F-FDG uptake in frontal cortex, midbrain, and cerebellum. Extracranial uptake of 18F-FDG was observed in the Harderian glands. These were absent when the brain was excised and ex vivo PET scans were obtained as shown in Figure 1E and F. Brain regions were more clearly visualized in the ex vivo scans, although the resolution of the PET scanner still prevented clear delineation of the substructures as seen in the MR images (Figure 1A) or the template (Figure 1D).

Brain 18F-FDG images: (A) mouse brain magnetic resonance (MR) template showing coronal, sagittal, and transaxial views; (B) coregistered wild-type (WT) mouse brain 18F-FDG PET images of coronal, sagittal, and transaxial views; (C) coregistered Tg 2576 mouse brain 18F-FDG PET images of coronal, sagittal, and transaxial views; (D) screen capture of the horizontal slice of mouse brain atlas showing relevant brain regions; (E) transgenic Tg 2576 ex vivo 18F-FDG PET horizontal PET brain slice; (F) WT ex vivo 18F-FDG PET horizontal brain slice.
Standard uptake values of brain regions for the mice groups are summarized in Table 1 and shown in Figure 2. Tg2576 mice were seen to have greater 18F-FDG consumption in all brain regions analyzed. The midbrain regions such as the thalamus exhibited higher SUV values in both the mice models while the lowest was observed in the amygdala. Difference in SUV values between Tg2576 and WT mice was in the range of 0.05 to 0.20. Several Tg2576 brain regions that showed a >10% 18F-FDG uptake compared to the WT mice brains included cerebellum (+15.7%), inferior colliculi (+15.5%), frontal cortex (+11.5%), olfactory bulb (+12.5%), superior colliculi (+11.6%), and central gray (+10.2%; Table 1). All other brain regions in the Tg2576 mice exhibited higher 18F-FDG uptake (3%-9%) compared to the WT mice. However, when the SUV values were corrected for the blood glucose levels in these mice (SUVglc), the Tg2576 mice exhibited lower SUVglc uptake in the brain compared to the WT mice (Table 1). Several brain regions exhibited greater than −10% lower uptake of 18F-FDG in the Tg2576 mice with up to −20% in the hypothalamus. Cerebellum had the least decrease. However, difference in 18F-FDG brain uptake between WT and Tg2576 in the in vivo PET scans was not statistically significant (P > .2).
18F-FDG Uptake per Brain Region in Mice.
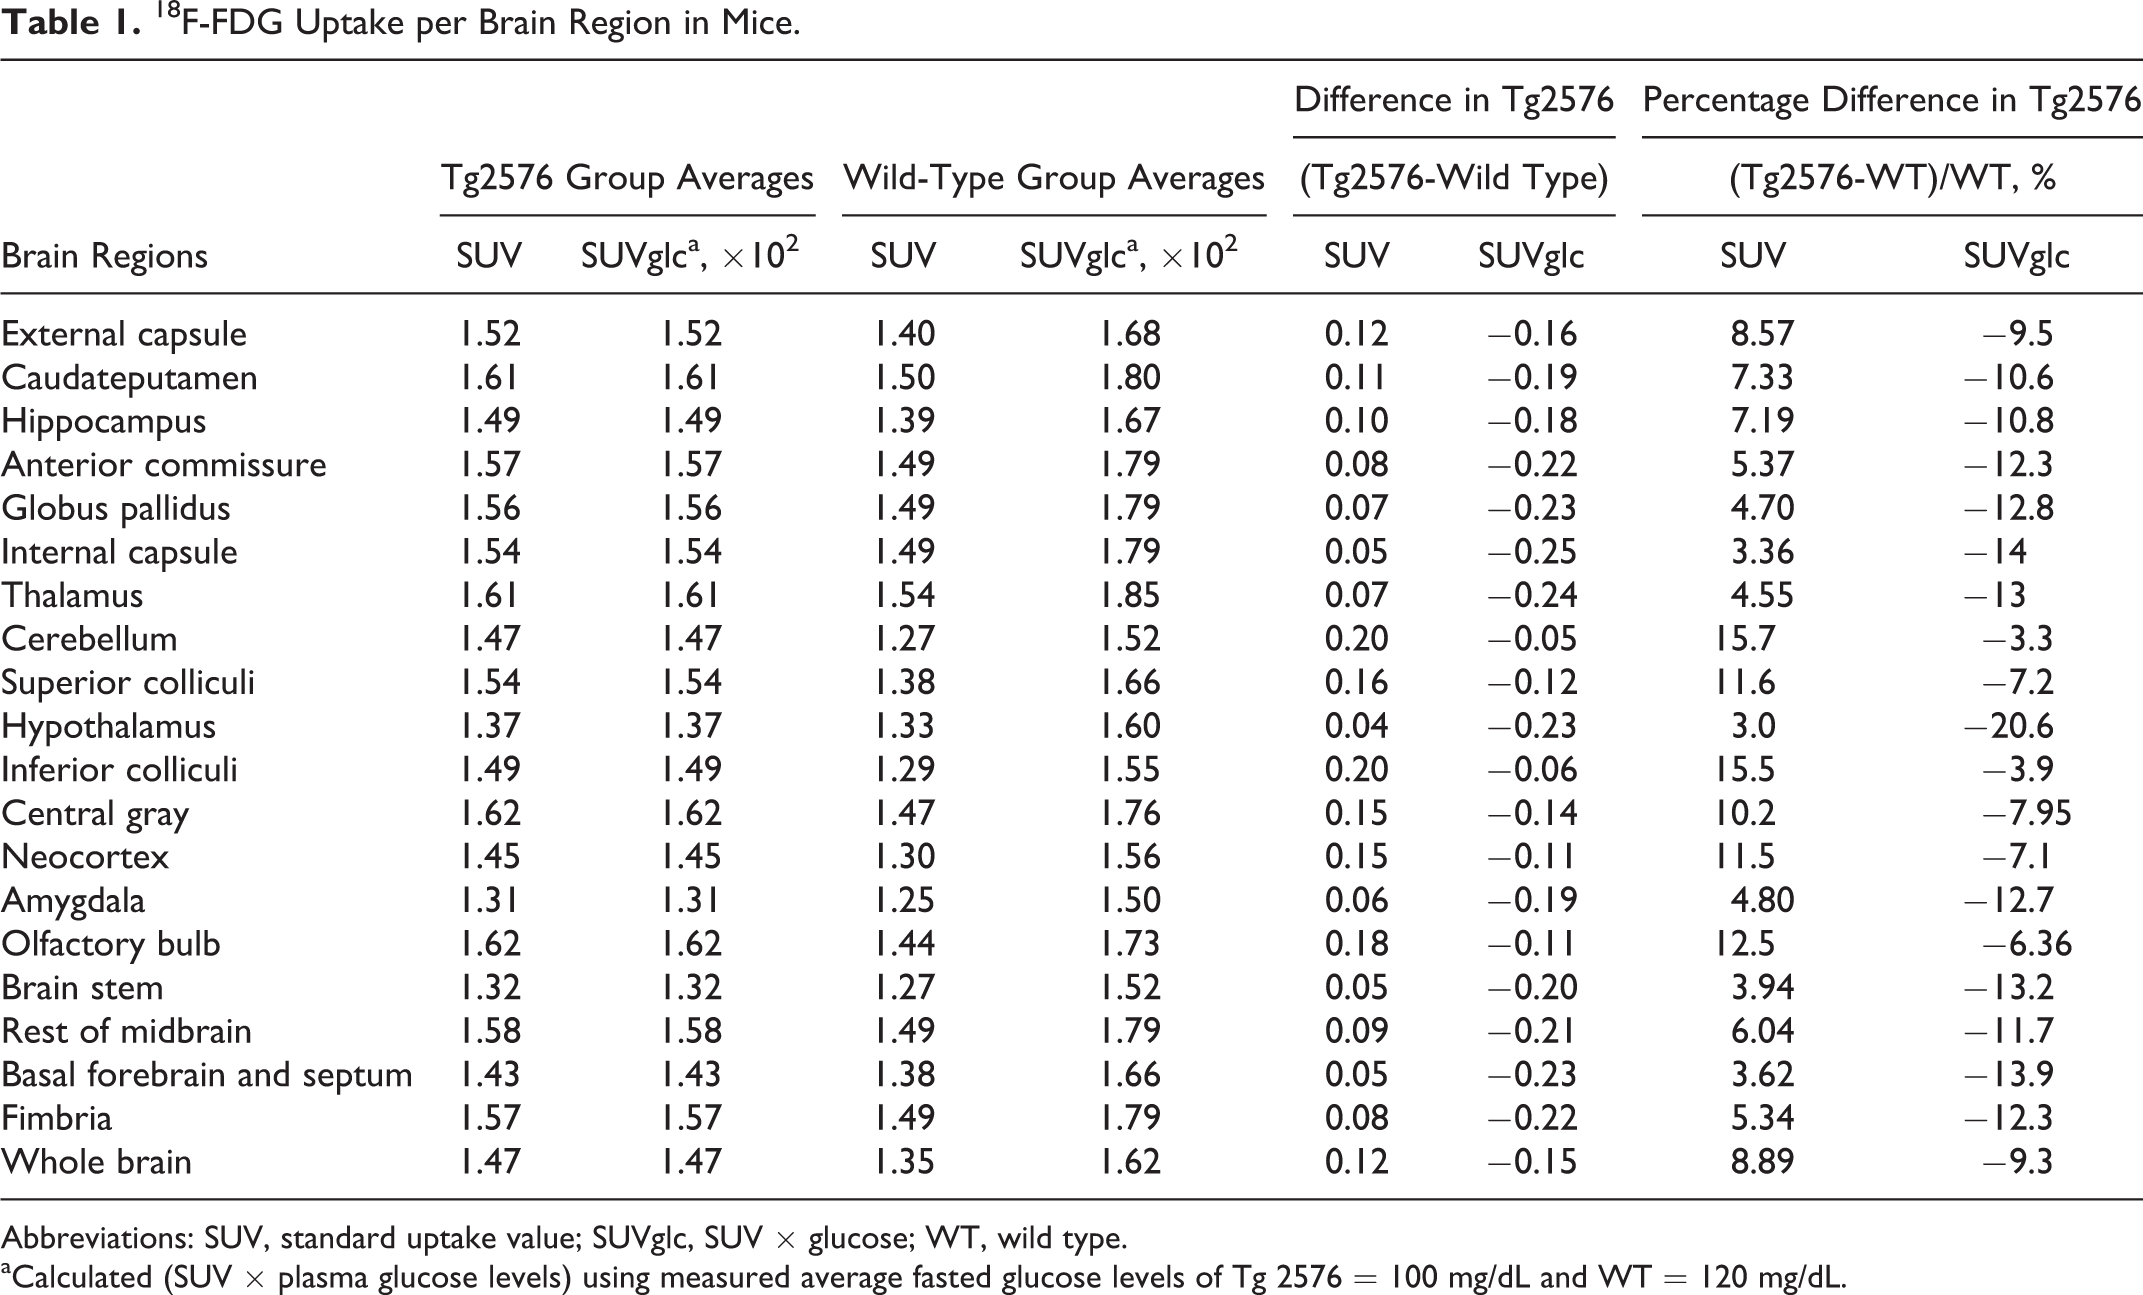
Abbreviations: SUV, standard uptake value; SUVglc, SUV × glucose; WT, wild type.
aCalculated (SUV × plasma glucose levels) using measured average fasted glucose levels of Tg 2576 = 100 mg/dL and WT = 120 mg/dL.

Brain 18F-FDG plot. 18F-FDG uptake in Tg 2576 and WT mice in different brain regions expressed as SUV and SUVglc (values from Table 1). Significance was poor for the difference between Tg SUV versus WT SUV (unpaired t test values P > .4), and for Tg SUVglc versus WT SUVglc, P > .17. AC indicates anterior commissure; AM, amygdala; BS, brain stem; BF, basal forebrain; CB, cerebellum; CG, central gray; CP, caudate putamen; EC, external capsule; FM, fimbria; GP, globus pallidus; HP, hippocampus; HY, hypothalamus; IC, internal capsule; IC, inferior colliculi; MB, midbrain; NC, neocortex; OB, olfactory bulb; SC, superior colliculi; SUV, standard uptake value; SUVglc, SUV × glucose; TH, thalamus; WB, whole brain; WT, wild type.
Ex Vivo Brain Autoradiography
After the ex vivo brain PET scans seen in Figure 1E and F, there was sufficient 18F-FDG activity left in the brain suitable for autoradiographic purposes. Brain regions were more clearly visualized in the autoradiographic 18F-FDG brain slices of both the Tg2576 and WT mice as seen in Figure 3A-D. Brain regions such as frontal cortex, caudate-putamen, thalamus, hippocampus, and cerebellum all showed significant uptake of 18F-FDG. In both the WT and Tg2576 mice, the caudate–putamen showed higher levels of 18F-FDG uptake while the hippocampus levels were lower as seen in Figure 2E. White matter including corpus callosum has been shown to have some 18F-FDG uptake in rodents. 23 The ex vivo brain slices had approximately similar low 18F-FDG uptake in the corpus callosum of both the WT and Tg2576 mice and were therefore used as a reference region. In all brain regions, Tg2576 mice brain slices had lower uptake ratios compared to WT mice and was consistent with in vivo findings. The exception was the cerebellum, where the Tg2576 mice had a higher ratio compared to WT. Presence of Aβ plaques was confirmed by thioflavin staining in the cortical and hippocampus regions in the Tg2576 mice brain slices (Figure 3F). As expected, these were absent in the WT brain slices (Figure 3E).
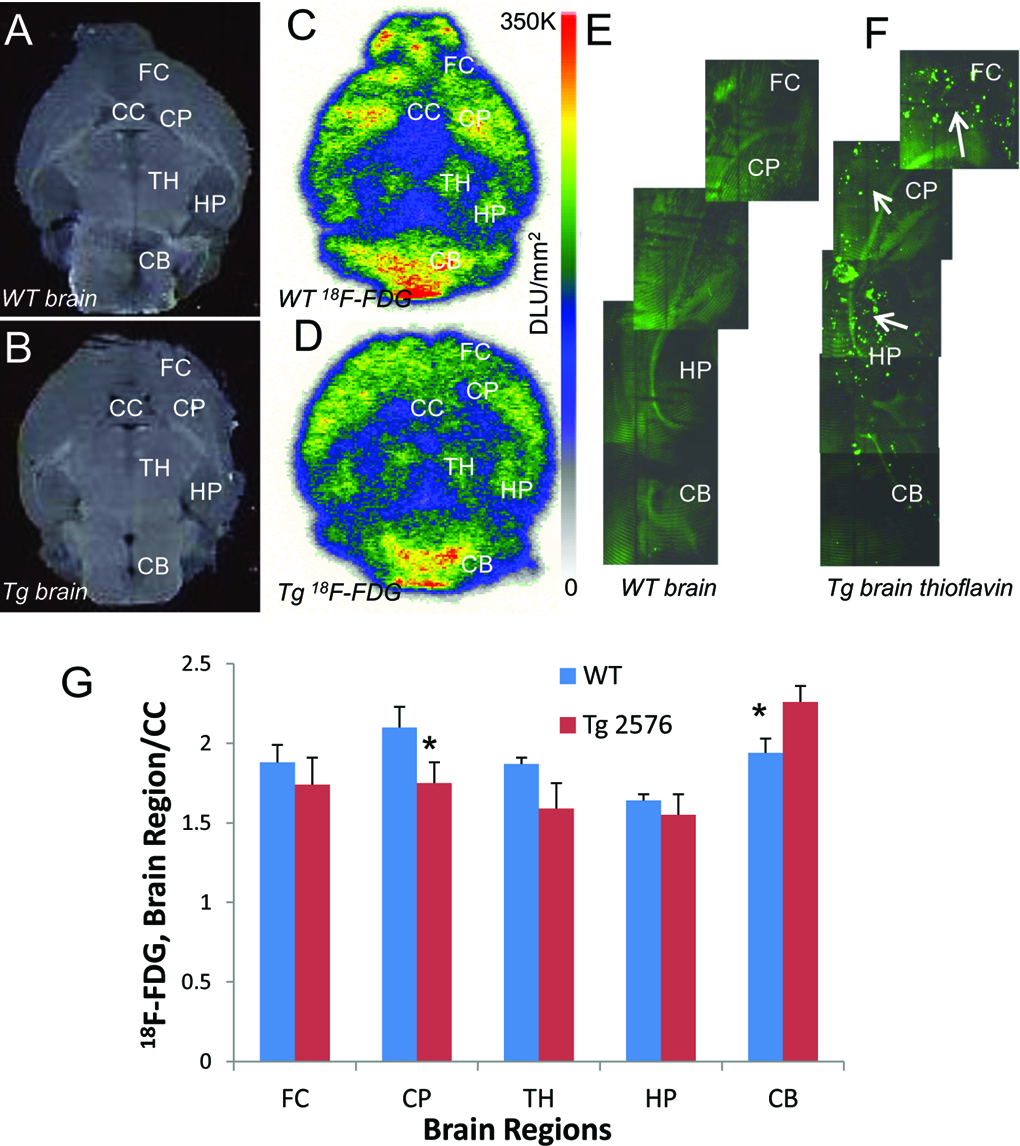
Ex vivo autoradiographs: (A) brain slice (20 μm thick) of WT mouse showing various brain regions and (C) shows 18F-FDG uptake in the brain slice; (B) brain slice (20 μm thick) of Tg2576 mouse showing various brain regions and (D) shows 18F-FDG uptake in the brain slice; (E and F) thioflavin staining of WT and Tg2576 brain sections showing presence of β-amyloid plaques (arrows) in the Tg2576 mice brain but absent in WT (G). Comparison of ratio of 18F-FDG uptake in brain regions versus CC used as reference region in autoradiographic brain slices (C and D) of Wild Type and Tg 2576 mice; difference between WT and Tg2576 was significant (P < .05, asterisk) for CP and CB; other brain region differences were not significant, P > .2). CB indicates cerebellum; CC, corpus callosum; CP, caudate putamen; FC, frontal cortex; HP, hippocampus; TH, thalamus.
Table 2 summarizes results from quantitative analysis of the autoradiograms and shown are the percent change in the ratio of 18F-FDG uptake in the various brain regions (calculated using corpus callosum as a reference region). Thalamus and caudate putamen in the Tg2576 mice exhibited the greatest decrease in 18F-FDG uptake compared to WT (15%-17% decrease). This was followed by hippocampus (−5%) and frontal cortex (−7%). The decreased 18F-FDG uptake in Tg2576 mice seen in the autoradiographs is consistent with in vivo PET findings, although the extent of decrease is greater. Cerebellum in the Tg2576 mice showed a greater 18F-FDG uptake (+17%) compared to the WT mice. Only differences in caudate putamen and cerebellum were statistically significant (Figure 3G).
18F-FDG Uptake in Ex Vivo Autoradiography.

Abbreviations: NA, not applicable; WT, wild type.
aCorpus callosum used as a reference region to calculate ratios of DLU/mm2 measured using Optiquant software in autoradigrams in various brain regions.
bDifference between the measured ratios of WT and Tg 2576.
cPercentage difference (or change) calculated as WT-Tg 2576/WT × 100.
Brown adipose tissue 18F-FDG PET
Uptake of 18F-FDG in IBAT was observed in both the WT and Tg2576 mice and was consistent with our previous reports in mice studies. 20 The extent of 18F-FDG uptake in the WT animals was similar to previous study under normal baseline conditions without anesthesia and was ascertained by CT scans (Figure 4A 24 ). Uptake of 18F-FDG in the IBAT of WT animals was found to be similar or greater than that found in the brain (Figure 4B and C).
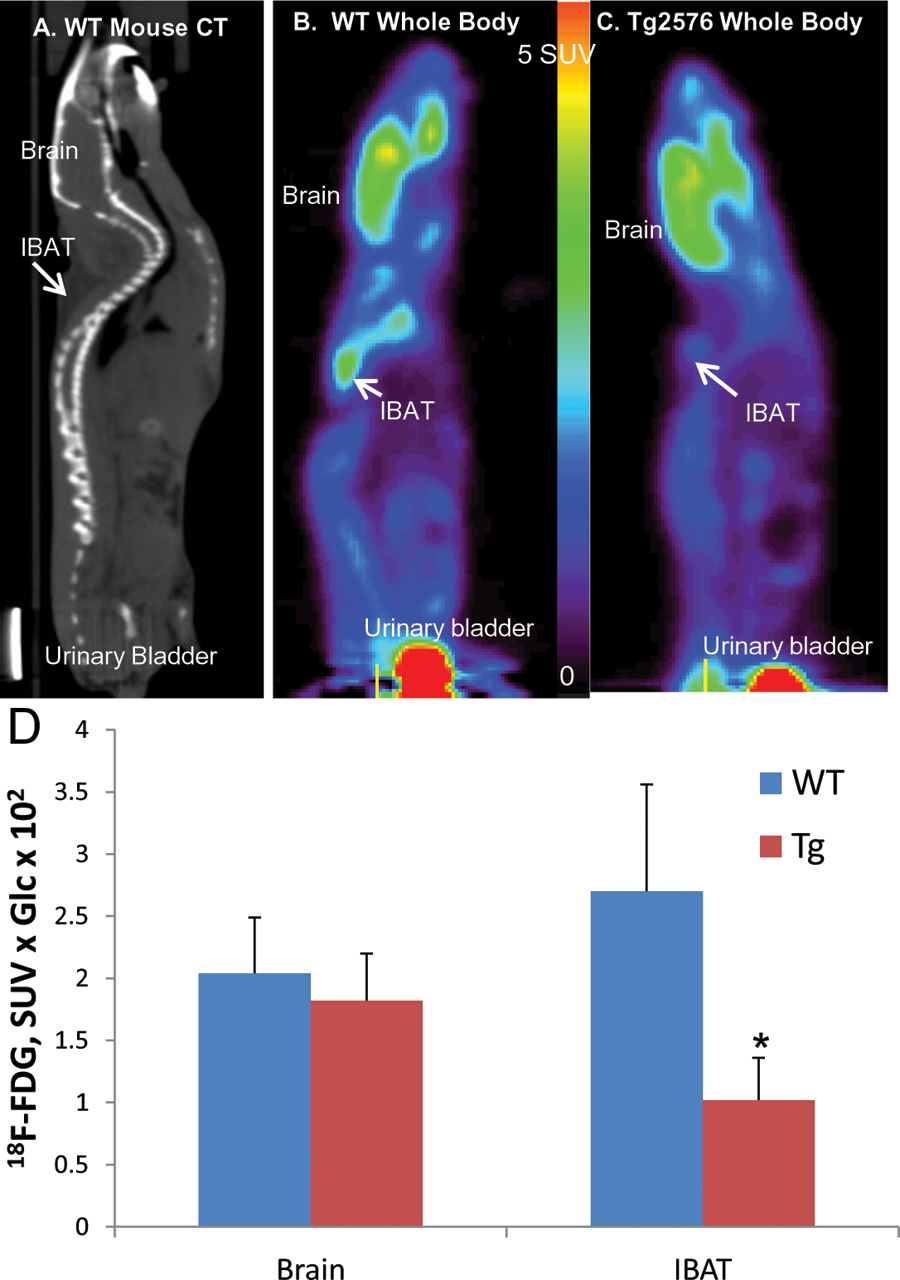
Whole-body 18F-FDG uptake mice. (A) Mouse CT image slice showing brain and interscapular BAT (IBAT) regions. (B) PET image slice of in vivo 18F-FDG in WT mouse showing significant brain and IBAT uptake. (C) PET image slice of in vivo 18F-FDG in Tg 2576 mouse showing significant brain but lower IBAT uptake. (D) Average brain and IBAT uptake with standard deviation in WT mice and Tg 2576 mice showing lower IBAT uptake compared to brain in Tg 2576 and higher IBAT uptake compared to brain in WT. Difference between WT and Tg2576 was significant (P < .05, asterisk) for IBAT. CT indicates computed tomography; IBAT, intrascapular brown adipose tissue.
Average brain uptake was 1.70 SUV, while IBAT uptake was found to be 2.30 SUV in WT animals. Ratio of brain to IBAT was found to be 0.74 in WT mice, and this higher BAT uptake in WT mice is consistent with previous reports when no isoflurane anesthesia was used. 23 It should, however, be noted that when isoflurane anesthesia is used for 18F-FDG injection, the IBAT uptake is lower than brain uptake. 20 In the case of Tg2576 mice, IBAT uptake was discernible and found to be lower compared to the WT mice IBAT. Most of the Tg2576 mice studied exhibited lower IBAT uptake compared to brain (Figure 4C). Corrected for blood glucose levels, average brain uptake corrected for blood glucose (SUV × Glc 102) in Tg2576 mice brain was 1.82, while IBAT uptake was found to be 1.02, whereas uptake in WT mice brain was 2.04, while IBAT uptake was found to be 2.76 as seen in Figure 4D. Thus, Tg2576 mice exhibited an approximately −10% reduction in brain uptake and a −63% reduction in IBAT uptake of 18F-FDG. Without correction for blood glucose, there was an increase in brain uptake of 18F-FDG in Tg2576 mice compared to WT measured by PET. In the case of IBAT, there was a statistically significant decrease (>−60%) of 18F-FDG uptake, with or without the blood glucose correction (Figure 4D).
Discussion
Significant differences seen in brain regions by PET in Tg2576 mice indicate metabolic differences likely exist as a result of the pathology of the APP SWE gene. These regional and global metabolic decreases were confirmed by autoradiography, identifying the thalamus, caudate putamen, hippocampus, and frontal cortex as the regions with the most striking differences in glucose metabolism. Differences in regional metabolism within the neocortex are likely; however, we were unable to target cortical subregions with in vivo PET. Resolution constraints and possible morphological differences would likely confound attempts to sample such regions with these in vivo 18F-FDG methods. Regardless, our autoradiographic findings implicate likely metabolic decrease in the frontal region of the neocortex in Tg2576.
Blood glucose competes with 18F-FDG to a degree which could affect tracer quantitation and would make for inaccurate comparison. This has been proposed by others, by generating SUV equations to normalize subject data for blood glucose. 25 We found a statistical difference in transgenic and WT mice fasting blood glucose levels. Upon comparative analysis of glucose states of Tg2576 and WT, significantly greater decline was seen in blood glucose levels of mice with the APP SWE gene, in the absence of food for a 24-hour period. Lower blood glucose levels in fasting transgenic animals have been previously reported. 26 This emphasizes the necessity of glucose sampling, and the use of a SUV equation which sufficiently accounts for blood glucose and its likely competition with 18F-FDG. 25 Therefore, applications of typical clinical human 18F-FDG SUV methods that normalizing for injected dose and subject weight were used in our analyses but for comparison, blood glucose correction was also applied to the measured SUV.
The presence of extensive plaque pathology in older Tg2576 animals that resemble pre-AD Aβ pathology, early AD pathology and late stage AD pathology have been well described. 7 Since human mild cognitive impairment (MCI) and AD subjects exhibit hypometabolic characteristics in selected brain regions, a similar effect in the Tg2576 mice was expected. Both, our in vivo PET findings and ex vivo autoradiographic analyses exhibited decreased 18F-FDG uptake in the cerebrum, whereas cerebellum did not show a decrease. These 2 measures were correlated in select brain regions as shown in Figure 5. It should be noted that in vivo PET measures exhibited a decrease when the blood glucose levels were taken into consideration, and SUVglcs were calculated for all regions. Without the use of blood glucose levels, the Tg2576 mice exhibited an increase in the SUV for all brain regions. However, these differences were not statistically significant.

Correlation of in vivo PET ex vivo autoradiographs. Comparison of difference between 18F-FDG uptake in Tg 2576 and WT mice measured in vivo by PET (SUV and SUVglc) and ex vivo brain slices measured in autoradiographs. CB indicates cerebellum; CP, caudate putamen; FC indicates frontal cortex; HP, hippocampus; SUV, standard uptake value; SUVglc; SUV × glucose; TH, thalamus; WT, wild type.
18F-FDG PET studies have now been reported using at least 7 different transgenic mice models of AD and are summarized in Table 3. The Tg2576 model was studied by 2 different groups, and there was either no change compared to WT 25 or an increase in 18F-FDG at a young age in the Tg2576, whereas the older mice did not exhibit a change. 13 It should be noted that the blood glucose levels were not considered in these reported Tg2576 studies. The increased metabolism seen in Tg2576 is not in keeping with findings from other mouse models of Aβ overproduction, nor of observed AD pathology in human.
18F-FDG Brain PET Studies of Transgenic Mice Models of AD.

Abbreviations: AD, Alzheimer disease; 5×FAD; 5-time familial AD; fMRI, functional magnetic resonance imaging; IP, intraperitoneal; IV, intravenous; SUVR, standard uptake value ratio; WT, wild type.
aTransgenic mice strains, Tg2576, Swedish mutation (APPswe) overexpressing β-amyloid; APP/PS1, Swedish mutation and PSEN1; 3×Tg, APPswe, PSEN1, and MAPT P301 L; 5×FAD, APPswe, APPflorida, APPlondon, PSEN1 M146 L, and PSEN1 L286 V; APP/PS2, Swedish mutation and PSEN2 NIHIL; TASTPM, APPswe, M146 V mutation in PSEN1.
bRoute of 18F-FDG administration.
cBlood glucose (Glc) not used/used for PET analysis.
dAutoradiographic studies using 14C-FDG in APP/PS1 mouse model have been reported to show small decreases of uptake in mice >12 months. 12,34
eMeasured but not used for PET analysis.
fAutoradiographic studies using 14C-FDG in 3×Tg mouse model have been reported to show decreases of uptake in mice 18 months. 35
Increases in 18F-FDG in transgenic AD mice model PET studies have been reported. 28 -31 These studies observed increases in 18F-FDG at younger ages, while in older mice either there were no changes compared to WT or there were increases. The 5-time familial AD (5×FAD) mouse model exhibit increases at younger ages, but there were decreases of 18F-FDG uptake at ages older than 13 months. 28 This has led to a discussion on the role inflammation-related 18F-FDG increases in these mice models and that these mice may not be best suited as models of human AD. It must be noted that without the use of blood glucose correction, our results show an increase in 18F-FDG in Tg2576 mice compared to the WT (Table 1).
Decreases in 18F-FDG in transgenic AD mice model PET studies have been reported. 26,32,33 A triple transgenic model exhibited decreased 18F-FDG uptake, which upon treatment with lipoic acid was recovered to levels similar to WT. 32 Blood glucose levels in all these mice were ascertained to be <45 mg/dL. The APP/PS1 mice exhibited decreased uptake in the thalamus and striatum. 33 Corrections of blood glucose to the PET data in our study were found to be essential to see decreased 18F-FDG in Tg2576 mice. Incorporation of blood glucose levels in the analysis was highlighted in a study of the TASTPM mice model, which showed decreases at 14 months. 26 Several autoradiographic studies using 14C-FDG have been reported in the APP/PS1 model 12,34 and the 3×Tg model. 35 These studies report small decreases in 14C-FDG uptake, although the blood glucose levels in these animals have not been described.
Since NE plays a key role in the activation of BAT, evaluation of BAT activity in the Tg 2576 animals may have the potential to be a surrogate marker for measuring changes in NE. Lower brain levels of NE16 have been reported in Tg 2576 which may suggest lower NE in the sympathetic nervous system. However, further studies are required to demonstrate if changes in NE may be associated to IBAT activity in the Tg 2576 mice. Lower NE levels have been postulated in AD patients resulting in weak adrenergic brain activity. 14,36 Our previous findings with atomoxetine demonstrated that blocking NET elevates BAT metabolic activity due to an increase in NE. 19 There are initial reports that suggest a potential role of atomoxetine in improvement of memory. 37
Following are some of the limitations of the study: (1) the number of animals in the study is small and therefore gender differences were not evaluated, (2) the observation of decreased IBAT in Tg2576 mice is unique, however, because IBAT uptake is temperature-sensitive and can vary significantly, a more controlled setting such as lowered body temperature or pharmacological activation 38 may help confirm differences in NE activation of IBAT between Tg2576 and WT mice and may serve as a biomarker for earlier diagnosis and development of treatment strategies for AD. 39 Additionally, increasing the number of animals may enhance statistical significance of the difference in uptake.
Conclusion
Transgenic mouse model Tg 2576 was seen to have decreased brain metabolism compared to WT when SUVglcs were compared, but the differences were not significant (P > .05). Intrascapular brown adipose tissue metabolism in Tg 2576 compared to WT animals was significantly reduced. Inclusion of blood glucose in the PET data analysis was necessary for accurate analysis. Autoradiographic analysis using corpus callosum as a reference region indicated decreased metabolism in several brain regions of Tg 2576 mice. In vivo PET findings correlated with ex vivo autoradiographic results.
Footnotes
Acknowledgments
The authors thank Dr Elizabeth Head for helpful discussions, Dr Vitaly Vasilevko for thioflavin staining of mice brain sections, and Dr Cristian Constantinescu for assistance with the PET data analysis.
Declaration of Conflicting Interests
The author(s) declared no potential conflicts of interest with respect to the research, authorship, and/or publication of this article.
Funding
The author(s) disclosed receipt of the following financial support for the research, authorship, and/or publication of this article: Funding by NIH grant AG029479 is acknowledged.