
Abstract
2-[11C]Thymidine (TdR), a PET tracer for cellular proliferation, may be advantageous for monitoring brain tumor progression and response to therapy. We previously described and validated a five-compartment model for thymidine incorporation into DNA in somatic tissues, but the effect of the blood–brain barrier on the transport of TdR and its metabolites necessitated further validation before it could be applied to brain tumors. Methods: We investigated the behavior of the model under conditions experienced in the normal brain and brain tumors, performed sensitivity and identifiability analysis to determine the ability of the model to estimate the model parameters, and conducted simulations to determine whether it can distinguish between thymidine transport and retention. Results: Sensitivity and identifiability analysis suggested that the non-CO2 metabolite parameters could be fixed without significantly affecting thymidine parameter estimation. Simulations showed that K1t and KTdR could be estimated accurately (r = .97 and .98 for estimated vs. true parameters) with standard errors < 15%. The model was able to separate increased transport from increased retention associated with tumor proliferation. Conclusion: Our model adequately describes normal brain and brain tumor kinetics for thymidine and its metabolites, and it can provide an estimate of the rate of cellular proliferation in brain tumors.
Introduction
Labeled thymidine (TdR) has been used extensively for many years to measure DNA synthesis rates and cell cycle kinetics in cell lines and animal models [1–4]. These measures have also been correlated with the effectiveness of chemotherapeutic agents [5,6]. Thymidine is useful as a tracer for cellular proliferation, because it is the only nucleoside that is incorporated into DNA, but not RNA. However, predictions of response to chemotherapy from growth studies of biopsied tumor cells exposed to cytotoxic tumor agents can be misleading due to the significant heterogeneity of human tumors and the inability of in vitro studies to reproduce all in vivo factors that affect tumor growth [6]. Our group has investigated PET imaging using 2-[11C]TdR as a quantitative, in vivo method of evaluating tumor cellular proliferation (summarized in Mankoff et al. [7] and Krohn et al. [8]).
2-[11C]TdR is rapidly catabolized in vivo, first by the enzymatic cleavage of the sugar and then by reduction and ring opening [1]. This results in a kinetic image set that includes 11C-labeled metabolites, as well as labeled DNA [9–12]. Quantitative assessment of tumor proliferation using [11C]TdR PET therefore requires kinetic analysis to estimate the rate of TdR incorporation into DNA and to separate the contribution of labeled metabolites to the tumor image.
We previously described a five-compartment model that has been validated for somatic tissues and successfully applied to patient studies [13]. The model could accurately predict the thymidine incorporation rate into DNA in simulations, and it could predict the time course of TdR incorporation into DNA in an animal model [13,14]. However, the effect of the blood–brain barrier (BBB) on the transport of TdR and its metabolites into the normal brain and brain tumors necessitates further validation of the model before it can be applied to brain tumors. In particular, the intact BBB restricts the transport of thymidine into the central nervous system [15]; however, BBB disruptions can be caused by invasive tumor extensions or as a result of therapy [16]. Therefore, kinetic analysis of TdR brain images must be able to distinguish between increased thymidine exchange across a damaged BBB (transport) and increased DNA synthesis in a proliferating tissue (retention). In addition, while the BBB restricts thymidine transport, it is much less a barrier to the passage of the principal metabolite, [11C]CO2, and so while CO2 is a minor contributor to somatic tumor imaging, it causes a high background in the normal brain. The contributions of thymidine and CO2 can be separated by performing sequential CO2 and TdR studies (requiring the administration of two radiotracers) and analyzing their behavior by fitting their image derived time–activity curves (TACs) to the compartmental model simultaneously. This is different than for somatic tissues, where a single injection of TdR with metabolite analysis is sufficient.
We present here tests of the behavior of the [11C]TdR model under conditions experienced in the normal brain and brain tumors. We also present simulations that test the ability of the model to estimate the thymidine flux constant into tumor DNA using data of the quality gained from a typical [11C]TdR PET brain study and simulations that determine how well the model can distinguish between thymidine transport and retention. In the companion article, we present the model analysis of patient data [17].
Materials and Methods
General Considerations
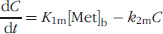
2-[11C]TdR is a tracer for the salvage pathway of extracellular thymidine incorporation into DNA [1]. Kinetic analysis of 2-[11C]TdR images is used to estimate the thymidine flux along this pathway as a measure of cellular proliferation. The flux of thymidine from the blood into DNA (FluxTdR, in μmol/min/g) can be described as the product of the native (unlabeled) thymidine blood concentration ([TdR]b, in μmol/mL) and a flux constant (KTdR, in mL/min/g) [13]:

Since the concentration of native thymidine in the blood is not easily measured, the flux constant, KTdR, is typically used as the indicator of thymidine incorporation into DNA.
In addition to incorporation into DNA, thymidine is catabolized by thymidine phosphorylase to thymine, reduced to dihydrothymine (DHT) and then to β-ureidoisobutyric acid (BUIB) and β-aminoisobutyric acid (BAIB) (see Figure 1) [1]. For thymidine labeled at the ring-2 position, the only radiolabeled degradation product after BUIB is [11C]CO2 [12]. Degradation occurs rapidly in the liver and blood, and significant quantities of labeled metabolites are present in the blood within minutes of the injection (see Figure 2). The contribution to the total activity in PET images due to labeled metabolites must therefore be accounted for in the kinetic analysis.

Possible fates of thymidine in vivo. Pathway to incorporation into DNA proceeds from left to right; degradation pathway proceeds downwards. TMP = thymidine monophosphate, TDP = thymidine diphosphate, TTP = thymidine triphosphate, DHT = dihydrothymine, BUIB = β-ureidoisobutyric acid.

Time course of thymidine and labeled metabolites in the blood for a typical patient study: (A) TACs over 60 min following injection. (B) Expanded view of TACs for 6 min following injection.
The Model
The kinetic model for 2-[11C]TdR that has been validated for somatic tumors is shown in Figure 3 [13,14]. The reader is encouraged to refer to our previous publications describing and validating the thymidine kinetic model for somatic tissues [13,14]. The three compartment sets that describe the behavior of thymidine, CO2, and non-CO2 metabolites ([11C]thymine, [11C]DHT, and [11C]BUIB) are driven by three input functions measured from arterial blood sampling and metabolite analysis. A number of assumptions that simplify the model are listed below but are described more completely in our previous article [13].

Compartmental model for 2-[11C]TdR.
We assume that blood flow and capillary transit are the primary barriers to tracer uptake into tissue; transport across cell membranes is not a rate-limiting step [18,19]. This allows the use of a single rate constant K1t to model thymidine delivery to tissue. Once the tracer is in the tissue, the incorporation of thymidine triphosphate (TTP) into DNA is the rate-limiting step [19,20], so the reversible thymidine tissue compartment (A) includes intracellular thymidine and thymidine nucleotides, and it can be referred to as the DNA precursor pool [1]. Labeled thymidine in the tissue compartment can leave the cell as thymidine or as a degradation product at any point in the salvage pathway before TTP incorporation [18,20,21], which allows a single rate constant k2t to describe label transported from the tissue into the plasma. The fixed thymidine tissue compartment (B) represents thymidine incorporated into DNA; this is irreversibly bound over the time course of the study, and so a single first-order rate constant k3t can describe DNA incorporation.
We assume that the contribution of labeled non-CO2 degradation products to the total brain image activity is small, and that thymine, DHT, and BUIB are not trapped in the tissue, except in organs such as the liver, where they are degraded [1]. The non-CO2 metabolites can therefore be modeled using a single compartment (C) with two rate constants K1m (transport from blood to tissue) and k2m (transport from tissue to blood). The reversible CO2 tissue compartment (D) represents labeled CO2 and bicarbonate that are reversibly transported into tissue; the fixed CO2 tissue compartment (E) represents labeled CO2 that has been incorporated into molecules and trapped in the tissue. The behavior of CO2 can therefore be described by four rate constants: K1c (transport from blood to tissue), k2c (transport from tissue to blood), k3c (incorporation into molecules in tissue), and k4c (transport from molecules into the reversible tissue compartment) [22,23]. This has been previously validated for both the normal brain and brain tumors. As in previous studies, we assume that k3c = k4c [22].
We also assume that the thymidine, CO2, and metabolite compartment sets are independent and driven by three separate components of the blood input function. This is only justified for tissues where local degradation of thymidine is negligible compared to blood delivery, including the normal brain and brain tumors [1]. The following differential equations characterize the model:


The total image activity (in μCi/g) is given by the sum of the activities in each compartment plus the activity that is in the blood volume (Vb) contained in the tissue: Total Tissue Activity

An additional parameter Δt is required to correct for the relative delay between the arterial sampling site and the tissue of interest. The thymidine flux constant is given by the product of the transport rates of thymidine from blood to tissue and from tissue to DNA divided by the sum of the rates of efflux from the reversible tissue compartment as shown in Equation 8.

Our previous experience with somatic tumors suggests that it is not possible to estimate all of the thymidine compartment parameters accurately [13]. Model analysis required simplifying assumptions, with some parameters fixed to reasonable values in the parameter estimation process. The key parameters necessary to describe thymidine incorporation into DNA are the flux constant, KTdR, and the thymidine blood–tissue transport rate, K1t, both measured in milliliters per minute per gram.
The expected ranges of the model parameters are listed in Table 1; thymidine compartment values were established from prior studies of thymidine [1,19,24–27], including our previous experience with somatic tumors [14,28]. For all but K1t and K1m, the ranges of thymidine and non-CO2 metabolite parameters would be expected to be similar for brain tumors and somatic tumors. This was supported by analysis of our preliminary brain tumor studies [29]. In the brain, thymidine transport from capillaries into the intracellular fluid is limited by the BBB. The thymidine blood–tissue transport rate constant is less than 3% of the water transport rate [15] and, therefore, the expected range of K1t is determined from the expected range of cerebral blood flow multiplied by 3%. The transport of non-CO2 metabolites (mostly thymine and DHT) across the BBB is expected to be similar to thymidine [15]. The expected size of the CO2 tissue compartment (K1c/k2c) and the expected range of CO2 fixation rates (k3c) come from studies of [11C]CO2 in the normal brain and brain tumors [23,30–32].
Thymidine Model Parameters, Expected Ranges, and Starting Values

References for expected ranges:
K1m and DVm: Ref. [1]
K1c: Ref. [23]
DVc: Ref. [23]
Preliminary analysis (data not shown) suggested that reparameterization from K1 and K1/k2 to k2 and K1/k2 would give higher accuracy, so influx constant parameters were calculated as tissue distribution volumes (DV = K1/k2) with units of mL/g. The model parameters used in parameter estimation were therefore k2t, k3t, DVt, k2c, k3c, DVc, K1m, DVm, Vb, and Δt.
Model Parameter Estimation: Mathematical Analysis and Simulations
The model has 10 parameters. It is unreasonable to expect that this number of parameters can be estimated accurately from three input curves that have relatively similar time courses and an inherently noisy tissue TAC, so the mathematical behavior of the model was explored to determine the ability to estimate parameters in the thymidine compartment set and to establish the most reliable approach for parameter estimation.
Sensitivity curves were used to estimate the effect that a change in an individual parameter has on the output of the model [33–35], that is, the computed tissue TAC. The sensitivity function for a parameter kα with a change of ± δkα is given by Equation 9 [33,35].

Sensitivity analysis was performed using the modeling package Berkeley–Madonna (University of California, Berkeley, CA) and the spreadsheet program Excel (Microsoft, Redmond, WA), using a change of ± 5% of each parameter value and starting values representative of a proliferative tumor (listed in Table 1). The starting values were chosen based on our previous work and the initial analysis of the patient data discussed in the companion report [17] so that the sensitivity analysis was performed on a simulated curve representative of a tissue TAC typical of a high-grade glioma from our patient set.

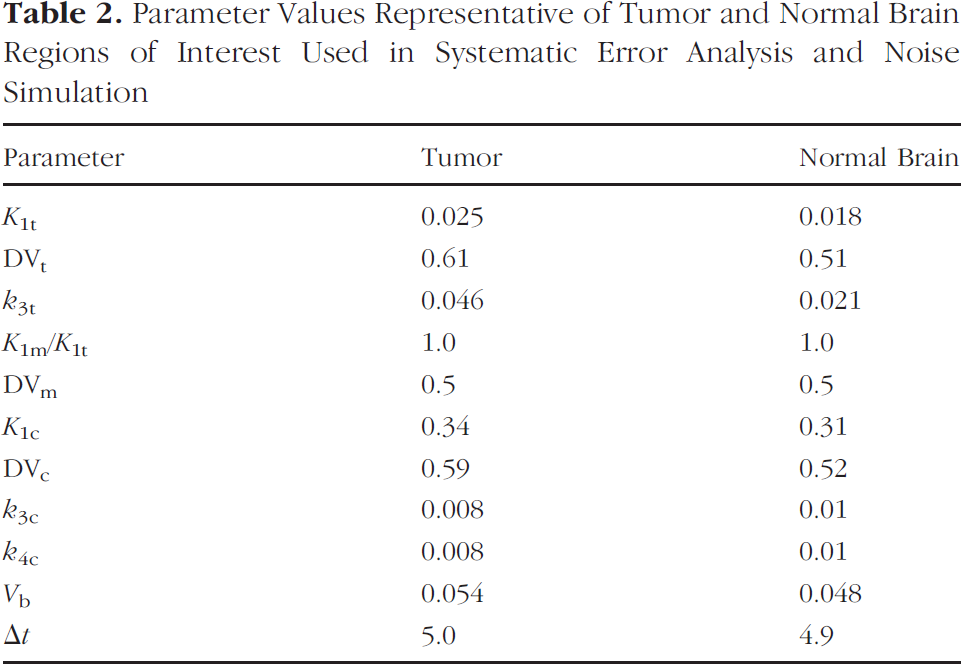
Parameter Values Representative of Tumor and Normal Brain Regions of Interest Used in Systematic Error Analysis and Noise Simulation
To determine our ability to estimate parameters in the thymidine compartment set and establish the most reliable approach for parameter estimation, we tested model parameter estimation with a set of simulated curves. A set of typical blood input functions was created by smoothing a set of typical patient blood curves. These were used to generate a series of tissue TACs with known parameters and a time step of 0.02 min; the curves were then summed over the time intervals used for a typical thymidine PET study to create a set of perfect tissue curves with known parameters representative of those obtained from a standard dual injection CO2/TdR patient study.
Analysis was performed to determine the extent of the systematic error that would be introduced in estimation of KTdR and K1t by fixing parameters that the identifiability and sensitivity analysis suggested should be constrained. Simulated curves were created as described above, allowing each parameter investigated (K1m and DVm) to vary over the range listed in Table 1, while the other parameters remained fixed at reasonable values (listed in Table 2). Model parameters were estimated in each case by optimizing the model fit of the simulated data using the SIMPLEX algorithm in Berkeley–Madonna, with a time step of 0.02 min, a stopping criterion of a change of less than 1 × 10⁻⁴ in the model parameters, and a weighting factor of counts per duration as an estimate of the relative statistical noise on each data point. The size and standard deviation of the bias introduced by fixing the parameters were calculated from the percentage difference between the actual and estimated thymidine transport and flux constant.
Tissue TACs obtained from PET studies are inherently noisy. In order to establish the effect that this has on model estimates of KTdR and K1t, we determined the average noise level present for brain tumor and normal brain regions of interest (ROIs) in our patient data. We created simulated curves as described above with parameters representative of brain tumor and normal brain (Table 2), and then added Poisson noise to produce a series of noisy simulated curves representative of typical patient data from tumor and normal brain. The noise level was such that the 55–60-min time point had a coefficient of variation of 1%. This is lower than that used for somatic tumors since the brain images are acquired in 3-D and the count rate is higher, reducing the statistical variability seen in patient curves. The noisy simulated curves were optimized, and the estimated and actual values of thymidine transport and flux constant were compared to determine the extent of the bias in parameter estimation due to noise.
To ensure that thymidine parameter estimation would be accurate across the entire expected clinical range, we also generated a series of 200 noisy simulated curves as described above, except that the 10 parameter values (k2t, k3t, DVt, k2c, k3c, DVc, K1m, DVm, Vb, and Δt) were randomly selected from between the maximum and minimum values listed in Table 1 to create curves representing a range of parameter values. This resulted in flux constants between 0 and 0.1 mL/min/g, which are similar to those seen in our initial analysis of patient studies. The curves were optimized with the non-CO2 metabolite parameters constrained to the values listed in Table 1, and the estimated and true parameter values were compared. The correlation coefficient between actual and estimated values, the percentage bias, and the standard error of the estimate (SEE) divided by the mean, which gives an approximation of the associated error, were calculated for each parameter. This simulation also tested the model's ability to separate increased transport due to a severely damaged BBB from increased retention due to a highly proliferative tumor.
The Correlation Matrix

Values in
To test whether the parameter starting values used for the optimization procedure (Table 1) were unduly biasing the results, the previous simulation was repeated using randomly selected start parameters within 20% of the original values. The correlation coefficients and standard deviations between the estimated and true parameter values were again calculated, as was the SEE for each parameter, and these were compared to the figures obtained from the original analysis to determine whether the start position affected the result.
Results
The sensitivity curves are shown in Figure 4. The sensitivity functions for k3t and k3c are qualitatively similar except for those very close to the peak thymidine tissue concentration, as are those for Vb and Δt. The sensitivity curves for K1m and DVm are small in magnitude compared with those for K1t, K1c, DVt, and DVc, because there is a relatively small quantity of labeled non-CO2 metabolites in the blood. It is therefore unlikely that the non-CO2 metabolite parameters can be estimated independently.
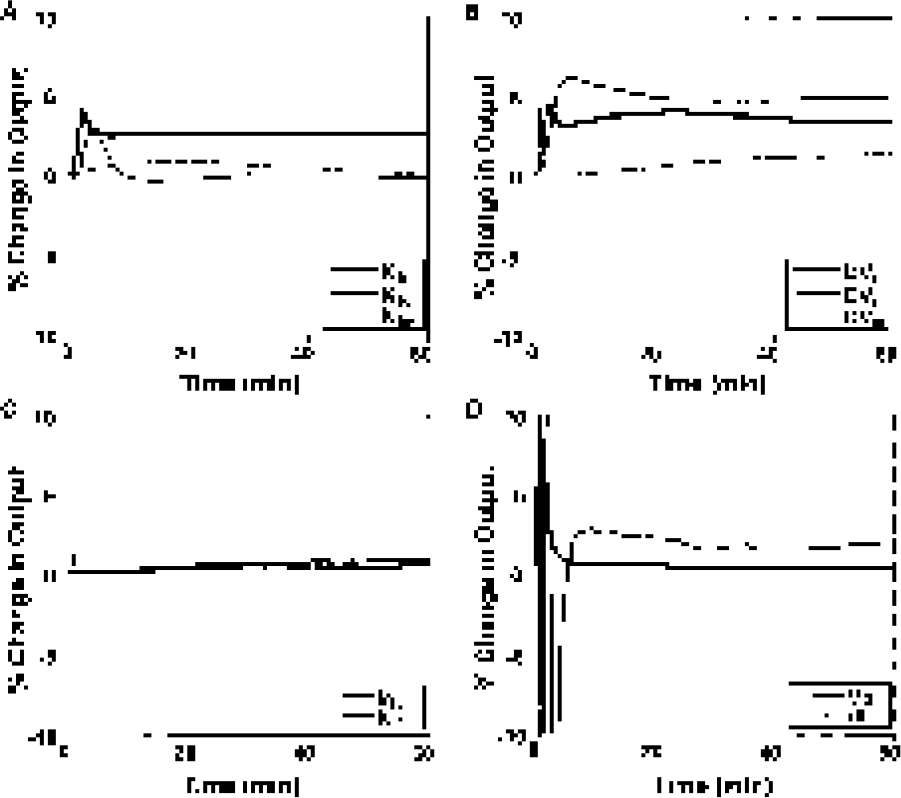
Sensitivity functions—percentage change in model TAC for a ±5% change in the parameter: (A) K1 parameters, (B) DV (=K1/k2) parameters, (C) k3 parameters, (D) blood volume (Vb) and relative delay between sampling site and tissue of interest (Δt) (reduced scale).
Bias in Thymidine Flux Constant and Blood–Tissue Transport Resulting from Constraint to Extreme Values

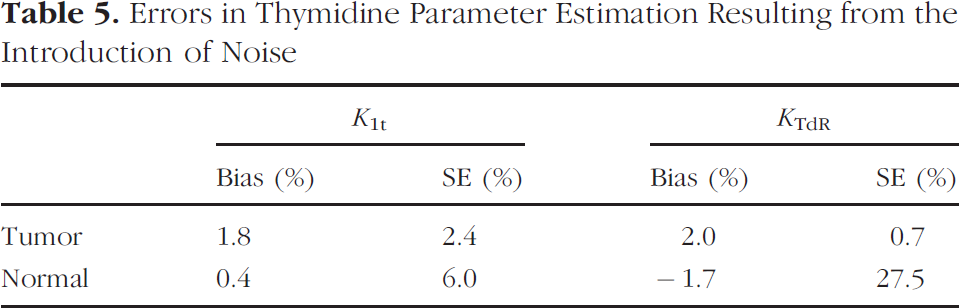
Errors in Thymidine Parameter Estimation Resulting from the Introduction of Noise
The correlation matrix is given in Table 3. There is a high level of covariance (correlation coefficient of approximately ± 1) between K1t and DVt. There is also a high correlation between the thymidine and the non-CO2 metabolite parameters. This result and the low model sensitivity to K1m and DVm suggest that they can be fixed without introducing large errors into the thymidine parameter estimates. The CO2 distribution volume (DVc) and fixation rate constant (k3c) are covariant, but unlike the somatic tissue model, there is no significant intercompartmental covariance, because we are using a separate injection of [11C]CO2.
Because the sensitivity and identifiability analysis suggested that K1m and DVm could not be reliably estimated, we tested if these parameters could be fixed without introducing significant error into the thymidine parameter estimation. Analysis was performed to determine the potential bias resulting from the constraint of these parameters, and the results are shown in Table 4. The simulation showed that the maximum bias in thymidine flux constant (KTdR) resulting from the constraint of these parameters is +11% to −22%, seen at the extremes of the expected range for the non-CO2 metabolite distribution volume. The maximum bias in the thymidine transport constant (K1t) resulting from the constraint of these parameters is −0.3% to −9%, seen at the extremes of the expected range for DVm and K1m. The root mean square biases of KTdR across the expected possible range of the fixed parameters were 2% for K1m and 13% for DVm. The root mean square biases for K1t were 3% and 7% for K1m and DVm, respectively.
The results of the simulation to investigate the effect of noise on parameter estimation for curves representative of tumor and normal brain tissues are shown in Table 5. It can be seen that noise introduces a bias of less than 2% in both tumor and normal brain thymidine transport and flux constant estimation. However, the standard error of the percentage differences between actual and estimated parameters is much greater for normal tissue than for tumor, particularly in the estimation of thymidine flux constant, reflecting the very low level of uptake in the normal brain.
The results of the simulation to determine the accuracy of parameter estimation across the entire clinical range is shown in Figure 5 and is summarized in Table 6. The estimation of the thymidine flux constant is accurate across the clinical range except at extremely low flux constant levels, comparable to those seen in normal brain tissue. The correlation coefficients for estimated versus true are low for k3t and DVt (r = .48 and .42, respectively) but high for both K1t and KTdR (r = .97 and .98, respectively) as predicted by the sensitivity and identifiability analysis. The percentage bias in the estimation was 5% for K1t and 7% for KTdR, and the SEE/mean was less than 15% for both.

Result of simulation using parameters from across the expected clinical range (n = 200 for each plot).
The repeated analysis showed that randomizing the start position of the optimizer did not significantly change the correlation between actual and estimated parameter values (r = .98 for both K1t and KTdR), or change the bias or the standard error associated with K1t and KTdR (biases = 5% and 6%, SEE/mean = 12%), suggesting that using fixed start parameters in the optimization process does not adversely affect the results. A number of alternative model parameterizations were also tested (data not shown), including the estimation of thymidine transport and retention from a single injection of [11C]TdR (i.e., no [11C]CO2 study). However, the correlation coefficients for estimated versus true parameters were significantly lower for both K1t and KTdR (r < .7), suggesting that no further model simplification was justified.
Discussion
The rate of cellular proliferation is an important feature of tumor behavior that provides advantages for monitoring tumor progression and response to therapy. PET imaging with [11C]TdR provides a noninvasive method of quantifying the rate of cellular proliferation in tumors [14], and changes in thymidine flux constant over serial scans may be an early predictor of response to therapy [28]. Thymidine is rapidly catabolized, resulting in an image that includes 11C in the form of metabolites, as well as labeled DNA [1,12]. Quantitative assessment of tumor proliferation using [11C]TdR PET therefore requires kinetic analysis to estimate the rate of TdR incorporation into DNA. We previously validated a model for somatic tissues and demonstrated that it could accurately predict thymidine incorporation into DNA [14]. However, the effect of the BBB on the transport of TdR and its metabolites into the brain necessitated further validation of the model before it could be applied to brain tumors. We have presented studies that characterize the behavior of the model in the brain, and simulations that test its ability to estimate thymidine flux into brain tumor DNA and to separate retention from transport.
Correlation Values between Estimated and Actual Values across Expected Clinical Range

The analysis showed that reparameterization of the model would improve parameter identifiability, and that the model was not sensitive to changes in the non-CO2 metabolite parameters, so they needed to be tightly constrained in parameter estimation. This constraint resulted in acceptable errors in the estimation of the important parameters, K1t and KTdR. Although there is significant covariance between some of the model parameters, the simulations suggest that it is possible to estimate the thymidine DNA incorporation rate and to separate the effects of increased transport across a damaged BBB (K1t) and increased retention due to DNA proliferation (KTdR). This model cannot independently estimate k3t and DVt reliably. Analysis also showed that it was not possible to reliably estimate the thymidine flux constant or thymidine transport without the additional information provided by the separate [11C]CO2 study. Kinetic analysis of thymidine brain images therefore required a dual CO2/TdR study to reduce parameter estimation errors.
In a previous publication, we reported ratios of lesion K1t/normal brain K1t and lesion KTdR/normal brain KTdR as a means of comparing the thymidine transport and flux into the tumor to that in the normal brain [29]. Simulations presented here showed that this would introduce a significant source of error, as the lower level of tracer transport into the normal brain results in variability in the normal brain estimates of thymidine flux constant and transport. In simple terms, the reference in the denominator of the ratio should not be the noisy parameter. Instead, the ratio of KTdR to K1t may be a useful measure for distinguishing between increased transport and increased retention in the tumor.
Conclusion
Our model adequately describes normal brain and brain tumor kinetics for 2-[11C]TdR and its metabolites. The thymidine retention can be estimated with a standard error of approximately 10%, and thymidine transport can be estimated with a standard error of approximately 15%. The thymidine kinetic model is applied to patient data in the companion report [17].
Footnotes
Acknowledgments
This work was supported by NIH grant P01 CA42045.