
Abstract
Introduction:
Most high-speed cell sorters rely on droplet generation technology to create statically charged, particle containing droplets triaged at high throughput based on distinct characteristics of the targets. Normally, aerosols generated through the droplet breakoff process are constantly removed as waste or pulled away from the operator by the negative pressure dynamics created by an Aerosol Evacuation System (AES). However, if the AES integrity has been compromised, aerosols produced by a stream diversion event may potentially expose the environment and the operator to any potentially hazardous material that is being sorted. Standard methods to validate the integrity of the AES rely on the collection of aerosolized beads that escape the front of a sorter during a simulated stream diversion event. Although much improved compared with previous versions, the assay still requires 1–2 h to perform.
Methods:
We use a simple airflow meter in conjunction with an original set of 3D printed holders and a hot wire anemometer to measure vacuum created by the AES at two locations within the flow cytometer.
Results:
Here, we describe Air-VELoCheck, an airflow velocity assay to monitor AES integrity. The assay was validated against the standard aerosol containment assay and takes <15 min to perform, representing an approximate 75–88% reduction in assay time.
Conclusions:
Our findings support the need to accelerate efforts toward the integration of real-time monitoring of AES performance, particularly for laboratory operations requiring biosafety containment, to quickly diagnose alterations in aerodynamics that can be confirmed using other orthogonal assays.
Introduction
Since the introduction of the cell sorter in the mid-1960s, the ability to sort droplets containing cells into pure populations based upon individual particle characteristics has enabled huge advances in the fields of biology and other life sciences throughout the years.1–2 The addition of a vacuum-exhausted tube allowed the undeflected waste stream of a cell sorter to be captured, pulling it away from the operator to minimize potential exposure to aerosols. 3 Previously, undeflected waste was collected in a glass beaker located at the bottom of the sort collection chamber. In addition to microdroplet aerosols being generated in the droplet formation process, Merrill elegantly demonstrated that the very act of collecting the waste in a beaker generated secondary aerosols as well. 3 The aerodynamic diameter of aerosols generated in an induced “failure” mode at 70 psi was first characterized using an Aerodynamic Particle Sizer. The highest concentration of aerosols detected ranged from 0.5 μm to 3 μm. 4 In addition to the vacuum tube to remove the undeflected waste stream, some manufacturers included an aerosol evacuation or management system under vacuum to pull aerosols, whether generated by normal operation or during a clogged nozzle event, away from the instrument and through a High-Efficiency Particulate Air (HEPA) filter.
Concern over operator exposure to aerosols during sorting of potentially hazardous materials5–7,13 has led to various methods to measure aerosol containment over the years. Petri dishes containing lawns of Escherichia coli bacteria were placed at various locations around the sort collection chamber of a cytometer. Running T4 bacteriophage as a sample, the waste stream was intentionally deflected. Deflected aerosols created clear plaques when T4-containing droplets landed within the petri dishes, and the plaques were subsequently counted. 3 One major drawback to this method was the 8-h incubation period needed for plaque formation. Radionuclide Technetium-99m was used in nuclear medicine diagnostic imaging, and a high-resolution germanium gamma-ray detector was also used to quantifiably assess aerosol containment inside and outside of a cell sorter. 8 Although considered highly sensitive and relatively safe, it can only be implemented at institutions that have access to radiation safety expertise and are licensed by the Nuclear Regulatory Commission. In addition to the regulatory issues, the sorter down time needed for the radionuclide to safely decay (up to 60 h) renders this containment assay impractical for most institutions.
Fluorescent Glo Germ particles and the AeroTech concentrator were used to collect and deposit aerosol droplets onto a glass slide. 9 Glo Germ particles deposited on the slides were subsequently counted under a fluorescent microscope. This aerosol detection method was an improvement over the T4 method and allowed for same-day measurement of the Aerosol Evacuation System (AES) integrity prior to sorting potentially hazardous materials. In 2014, the International Society for Advancement of Cytometry (ISAC) Biosafety Committee introduced the recommendations of testing aerosol containment using the Glo Germ particles and the AeroTech concentrator to validate the AES integrity of cytometers at the BSL-2 level and above. 10 In 2019, disposable Cyclex-d impactor cassettes, along with Dragon Green (DG) beads, improved upon the AeroTech, Glo Germ method. 11 Use of the disposable cassettes avoided the meticulous cleaning of the AeroTech device that was needed between each containment test and had the advantage of concentrating bead deposition to the area of a coverslip rather than over an entire glass slide, thus saving time analyzing the slide.
The need for a functional AES was demonstrated when the number of Glo-Germ-containing aerosols detected increased as the AES vacuum was reduced. 9 This was again confirmed by inserting a valve into the hose connecting a Buffalo AES unit to a flow cytometer and regulating the amount of vacuum supplied to the sorter. Using Cyclex-d impactor cassettes and DG beads, no beads were seen at a vacuum velocity above 527.8 Linear Feet per Minute (LFM). Below that velocity, the number of beads increased as the AES vacuum velocity decreased. 11
While significantly improved over time, the current testing protocol to demonstrate AES integrity by aerosol containment testing remains time-consuming, still requiring an estimated 1–2 h to perform for a trained operator. 15 In a BSL-2 setting, containment testing is recommended monthly or upon an AES filter change. For high-containment BSL-3 or BSL-4 laboratories, testing is recommended weekly or before every sort depending upon a risk assessment of the material to be sorted. 10 In addition, in BSL-3 or BSL-4 facilities, adaptations must be made to the fluorescent microscope for the operator to search for beads on the glass slides while wearing adequate personal protective equipment. The testing time and high-containment laboratory impediments indicate the need for an easy, rapid testing protocol that can ensure the integrity of the AES and collection chamber on a daily basis prior to sorting. 13 Here, using a small airflow velocity meter, unique 3D printed holders and a hot-wire anemometer, we developed a quick and relatively inexpensive assay to measure the AES vacuum airflow on a flow cytometer. Our findings provide a novel solution toward real-time monitoring of AES performance, particularly in high biosafety containment, to quickly diagnose issues that can be confirmed using other orthogonal assays.
Materials and Methods
Airflow Velocity Measurements
The ABM-200 Airflow & Environmental Meter (CPS Products, Inc. Hialeah, FL) was used due to its compact size (L 8.6 cm × W 4.5 cm). The meter is used commercially to measure HVAC airflow and measures airflow between 44 and 12,320 LFM with ±0.5% accuracy across its entire flow rate range and connects wirelessly to the downloadable CPS Link™ software app (CPS Products, Inc., Hialeah, FL). For AES airflow measurements, the AES was turned on, and the biosafety cabinet (BSC) power was turned off to coincide with the conditions used for aerosol containment measurements described below. AES airflow measurements were performed by inserting the ABM-200 meter inside the various 3D printed holders described below, placing the 3D printed cap on top to secure it in place and then inserting it into the AES port of the cytometer as far as possible. The collection chamber door containing the chamber prefilter was closed. The airflow meter readings were allowed to stabilize for at least 15 s before a measurement was taken using the CPS Link software app. Measurements were recorded for each different holder. Between measurements, the plastic holder was removed from the AES port until the meter readings returned to zero before inserting the holder back into the AES port for subsequent readings. For AES vacuum airflow measurements at the chamber door, the AES was turned on and the BSC power was turned off as described above. In addition, the cytometer was also turned off to measure AES vacuum independent of cytometer and laser cooling fan interference. To measure AES vacuum airflow at the chamber door, part of a file folder, with an approximate 25 mm diameter hole cut out of it, was taped to the front of the collection chamber door to block most of the airflow through the closed door. Vacuum airflow was directed through the anemometer probe by using Sugru moldable glue (FormFormForm Ltd, London, UK) to form an oval-shaped cone on one side and a slit on the other side to hold the probe of a hot wire anemometer (VelociCheck Air Velocity Meter Model 8340; TSI, St Paul, MN). The anemometer base was placed on a Styrofoam support, while the molded cone with the anemometer probe was placed over the opening in the file folder. The anemometer was placed in the 12 s slow response mode. Measurements were in LFM and were manually recorded after the peak reading had stabilized for ∼10 s.
3D Printing of Meter Holders
Autodesk Tinkercad 3D modeling software (Autodesk, San Francisco, CA) was used to design multiple holders for the airflow meter and saved in the STL format. The holders were printed at the NIH Library using either the Stratasys F270 or Stratasys F370 professional-level 3D printers (Stratasys Minnetonka, MN) utilizing acrylonitrile butadiene styrene. Both printers use fused deposition modeling technology and feature dissolvable supports that were melted away after printing. Multiple holders were printed with the posterior opening increasingly restricted, for example, 20, 18, 16, 14, 12, 10, and 8 mm. A 0.04-inch-thick rubber furniture padding (PremiFix) was cut into approximate 66 × 15 mm strips that were then applied to the posterior outer circumference of each holder, leaving the bottom part of each holder exposed. This allowed for a snug fit when holders were placed into the AES port of the cytometer. Two variations of meter holder lids were also printed. One lid had an opening in the top allowing the airflow meter to be held securely. The other was completely closed at the top and was used without the meter in place during aerosol containment testing. 3D printing files are available at 10.5281/zenodo.17209861.
Flow Cytometry Instrument
All experiments were performed using a Becton Dickinson FACSymphony S6 sorter (BD Biosciences) enclosed within a Baker BD400 Class II BSC (Baker, Sanford, ME) and with an integrated AES. Upon installation, adjustments were made to limit gaps between the rubber gasket surrounding the sort chamber. AES performance was confirmed using the aerosol containment testing as described below. A third-party contractor performed the certification of the BSC at installation and annually thereafter.
Aerosol Containment Testing
Allergenco-D cassettes (Environmental Monitoring Systems, Inc., Charleston, SC) and 1.0 μm DG beads (Excitation 480 nm; Emission 520 nm; Bangs Laboratories, Fishers, IN) were used to collect aerosols. Allergenco-D cassettes were used instead of Cyclex-d cassettes due to Cyclex-d cassettes no longer being manufactured. The cassette vacuum source was an e-MaxX pump (Environmental Monitoring Systems, Inc., Charleston, SC) set to 20 L/m of vacuum (∼2,076 LFM). The ABM-200 airflow meter was not inside the various sized plastic meter holders during bead testing. A closed 3D plastic cap was placed on top of each holder before it was inserted fully into the AES port of the cytometer before aerosol containment testing was performed. For aerosol testing, the AES system was on and the BSC power was off. An Allergenco-D cassette was placed in front of the closed collection chamber door on a support that kept it 10 cm high and 3 cm away from the chamber door and facing the right-side door frame. The sort chamber door was closed, and the collection tube holder top was in place to reduce vacuum airflow dilution around the sort chamber. Aerosols were collected for 10 min with the cytometer placed in a simulated “failure” mode created by placing plastic tubing over the waste collection trough within the sort chamber while the waste drawer was retracted. The DG beads were run as a sample with a throughput rate between 45,000 and 50,000 events per second. The Allergenco-D coverslips were inverted onto a glass slide, and the beads were counted using a Nikon Labophot fluorescent microscope (Nikon Corp., Minato City, Tokyo, Japan).
Airflow Velocity Measurement
Aerosol containment testing was performed as described above. An instrument-specific aerosol containment response curve was established using a series of restricted opening 3D meter holders. The holders were printed, modified with rubber strips to create a snug fit within the AES vacuum port, and placed into the AES port. Three consecutive aerosol containment tests were performed for each holder. The airflow meter was not in the holders during this aerosol containment testing phase, but the closed cap was attached. AES vacuum airflow readings were correlated with the aerosol containment results. From largest to smallest, the holders were inserted into the AES port. The airflow meter and the snug fit open cap were included for each holder during these measurements. The front grille door was closed for ∼15 s to allow the velocity reading to stabilize before a smartphone with the CPS Link software app was used to record a “snapshot” of the velocity. Each holder was removed until the meter’s fan blades stopped rotating and then reinserted for a total of ten consecutive times per holder. To obtain front grille airflow readings, front inflow air was blocked with a paper file folder, except for an opening of ∼25 mm in diameter that was cut out to match the size of the AES port in the back of the chamber. Using moldable glue, a holder was fashioned to secure the probe of a hot wire anemometer and was placed in front of the small front grille opening with the anemometer attached. From largest to smallest, the holders were inserted into the AES port. The airflow meter was not inserted into the holders, but the closed cap was attached. The anemometer reading was allowed to stabilize and remain constant for ∼10 s before the measurement was recorded. The anemometer and its molded glue holder were removed from the front grille before replacing the anemometer and holder in front of the unblocked front grille opening for additional measurements. Anemometer velocity measurements were taken for each of the five different 3D printed holders.
Results
Design of the Airflow Meter and 3D Plastic Meter Holder System
For flow cytometry-based high-speed cell sorting, a specimen is typically introduced via the sample injection port, then particles are further carried via the sheath fluidics to the sort chamber, where the stream is broken into droplets that are selectively charged and electrostatically directed into collection tubes during sorting. Aerosols created in this process or during a stream diversion event are collected by negative pressure at the AES port, which is further connected to a HEPA filter (Figure 1A). Once identified as a central point, we set to delineate a strategy for rapid evaluation of airflow dynamics at the AES port (Figure 1B). Within the collection chamber, the AES evacuation port sits at the far end with a large flat ledge at its base and three sides that angle to form the opening (Figure 1C-a). To evaluate the impact of variability in our measurements, the airflow meter was first placed on the ledge in front of the AES port, and consecutive measurements were collected (Figure 1C-b). Airflow velocity was 1006 ± 3.76 LFM (mean ± SD) (data not shown). When the airflow meter was removed and replaced in front of the AES port consecutive times, airflow velocity was 1029 LFM


Simulation of AES Performance Reduction or Failure
Once we were confident in the consistency of the airflow readings, seven additional 3D meter holders were fabricated. The unobstructed AES evacuation port was ∼25 mm in diameter. Each additional holder had an increasingly restricted posterior opening diameter ranging from 20 down to 8 mm (Figure 2A-c). Velocity measurements were taken for each of the seven holders (Figure 2B). Using different holders of varying diameters allowed for the controlled reduction of the AES vacuum, simulating a decrease in the negative airflow pressure of the system.
Effect of Collection Chamber Modifications on Aerosol Containment
Structural gaps within the collection chamber can disrupt the required negative airflow of the evacuation system. Some gaps can be eliminated or diminished with the application of thin rubber strips combined with standard duct tape (Figure 3A). We used the 3D meter holders with the five largest posterior diameters to measure the airflow. Mean velocity increased between the unsealed and sealed collection chamber, across all five holders by 16 LFM, representing only a 1.09% increase in vacuum (Figure 3B). With the sorter placed in simulated failure mode, we performed DG bead aerosol containment tests (as described in the “Materials and Methods” section) and compared the unsealed collection chamber versus the sealed collection chamber, again using the 3D meter holders with the five largest posterior diameters. For each holder, three aerosol containment tests were conducted, and the DG bead counts were averaged (Figure 3B). Within the unsealed chamber, all holders yielded high bead counts ranging from 6.7 for the 20 mm holder up to 140 for the 12 mm holder. Within the sealed collection chamber, the AES vacuum velocity of the 20 mm holder yielded no beads counted, indicating an uncompromised AES. The forced reduction in AES vacuum velocity of the 18 and 16 mm holders yielded a mean of 0.2 and 0.3 beads counted over 18 containment tests per meter holder. Using the 14 mm holder, a mean of 2.8 beads was counted, suggesting a probable failure of the AES system. In contrast, using the 12 mm holder, a mean of 31.7 beads was observed, indicating a definite system failure.

Airflow Velocity Reveals Altered Aerodynamics Within the Collection Chamber
Under unsealed collection chamber conditions, containment testing for all holders failed. However, mean AES velocity readings were comparable for both unsealed and sealed conditions, with only a 1.09% mean increase in vacuum (Figure 3B). While measuring changes in the AES velocity can indicate a point of failure in the AES system itself, it becomes apparent that measuring airflow at the front of the collection chamber door (Figure 4A) is also needed to verify that negative pressure airflow is sufficient to draw aerosols away from the operator and toward the AES port in the back of the cytometer. Figure 4B illustrates how an anemometer was used to measure inward airflow velocity through the front grille of the collection chamber door. To facilitate measurement, an obstruction was placed in front of the collection chamber door. A 25 mm hole meant to approximate the size of the AES port opening and roughly aligned with the port in the back of the collection chamber was left unobstructed. A special holder was created and placed in front of the unobstructed opening at the front of the collection chamber door and was used to collect the vacuum through a hot wire anemometer (Figure 4C). Vacuum airflow readings through the anemometer were approximately twice as high for the sealed collection chamber as they were for the unsealed chamber across all restricted holders when placed in the AES port (Figure 4D).

Discussion
While aerosol containment testing techniques have evolved over the years, the currently recommended test based on collecting and counting fluorescent microspheres on a glass slide is still time-consuming and cumbersome, particularly in a high-containment laboratory setting. During our early evaluations, we explored the use of a smoke test to evaluate directional air flow, confirming that the AES draws air laterally into the collection chamber. However, we did not adopt this assay mainly because the resulting aerosols would differ in size, concentration, and properties from natively generated aerosols in a flow cytometer or the fluorescent microbeads-containing aerosols used as the gold standard for containment challenge. Altogether, this would make direct comparison with our quantitative fluorescent microbead assay difficult and could misrepresent performance under realistic conditions. Thereafter, we sought to devise an assay whereby measuring the vacuum airflow at key positions could be a fast and practical method to evaluate AES integrity in a cytometer. An assay that ultimately can be easily implemented for real-time monitoring of AES and can complement daily, weekly or monthly recommended testing per ISAC guidelines. 10
The ABM-200 handheld airflow meter is primarily used to test and balance HVAC systems commercially. However, when combined with a 3D printed holder, it has the capability to fit into the AES port within a flow cytometer and consistently measure the AES vacuum airflow. A series of restricted-diameter holders (Figure 2A-c), from 20 down to 8 mm, were also printed to allow us to suppress the amount of AES vacuum and generate titration curves for subsequent airflow velocity and aerosol containment experiments.
With the AES vacuum located in the rear of the collection chamber, it is reasonable to assume that the total vacuum velocity is equal to the sum of the airflow through the sort chamber modification, 4 airflow through the front collection chamber grille, and lateral airflow from multiple gaps surrounding the collection chamber. Lateral airflow was confirmed by generating smoke within the cytometer and observing it being pulled through the collection chamber and into the AES port (data not shown). Vacuum airflow through the sort chamber modification is negligible and can be ignored for our purposes. Vacuum airflow through the front grille is essential and should be measured to monitor the negative pressure integrity at the point closest to the instrument operator. An attempt to measure airflow through the front grille using the handheld velocity meter was unsuccessful. An anemometer placed against the front grille did register single-digit airflow; however, no meaningful data could be derived until airflow was concentrated through the anemometer by blocking the majority of the front grille and fashioning a funnel to concentrate the airflow further through the anemometer probe (Figure 4C).
The difference between the vacuum velocity at the AES port (1765 LFM) versus the velocity at the front grille (146 LFM) for the 20 mm holder indicates that the lateral airflow gaps are the greatest source for vacuum velocity interference. Attempts were made to seal gaps to the best of our ability. Figure 3A displays some of the collection chamber gaps before and after being sealed. Figures 3B and 4D display the same aerosol containment results while using the series of reduced airflow holders under both unsealed and sealed collection chamber conditions. While there is little difference between the AES vacuum velocities when the collection chamber is unsealed or sealed (Figure 3B), there is a doubling of anemometer inflow velocity between the unsealed versus the sealed chambers (Figure 4D). This indicates the importance of measurement at the front collection chamber grille.
Our series of reduced airflow holders confirmed previous observations by Perfetto et al.9,11 that reduced AES velocity increased the number of microspheres seen on aerosol containment tests (Figure 5). With the collection chamber sealed, no DG beads were detected while using the 20 mm holder. That result meets the ISAC recommended tolerance of zero beads per slide 10 and is shaded green in the figure. The forced reduction in AES vacuum velocity of the 18 and 16 mm holders yielded means of 0.2 and 0.3 beads counted. Although this fails the zero tolerance standard, it would be within the framework of “averaged fewer than one particle per slide,” with Perfetto et al. arguing that occasional stray particles may represent the competing vacuums of an AES system versus the vacuum used for containment testing and may not be indicative of an actual loss of containment. 9 This vacuum level, shaded yellow in Figure 5, indicates a need to follow up with aerosol containment testing to ensure that the AES is not compromised. Based upon the mean bead counts seen using the 14 (2.8) and 12 mm (31.7) holders, an AES vacuum velocity at or below 1380 indicates a compromised AES system (shaded red) that should not be used until remediation occurs, to ensure the safety of the operator.
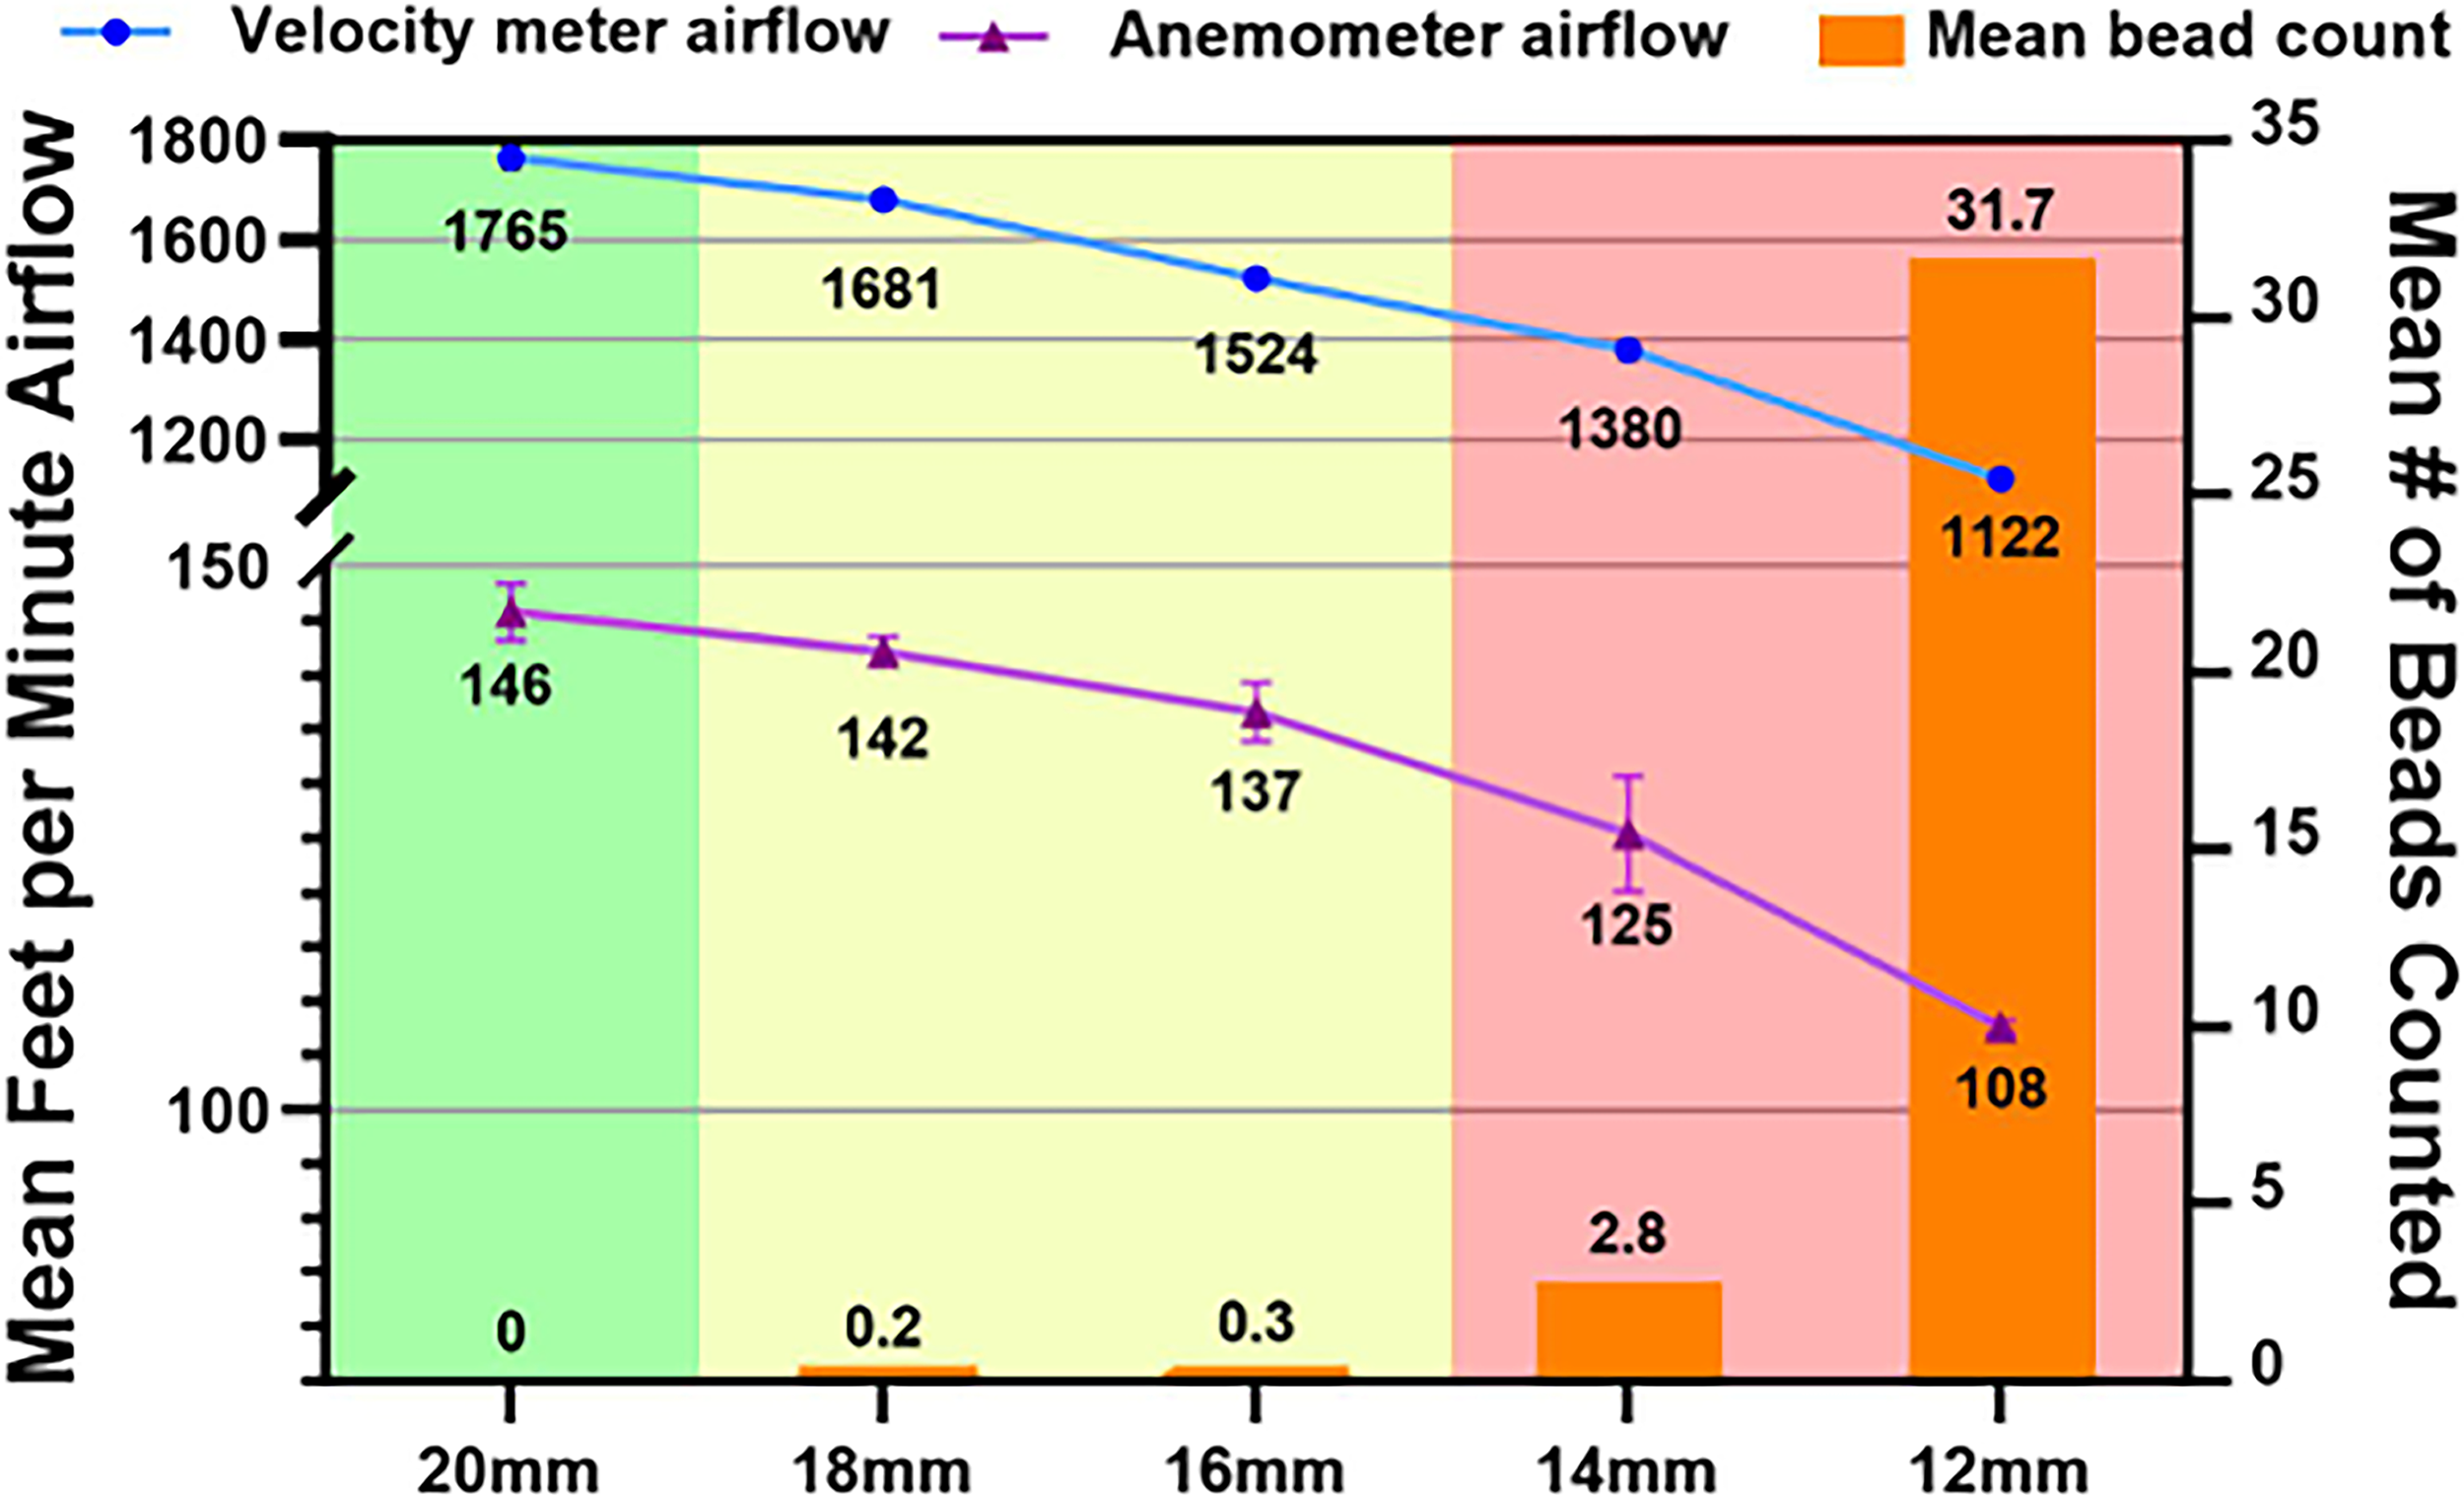
Correlation of AES vacuum velocity with the gold standard fluorescent microsphere assay. AES airflow velocity measurements (n = 10) were recorded for each of five different airflow meter holders, ranging from 20 down to 12 mm based upon the diameter of their posterior opening. For each holder, three 10-min aerosol containment tests were performed. Fluorescent beads were then counted from each cassette and averaged. In addition, separate anemometer readings (n = 5) were taken at the front grille for each of the five different 3D holders. The blue line shows the mean AES vacuum airflow velocity for each individual airflow meter holder, and the purple line shows the mean vacuum airflow velocity through the anemometer for each holder. The orange columns show the mean bead counts for each meter holder (n = 18). The mean number of beads counted at an AES airflow velocity reading of 1524 LFM and an anemometer inflow reading of 137 LFM was 0.3, indicating a reduced AES vacuum velocity that would trigger the need for additional aerosol containment testing to ensure the safety of the operator from potential hazards.
AES failure points for an instrument are determined using vacuum velocity versus aerosol containment result curves, both at the AES port and at the front grille. This need only be done initially and after a major disruption to the cytometer or AES unit. A daily QC measurement at those two locations can determine the integrity of the entire AES system. A velocity measurement at the AES port that is above the failure point on the graph will confirm that the AES vacuum is functioning properly. An anemometer velocity reading at the front grille that is above the failure point on the graph will confirm that the collection chamber is adequately sealed and that the negative airflow is sufficient to keep the operator safe from potential hazards, and sorting may proceed.
“Short-Term Use Biocontainment Bubbles” were used to limit community exposure to SARS-CoV-2 aerosols during the pandemic by making sure there were at least 80 air exchanges per hour for recirculated air through a HEPA filter or by confirming inward airflow above 100 LFM for air exhausted to the outside. 12 With 100 LFM airflow standard for most Class II BSCs, our inflow measurement of 146 LFM in the green zone and even the readings of 142 LFM and 137 LFM in the yellow zone indicate sufficient negative airflow through the AES vacuum system. Note that when the collection chamber was unsealed, all of the inflow readings were < 100 LFM and indicated failing aerosol containment results (Figure 4D). Our data show that instrument manufacturers should consider ways to reduce lateral airflow gaps around the collection chamber that interfere with the negative airflow coming through the front of the instrument. In addition, perhaps most beneficial to operator safety would be the ability of the sorter to monitor inflow air velocity in real time.
When a cell sorter is contained within a BSC, the AES system associated with the instrument should preferably operate independently of the BSC to provide redundant safety barriers. Using our set of restrictive 3D holders, we established a correlation between airflow meter measurements at the AES point and the readouts on the BSC (Supplementary Figure S1). These data provided an independent validation of our measurements, further supporting the robustness of the assay. As described in the “Materials and Methods” section, only the AES system was turned on during the front inflow air velocity measurements. Both the BSC and the cytometer were turned off to isolate the AES vacuum from the effects of other instrumentation and are most pertinent to instruments not within a BSC. Potential airflow disruptions or contributions due to instrument cooling fans and contributions of the BSC 14 are outside the scope of this work. Effective risk mitigation for a BSC-enclosed cell sorter requires regular monitoring of both BSC and AES functions. Our assay is chiefly focused on verification of the AES performance to capture aerosols that are generated inside the cytometer. BSC performance with the enclosed cell sorter still needs to be confirmed independently using other established methods for validation.
Conclusion
Using a small commercially available airflow velocity meter and a series of unique 3D printed meter holders, we were able to correlate decreased AES vacuum airflow with increased numbers of DG beads seen during aerosol containment testing. While each flow cytometer and AES system is unique, on our system, AES airflow readings at 1380 LFM or below at the back of the collection chamber indicate a compromised AES system necessitating further investigation to ensure operator safety. In addition, using a hot wire anemometer to measure airflow at the front of the collection chamber on our system, a reading of 130 LFM or below would also indicate a failure of the negative airflow that is an integral part of the total AES system. While counting DG beads remains the accepted standard for aerosol containment testing, we have demonstrated that monitoring the AES vacuum airflow, both at the AES port and at the front of a closed collection chamber door, is an effective method for monitoring sorter safety on a daily basis.
We recommend the use of Air-VELoCheck for baseline characterization of a new cytometer/AES system or when major repairs to the cytometer, AES, or parts of the enclosed systems have occurred. Testing with restrictive 3D holders can be used, along with aerosol containment testing, on other cytometer/AES systems to determine unique performance failure points for each individual system. Thereafter, using only the 20 mm 3D meter holder containing the airflow meter inserted in the back of the collection chamber AES port, along with a hot-wire anemometer measuring airflow at the front grille location, should be sufficient to confirm AES system integrity. These daily AES airflow measurements take <15 min to perform and can easily be incorporated into daily startup and QC routines prior to sorting potentially hazardous samples.
Taken together, our findings provide proof of concept for real-time monitoring of AES performance. This advancement can hopefully encourage further innovation by manufacturers to incorporate AES monitoring as a standard component, alongside other already existing quality control performance readouts, in a modern flow cytometer.
Authors’ Contributions
C.L.E.: Conceptualization, methodology, formal analysis, investigation, writing—original draft, writing—review and editing, and visualization. I.D.: Conceptualization, methodology, writing—review and editing, supervision, and funding acquisition.
Authors’ Disclosure Statement
The authors have no conflict of interest in relation to this work.
Ethical Considerations
This article does not contain any studies with human or animal participants.
Footnotes
Acknowledgments
The authors would like to thank Tom Moyer for technical assistance with the 3D printed meter holder, Alexander Stewart and Austin Athman for assistance with graphical illustrations.
Funding Information
This research was supported by the
Supplemental Material
References
Supplementary Material
Please find the following supplemental material available below.
For Open Access articles published under a Creative Commons License, all supplemental material carries the same license as the article it is associated with.
For non-Open Access articles published, all supplemental material carries a non-exclusive license, and permission requests for re-use of supplemental material or any part of supplemental material shall be sent directly to the copyright owner as specified in the copyright notice associated with the article.