
Abstract
Introduction:
Failure of an existing effluent decontamination system (EDS) prompted the consideration of commercial off-the-shelf solutions for decontamination of containment laboratory waste. A bleach-based chemical EDS was purchased to serve as an interim solution.
Methods:
Studies were conducted in the laboratory to validate inactivation of Bacillus spores with bleach in complex matrices containing organic simulants including fetal bovine serum, humic acid, and animal room sanitation effluent.
Results:
These studies demonstrated effective decontamination of >106 spores at a free chlorine concentration of ≥5700 parts per million with a 2-hour contact time. Translation of these results to biological validation of the bleach-based chemical EDS required some modifications to the system and its operation.
Discussion:
The chemical EDS was validated for the treatment of biosafety levels 3 and 4 waste effluent using laboratory-prepared spore packets along with commercial biological indicators; however, several issues and lessons learned identified during the process of onboarding are also discussed, including bleach product source, method of validation, dechlorination, and treated waste disposal.
Introduction
A steam sterilization plant (SSP) utilized for 65 years for treatment of biosafety levels (BSL) 3 and 4 containment waste effluent failed. The effluent decontamination system (EDS) contained within a stand-alone building was built in 1953 utilizing storage tanks and direct steam injection continuous flow technology for treatment of waste. Due to the expectation that a new SSP would be opening, the original SSP was not adequately maintained, and with heavy rainfalls/flash flooding received in May 2018, leaks in the system were no longer able to be mitigated. All containment work was halted, and alternate decontamination systems were considered. The decision was made to purchase a bleach-based chemical EDS as a short-term solution while a thermal EDS was built.
Testing was conducted in the laboratory to verify inactivation of Bacillus spores using bleach as a disinfectant. Previous studies demonstrated the need to evaluate the efficacy of disinfectants using higher spore loads and in the presence of organic matter. 1,2 Bacillus thuringiensis spores were used for these studies and are a widely accepted surrogate for inactivation testing. 3 -9 B. thuringiensis has been determined to be the best overall nonpathogenic surrogate for Bacillus anthracis based on safety profile, phylogenetic relationship, morphology, and comparable survivability when challenged with biocidal agents. 10 Fetal bovine serum (FBS) at a concentration of 5% was used to simulate organic material in accordance with the standards provided by the American Society for Testing and Materials (ASTM). 11 This simulant is also expected to be a major component of the organic material present in laboratory and vivarium activity waste generated in biocontainment. Humic acid was also used as an organic simulant due to the ability of high concentrations of FBS to germinate spores. 4,12
The recent guidance document, “Select Agent and Toxins Biosafety/Biocontainment Plan Guidance,” published by the Centers for Disease Control and Protection (CDC) and the Animal and Plant Health Inspection Service (APHIS) US Department of Agriculture (USDA) states that potentially contaminated liquid waste generated from containment laboratories can be decontaminated by various methods, including chemical or thermal. The fifth edition of the Biosafety in Microbiological and Biomedical Laboratories (BMBL) indicates that thermal is preferred, although this is not a requirement. A chemical EDS for use with bleach was purchased, and a factory acceptance test (FAT) was conducted prior to shipment to our facility. Standard methods for validating chemical EDSs were followed during the FAT using commercial Bacillus atrophaeus biological indicators (Releasat Biological indicators, Mesa Labs). Once the chemical EDS arrived on site, testing was conducted using commercial B. atrophaeus biological indicators (Crosstex, Maumee, Ohio) as well as laboratory-prepared B. thuringiensis spore packets.
Currently, the biological indicators commercially available for testing are not designed for testing in liquid matrices. The only options are spore strips or discs/coupons prepared for evaluating steam or chemical vapor sterilization. Laboratories utilizing these for testing in liquid matrices use dialysis tubing or liquid exchange packets of Tyvek material with an opening to allow liquid exchange. Studies in the literature have demonstrated the retrieval of spores from test coupons or test strips following decontamination test protocols. 6,9,13 -17 However, no studies have evaluated the retention of spores on these biological indicators following exposure to a liquid decontamination cycle. Most validation studies for chemical EDSs remove the biological indicator strip or disc and place it in media for evaluation without determining the recovery following suspension in a liquid matrix, such as growth medium or phosphate buffered saline (PBS), for the prescribed contact time.
Here we demonstrate the ability to achieve >106 log kill of spores using Clorox germicidal bleach in the presence of organic load in the laboratory as well as during biological validation of the chemical EDS. Additionally, we evaluated commercial B. atrophaeus biological indicators for applicability in the validation of a chemical EDSs. This preliminary work demonstrated that these indicators may not be appropriate for validation of a chemical EDS. For these reasons, our method utilizing laboratory-prepared spore test packets was included as the primary method of evaluation in the biological validation the chemical EDS. Laboratory-prepared spore test packets were selected as a more stringent and scientifically sound test method for biological validation. Our studies demonstrate for the first time the use of a chemical EDS for the treatment of BSL-3 and BSL-4 containment waste. In addition, we provide evidence for inactivation of spores that can be used for kill pans to inactivate laboratory waste. Finally, this study also demonstrates the process and method by which this chemical EDS was validated for use, sheds light on the importance of which bleach product must be used in these systems, and that the protocol for biological validation of chemical EDS units needs to be reevaluated to ensure that the validation method is providing evidence of successful sterilization.
Materials and Methods
Preparation of B. thuringiensis Spores
Spores were prepared in broth and characterized as previously published. 6,18 -21 The sporulation medium was 2.5% nutrient broth (NB) amended with CCY salts 6,19,22,23 at pH 7.0, as described previously. 7 A 2.63% solution of NB and 30X KPO4 buffer (pH 7.0; CCY buffer) were sterilized as independent components. CCY divalent cations were sterile filtered and stored at –80°C. NB and CCY buffer were combined before the addition of CCY divalent cations to mitigate divalent cation-phosphate precipitation. Trypticase soy agar (TSA) was streaked with primary glycerol stocks of B. anthracis that were frozen in long-term storage at –80°C. After incubating for 16 ± 2 hours at 37°C, a single colony from a TSA plate was transferred to 10 mL of sporulation medium (preheated to 37°C) and vortexed for 30 seconds. Preaerated and preheated sporulation medium (200 mL medium in one -1 baffled flasks with filter caps; Corning 431403) was inoculated with 0.6 mL from the 10 mL of inoculum. The Erlenmeyer flasks were then incubated at 34°C with shaking (300 rev · min-1) for 72 ± 2 hours in a New Brunswick Scientific shaker/incubator. Sporulated cultures were amended with 35.5 mL of 20% Tween 80 (final concentration, 3%) and incubated an additional 24 ± 2 hours at 34°C at 300 rev · min-1 to disperse (“unclump”) spores. The spores were harvested by centrifugation at 2000 × g at 20°C for 10 minutes. Spores were washed twice with 200 mL of 3% Tween 80 at room temperature (22 ± 4°C) for 24 ± 2 hours at 200 rev · min-1. The spores were suspended in 10 to 20 mL of 0.1% Tween 80 as previously published, 3 -6,24 to a final concentration of approximately 1 × 10¹⁰ CFU/mL, aliquoted into 3 mL portions, and then characterized via light microscopy and Beckman-Coulter multisizer (BCM) analysis. 18 -20 The titers of heat-resistant spores were obtained by heating the spore preparations to 65°C for 30 minutes and plating serial dilutions of untreated versus heat-treated spore preparations. It is imperative to start this validation procedure with heat-resistant spores. The bacterial colonies obtained from plating the heated samples represent those formed by ungerminated spores, and the heating will kill any residual vegetative cells or spores that may have committed to/initiated germination during storage. Ungerminated spores are the most resistant form of the bacterium to heat, pressure, chemicals, and so on. 2,8,25,26 Germination, spore rehydration, and subsequent resumption of metabolic processes render the bacterium more sensitive to decontamination methods. 27 -29 BCM analysis was used to assess spore clumping, determine spore size, and quantify spore cleanliness. TSA containing 5% sheep’s blood (SBAP) was used to verify that the starting strains and subsequent isolates were beta-hemolytic.
Spore Packet Preparation
B. thuringiensis spore inocula (prepared by NSWC Dahlgren, maintained in 0.1% Tween buffer at a concentration of approximately 1.0 × 10¹⁰ spores/mL) were prepared by diluting the spore stocks to approximately 1.0 × 10⁶ spores/mL (resulting in approximately 0.00002% Tween remaining in the spore suspension at time of testing) and heating the suspensions at 65°C for 30 minutes to ensure all resulting colony forming units (CFU) were from heat-resistant spores. An aliquot (0.2 mL) was removed and used to titrate the inoculum by serial dilution and plating on SBAPs. Plates were incubated at 37°C overnight and counted the following morning to confirm the inoculum dose. For disinfection testing, dialysis tubing was prepared by prewetting in sterile PBS and tying a knot in one end of the tubing. The spore inoculum (2 mL) was loaded into the dialysis tubing with a serological pipet, after which the other end was secured with a knot. The end of the tubing tied after addition of the spore suspension was weighted with a metal alligator clip to ensure the “test packet” remained in the effluent-disinfectant solution (2 L final volume). The test packets were suspended in disinfectant solution for the desired contact time. At the time of placement of the packets in test solution, a magnetic retrieval stick was placed in the disinfectant solution, and the rim of the beaker was lightly sprayed with the disinfectant solution to avoid any possible introduction of environmental contamination.
Free Chlorine Concentration Determination
Free chlorine concentration was measured using a free chlorine photometer per the manufacturer’s instructions (H1-96701; Hanna Instruments, Woonsocket, RI). Samples of bleach solutions were collected and diluted as appropriate for testing using the Hanna chlorine meter P2 setting and Ultra HR chlorine reagent packets (A and B). Ten mL of bleach solution was added to test vessel and used to zero the chlorine photometer. The test vessel containing the bleach solution was then removed, and 1 packet of A reagent and 1 packet of B reagent were added and mixed by shaking for 20 seconds. Following mixing, the test vessel containing the samples and test reagents was placed back into chlorine meter to obtain measurement (mg/L, which is equivalent to parts per million, or ppm). The free chlorine concentration (ppm) was calculated by multiplying the measured value by the dilution factor, if applicable.
Inactivation of Spores in the Presence or Absence of Simulated Organic Waste
Clorox germicidal bleach solution was prepared to the appropriate dilution to achieve specific free chlorine concentrations in ppm for testing. Several free chlorine concentrations and various contact times were evaluated. Multiple bottles of Clorox germicidal bleach with varying receipt dates and levels of free chlorine were used. This extensive parameter testing was important to provide a range of results to include test failures and provide data with the highest confidence possible. Bleach was diluted to achieve free chlorine concentrations of 3800 ppm, 5700 ppm, and 11 400 ppm. Organic simulant concentrations tested included 1% FBS, 5% FBS, or 5 g/L humic acid. Inactivation was evaluated at contact times ranging from 0.5 to 2 hours.
Inactivation of Spores in Simulated Waste Effluent
Effluent was collected during an ABSL-2 naive nonhuman primate (NHP) animal room sanitation. NHP animal room sanitation procedures were modified to reduce the bioburden entering the waste effluent stream for the period in which the chemical EDS would be operational. Paper liners, typically used for rabbit cages, were placed under NHP cages to collect a large portion of the high organic content material, including biscuit remnants and animal excreta. Utilizing these modified procedures, animal room sanitation was conducted in accordance with institute standard operating procedures in an ABSL-2 naive NHP holding room. During this procedure, the floor drain was capped and berms placed to prevent liquid from flowing under the door. Cages, pans, and floors were treated with 10% Clorox germicidal bleach for a 10 minutes contact time and then rinsed with water. The waste effluent was collected using a wet-dry shop vacuum. This waste effluent was transferred to a BSL-2 laboratory for inactivation testing. The waste effluent was adjusted to a final free chlorine concentration of 5700 ppm based on volume using Clorox germicidal bleach. Spore samples were treated for a 2-, 4-, or 6-hour contact time. Following treatment, spore samples were harvested and safety tested as described in the following.
Posttreatment Collection of Samples and Safety Testing
After the prescribed treatment and contact time, the test packet was retrieved and suspended over a sterile 1 L flask containing 500 mL heart infusion broth (HIB). While one individual held the test packet over the flask, a second individual cut the dialysis tubing just below the knot with sterile scissors, allowing the entire test packet (including dialysis tubing) to fall into the flask of sterile medium. The flask was closed with a sterile cap. For all tests, a positive control was included that involved the addition of 2 mL of the effluent-disinfectant solution and 100 µL of spore suspension (approximately 105 spores) to a flask containing 500 mL HIB. This positive control represented the maximum amount of bleach that could be contained within the dialysis tubing being tested and introduced into the flask with live spores after the treatment and contact time in the dialysis tubing. All flasks were incubated at 37°C with shaking at 150 rpm. Typically, the positive control flask was visibly turbid within 4 to 6 hours. After 7 days of incubation in liquid HIB, an aliquot (1 mL, exceeding the 100 µl requirement in the CDC policy for B. anthracis inactivation testing) was removed and plated onto 5 SBAPs (200 µL per plate). SBAPs were incubated at 37°C for 7 days (per CDC policy for B. anthracis inactivation testing 3 ). Growth of B. thuringiensis was detected by visual inspection (photographs taken). Additionally, samples of the sterility check culture were also measured spectrophotometrically at an optical density of 620 nm (OD620).
Consistency of Operation of the Chemical EDS
As a safety margin, the chemical EDS was programmed for the effluent treatment tanks to achieve a free chlorine concentration of 6500 ppm. The volume of stock bleach required was calculated based on effluent volume to be treated, the free chlorine concentration of the input bleach solution, pump volume delivery (gal/min), and refining empirically through evaluation of free chlorine concentrations during test runs of the EDS. The effluent treatment tanks were programmed to fill to 946 L with potable water. Following this fill, bleach was delivered in a time-dependent run to achieve the desired volume to reach the target concentration of 6500 ppm free chlorine. Agitation began at the start of bleach delivery to the effluent treatment tanks. Samples were collected from the top and bottom of the chemical EDS treatment tanks at various times following delivery and agitation. Consistency of operations would be considered achieved by reaching the target free chlorine concentration (6500 ppm) in 5 sequential cycles per tank with less than 10% variation in the free chlorine concentration. At this level of variation, free chlorine concentrations would be between 5850 and 7150 ppm, which is greater than the concentration that we demonstrated was effective against >6 logs of B. thuringiensis spores (5700 ppm) in the laboratory (described in the following).
Validation of Decontamination in the Chemical EDS
For validation of the chemical EDS, effluent treatment tanks were prepared, and samples of liquid were collected to measure the free chlorine concentration prior to placement of biological indicators. Once the target free chlorine concentration of 6500 ± 650 ppm was confirmed, the biological challenge testing of the chemical EDS was performed. Biological indicators, laboratory-prepared spore packets and commercial B. atrophaeus indicators (Crosstex, Maumee, Ohio) in Tyvek pouches, were tied to a line for suspension at 3 different points (high, middle, and low points) within the chemical EDS effluent treatment tank. Following completion of the sterilization cycle, the line containing spore samples was retrieved for processing. Each fishing line containing the alligator clips and biological indicators was placed into a 1 L beaker containing 1:100 bleach solution. The spore samples were transported in this diluted bleach solution in order to decrease the amount of environmental contaminants that could be introduced to the samples during transport from the chemical EDS location through the laboratory corridors prior to arriving at final destination for sterility confirmation. The beaker containing bleach and the fishing line was then transported to a BSL-2 laboratory for processing. Transit time did not exceed 15 minutes and would not adversely affect spore viability based on internal testing performed previously and during each validation attempt. Spore packets were harvested and tested to verify inactivation as described previously. Commercial indicators were transferred to tubes containing sterile trypticase soy broth (TSB) and incubated at 35°C for 72 hours. An untreated indicator in TSB was included as a positive control. A tube of sterile TSB with no indicator was included as a negative control. After 72 hours, if the broth was cloudy, the sterility check culture was recorded as positive for growth, and if broth was clear, the sterility check culture was recorded as negative for growth. If culture was positive for growth, a Gram stain was performed to determine if decontamination failed, defined as the presence of gram-positive rods.
Evaluation of Commercial Biological Indicators for Use in Validation of Liquid Decontamination
Commercial biological indicators (Crosstex) used for the biological validation containing 106 B. atrophaeus spores on a metal coupon were obtained. During the chemical EDS sterilization cycle, effluent is agitated for the 2-hour contact time. The effect of this agitation on the biological indicators within the Tyvek envelopes is unclear. In an attempt to mimic the conditions within the chemical EDS, sample biological indicators were either gently vortexed or soaked in liquid for an extended time period. Commercial biological indicators were transferred to 5 mL of sterile water for injection. One set of indicators were agitated using a vortex at midspeed for 10 seconds. After agitation, the biological indicator was removed from the liquid. The other set of indicators were soaked for 40 minutes and then gently agitated by hand prior to decanting the supernatant into a new sterile tube. The number of spores released into the liquid was determined by performing colony counts on SBAPs. In all cases, the experiments were performed in duplicate.
Results
Inactivation of Spores in the Presence or Absence of Simulated Organic Waste
To determine the conditions for effective inactivation of B. thuringensis spores with free chlorine, efficacy was evaluated at various concentrations and contact times using Clorox germicidal bleach. As illustrated in Table 1, the test parameters evaluated allowed for both successes and failures that were attributable to both amount of available free chlorine and contact time, thus giving overall greater confidence in the test results. Importantly, by manipulating either the percentage free chlorine or the contact time, complete inactivation was achieved. It is well known that organic matter can impede or hinder the efficacy of bleach disinfection, 2,30,31 thus we performed our tests using 2 accepted simulants for organic load. Initially, FBS was used at 1%, and then the concentration was increased to 5% to better mimic possible organic loads. This is a simulation proposed by the Environmental Protection Agency (EPA). 11 Knowing that high levels of FBS can induce some spores to germinate, 12 we also tested humic acid as a simulant for organic matter that would impact germination of spores to a lesser extent as compared to FBS. 4 Solutions containing 3800 ppm free chlorine did not completely inactivate at contact times ≤2 hours; however, complete inactivation did occur when the contact time was increased to 20 hours. The minimal contact time required at a concentration of 3800 ppm was not determined. For solutions containing 5700 ppm free chlorine, contact times ≤1 hour were insufficient. However, 5700 ppm of free chlorine for a 2-hour contact time was 100% successful at inactivating >6 log of B. thuringiensis spores using either organic matter simulant.
Efficacy of Inactivation of Bacillus thuringiensis with Various Concentrations of Free Chlorine (Clorox Germicidal Bleach).
Abbreviations: FBS, fetal bovine serum; ppm, parts per million.
a ppm is based on percentage free chlorine per each bleach source.
b Indicates whether replicates were performed on the same or multiple days.
Inactivation of Spores Simulated Effluent Waste
To further confirm that inactivation of spores could be achieved in “real-world” conditions, we evaluated efficacy of inactivation in waste generated during a NHP animal room sanitation. Treatment of 106 B. thuringiensis spores in waste effluent generated during an NHP animal room sanitation using Clorox germicidal bleach at a free chlorine concentration of 5700 ppm and a contact time ≥2 hours resulted in complete inactivation (Table 2). This organic suspension was prepared using the same methodology employed when cleaning BSL-3 and BSL-4 NHP rooms under normal operations and further confirmed that the level of organic load (modeled earlier with FBS and humic acid) did not adversely impact the extent of spore killing at 5700 ppm for a contact time of at least 2 hours.
Inactivation of Bacillus thuringiensis Spores in Waste Effluent Collected During Animal Room Sanitation.
Several industrial bleach products, available at higher sodium hypochlorite concentrations and larger distribution volumes, were evaluated for scale-up of operations in the chemical EDS. Products containing 12.5% sodium hypochlorite with (Brenntag, Univar LiquiChlor) or without (Buckman’s Inc.) an EPA pesticide product label were purchased and tested. None of these bleach products were completely effective in decontamination of the commercial or laboratory-prepared biological indicators in laboratory testing (data not shown). The efficacy of these sodium hypochlorite solutions at concentrations of free chlorine ranging from 3000 to 9000 ppm demonstrated an inability to completely decontaminate >6 logs of B. thuringiensis spores. Following these decontamination failures, Clorox germicidal bleach was evaluated for decontamination efficacy within the chemical EDS.
Consistency of Operation of the Chemical EDS
For the consistency of operation runs, nonpesticide-rated 12.5% sodium hypochlorite solution (Buckman’s bleach) was used. The free chlorine concentration of the sodium hypochlorite solution was measured as 114 500 ppm. The operating manual called for the monitoring of chlorine concentration using a conductivity meter. This method converts ion measurements into chlorine concentration; however, it became clear that this method would be inaccurate once organics and other salts were a component of the effluent. Therefore, bleach volume was determined based on set volumes. Effluent delivered based on programming was expected to be 946 L. Bleach volume required was calculated as follows: final volume (946 L + ∼55 L bleach) × final concentration (6500 ppm) = (volume required) × starting concentration (114 500 ppm). Based on this information, the bleach volume required was 57 L. The bleach pump was rated to be 4.16 L/min; therefore, the bleach delivery run time was calculated to be 14 minutes. Using this bleach run time, the free chlorine concentration in the treatment tanks was measured between 7800 and 8400 ppm. Fractional calculations were used to determine that tank sequential runs were conducted to evaluate the consistency of operations of the chemical EDS. Free chlorine concentrations were determined from liquid samples collected from the top (high) and bottom (low) of the treatment tanks at the end of the bleach dosing time (0 minutes), bleach dosing time + 15 minutes (15 minutes), and after bleach dosing time + 120 min (120 minutes). The target free chlorine concentration of 6500 ppm with less than 10% variance was achieved for all 10 consistency runs (Table 3). The free chlorine concentration for all liquid samples collected were between 6200 and 6800 ppm, representing <5% variance. Evaluation of the effluent delivery volume utilizing a flow meter determined that the 946 L volume stop in the programming resulted in an actual effluent delivery of 832 L, explaining the smaller bleach volume required to achieve the appropriate free chlorine concentration. Because consistency was achieved, parameters were not changed to increase effluent volume delivery to the treatment tanks.
Free Chlorine Concentrations for Consistency Run Testing/Prevalidation.
Abbreviation: ppm, parts per million.
Validation of Decontamination in the Chemical EDS
Following demonstration of consistency of operations for the chemical EDS, validation was initiated using Clorox germicidal bleach (stock concentration of 84 000 ppm) and a 15-minute bleach delivery time. Six validation runs (3 per tank) were conducted. The effluent treatment tanks were prepared, and liquid samples were collected from the top (high) and bottom (low) of the tank. The free chlorine was measured to ensure that a concentration of 6500 ppm was achieved prior to the placement of biological indicators. The 6 validation runs were sequential runs, and free chlorine concentrations achieved for each run were between 6400 and 6800 ppm (Table 4). Biological indicators (laboratory-prepared B. thuringiensis spore packets and commercial B. atrophaeus indicators in Tyvek pouches) were suspended on a weighted fishing line in the prepared effluent treatment tanks at high, middle, and low points within treatment tanks for a 2-hour contact time. Following the contact time, spore samples were retrieved from the treatment tanks and transported to the laboratory for processing. The laboratory-prepared spore packets were released from the line into 500 mL of HIB and incubated for 7 days at 37°C with shaking. After 7 days of incubation in HIB, 1 aliquot was removed to obtain an optical density at 620 nm (OD620), and another aliquot was plated on SBAPs and incubated for 7 days at 37°C. The commercially purchased biological indicators were transferred to TSB and incubated at 35°C for 72 hours.
Chlorine Concentrations for Biological Validation Runs.
Abbreviation: ppm, parts per million.
All validation sterility check cultures were negative for B. thuringiensis (Table 5). The single laboratory-prepared B. thuringiensis spore packet from Run 1 (Tank 1, middle sample), which contained growth following culture in liquid broth, was streaked on SBAPs and determined to be a pure culture that was morphologically not B. thuringiensis. The most probable explanation was environmental contaminant following retrieval of the spore samples from the treatment tanks within the chemical EDS. However, the culture appeared to be pure and contained only 1 colony morphotype. The organism was determined by sequencing to be probable B. atrophaeus. The source of this contamination was most likely from the commercial biological indicator attached at the same location on the line placed within the effluent treatment tanks. If the Tyvek liquid exchange packet had an air bubble that prevented sufficient contact of the biological indicator with bleach during the sterilization cycle, it would have resulted in a partial inactivation of that test spore indicator. We hypothesize that once the sample line was retrieved and placed in the beaker for transport to the laboratory for processing, spores were washed off the strip and came in contact with the B. thuringiensis spore packet (see results in following section). We believe that this was a process error and are confident in our data generated from the laboratory-prepared spore packets for the following reasons. First, the commercially available test strips are not designed for use in liquid EDS. Thus, the “off-label” use required us to manipulate the strips in a relatively novel way with clear limitations for use in this particular situation. Second, B. thuringiensis spores have been recently recognized as a more appropriate surrogate for B. anthracis spores because of their genetic similarity and relative hardiness of the spores. 10,32 Third, the laboratory-prepared spore packet method tests 100% of the spore contents because the test packets are opened and the entire contents (to include the dialysis tubing) are placed into the sterile flask containing HIB. This gives us confidence that the chemical EDS is providing a minimum of a 6 log kill. Finally, we know these test spore packets are sensitive enough to discern sporicidal bleach from nonsporicidal bleach (EPA pesticide designation).
Validation Results for Laboratory-Prepared Biological Indicators.
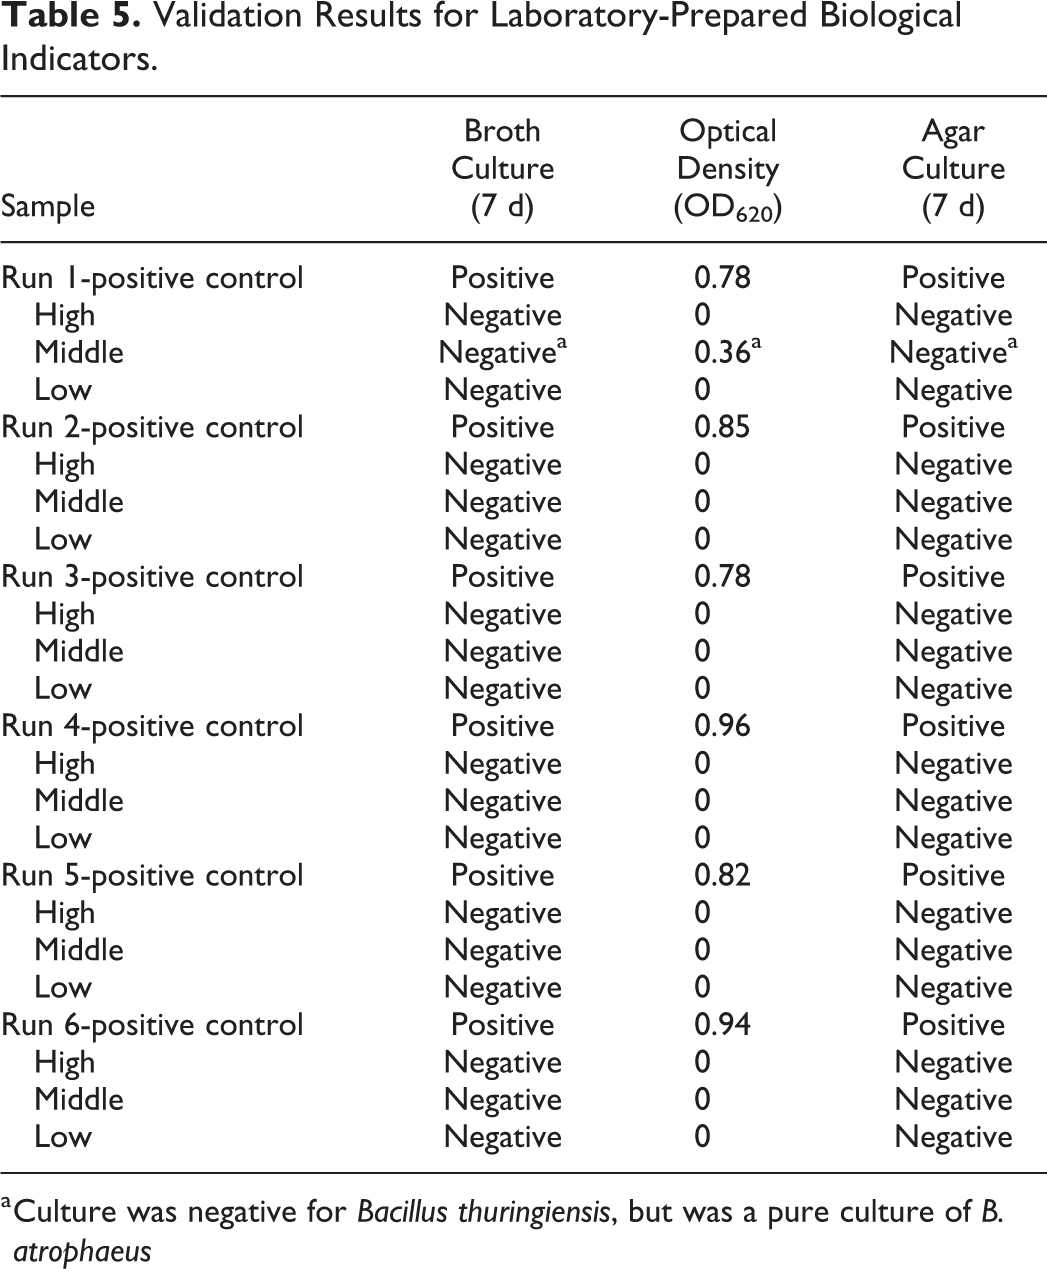
a Culture was negative for Bacillus thuringiensis, but was a pure culture of B. atrophaeus
Evaluation of Commercial Biological Indicators for Use in Validation of a Chemical-Based EDS
The lack of a commercial biological indicators for the evaluation of liquid decontamination was always a concern, especially when others reported successful decontamination with chemical EDSs yet initially we did not. In addition, protocols exist for use of these coupons and then subsequent release of materials from the coupons for analyses. We wanted to determine if the material was released from the coupons upon contact with liquid, which might explain our sole failed sterility test. A study was conducted that evaluated the recovery of spores from liquid following contact with a commercial biological indicator. The commercial biological indicators, reported to contain 106 B. atrophaeus spores, were placed in sterile water. One set of biological indicators were agitated by vortexing for 10 seconds, after which the indicator coupon was removed from the liquid. The other set of biological indicators was held for 40 minutes at room temperature. Prior to decanting the liquid, the tube was gently agitated by hand. Under both conditions tested, greater than 106 spores were recovered in the liquid, indicating that these test parameters resulted in collection of nearly 100% of the spores from the biological indicators (Figure 1). These data also support our hypothesis for how the B. atropheus contaminant was identified in the laboratory-prepared spore packet during validation of the chemical EDS.
Recovery of spores from biological indicators. Biological indicators containing 106 B. atrophaeus spores were placed in sterile water. Following agitation by vortexing or soaking, liquid was collected, and the number of spores present was quantified by colony count assay.
Discussion
In this report, we demonstrate inactivation of >106 B. thuringiensis spores in the laboratory and in the biological validation of a chemical EDS to decontaminate using Clorox germicidal bleach at a free chlorine concentration of ≥5700 ppm and ≥6200 ppm, respectively. These data also provided necessary validation for complete decontamination of laboratory waste generated with spore-producing bacteria using Clorox germicidal bleach free chlorine concentrations ≥5700 ppm at a contact time of 2 hours prior to disposal. This information has been included in updated laboratory standard operating procedures and approved by external inspectors during subsequent audits. Evaluation of other sources of sodium hypochlorite solutions were unable to achieve reliable decontamination of spores. Several possibilities exist for this finding. One possibility is that proprietary stabilizers in Clorox provide some benefit to this product. Another possibility is that the difference in pH noted with these products plays a part in their effectiveness. However, pH-amending was not considered an option for the chemical EDS, and this experiment was never performed. Several aspects of this study design provided important safety margins for the use of this chemical EDS. (1) The entire spore sample (100%) was tested by releasing the entire opened dialysis tubing packet into sterility check medium. Positive controls were used to ensure that any residual bleach was not impeding the bacterial growth. (2) The use of dialysis tubing provided an inherent safety margin for contact time because it relied on diffusion rates of the disinfectant solution into the test packet. (3) Biovalidations were conducted at free chlorine concentrations between 6400 and 6800 ppm. However, upon operation, this value was increased to a free chlorine concentration to 7300 ppm such that even with a 10% variance, which was greater than the variance observed during the consistency runs, the free chlorine concentration would still be >6200 ppm. (4) Another important point to note is that we met and exceeded expectation of a 6 log kill of bacterial spores (gold standard for decontamination confirmation). This is in line with current Code of Federal Regulations and CDC policies for validation of EDSs 4 and in most cases exceeding EPA guidelines, which require a 6 log kill. 5 (5) Importantly, the only waste that would potentially be partially inactivated prior to introduction into the chemical EDS would be small amounts of animal waste that would have previous contact time with bleach or Micro-Chem Plus and autoclave condensate. Neither of these types of effluents would contain a significant bacterial spore burden, thus the 6 log kill criterion represents an unlikely “worst case scenario” of both current and future institute operations.
These studies also provided evidence that the type of bleach product used in these chemical EDSs is critical for inactivation. The product recommended and typically used in these systems is an EPA pesticide label bleach product with a starting concentration of 12.5% sodium hypochlorite. In our testing, the only product sufficient to achieve complete sterilization was Clorox germicidal bleach. This result could be the result of differences in pH of these products or due to proprietary stabilizers added to Chlorox products. Additionally, based on our preliminary studies, the commercial biological indicators did not perform well in liquid matrices. Contact with liquid resulted in the release of nearly all spores from the metal coupon. There are a number of different commercially available biological indicators, and whether different sources or materials (e.g., coupons vs strips) might be more appropriate for validation of chemical EDSs will require further study. However, based on our results, when commercial biological indicators are used for validation of a liquid matrix, additional controls are necessary. One important control would be to suspend the commercial biological indicator in a nondisinfectant liquid (eg, water or some other medium that would not induce spore germination or cellular replication) to evaluate the possibility of the release of spores upon contact with liquid. Without the inclusion of this control, any results obtained from their use in the biological validation of chemical EDSs may not be indicative of inactivation but of spore loss.
Although these studies demonstrate the ability to successfully validate a chemical EDS using bleach as a disinfectant for containment laboratory operations, it is important to note several disadvantages with this approach. A major disadvantage the bleach-based chemical EDS created was a lack of effluent treatment capacity. Each run of the chemical EDS required approximately 57 L of bleach for efficacy, scale-up operations required the use of approximately a 330-gal tote of bleach per day to accommodate effluent volumes of ∼3000 gal/day. The use of this type of system for large containment laboratories (greater than 5000 gal/day effluent) would be difficult from a cost and logistical standpoint due to the need for constant replacement of bleach containers using a process that could not be automated. Another major disadvantage with the chemical EDS was the need to neutralize the chemical disinfectant following a treatment cycle. Although thermal EDS units can be successfully discharged to a local sanitary sewer through the addition of chilled water, which is an automated process, the chemical EDS required additional chemicals to reduce free chlorine concentrations to acceptable levels for discharge to the sanitary sewer based on our local requirements. A common byproduct of dechlorination is hydrochloric acid, which made it very difficult to balance free chlorine neutralization with acceptable pH considerations for discharge on a large scale. 33 In the end, neutralization of free chlorine in the system was deemed too hazardous due to the chemicals required, the byproducts produced, and the inability to completely remove the residual neutralant before subsequent runs. Therefore, the treated waste was collected in storage silos for pickup and disposal by a contract company. All of the aforementioned resulted in extremely high costs that were not fully realized at the time of purchase of this system. Along with these disadvantages, a few other lessons learned are worth noting. Drain location and agitation need to be evaluated. The chemical EDS unit was designed and delivered to our research institute with the drain located on the side of each of the treatment tanks. Although this is not a major consequence for operations on a thermal EDS because any residual effluent would be treated in the next heat cycle, a chemical EDS with any residual liquid could drastically affect the next cycle if any neutralization chemicals remained in the tank. Both chemical treatment tanks required modification to drain through the bottom of the tank before they could be used for laboratory operations. Agitation method and timing were additional aspects that required modification before validation was complete. Liquid levels in the tanks were measured using level-detector systems; however, agitation of the liquid resulted in inaccurate readings, which resulted in pump shutoff before the expected volume of effluent was delivered. This was remedied by adjusting agitation to begin at the start of bleach delivery. All of these factors significantly limited research while the chemical EDS was utilized.
Supplemental Material
Supplemental Material, AppBio_supplemental_materials_v1 - Biological Validation of a Chemical Effluent Decontamination System
Supplemental Material, AppBio_supplemental_materials_v1 for Biological Validation of a Chemical Effluent Decontamination System by Christopher K. Cote, Jessica M. Weidner, Christopher Klimko, Ashley E. Piper, Jeremy A. Miller, Melissa Hunter, Jennifer L. Shoe, Jennifer C. Hoover, Brian R. Sauerbry, Tony Buhr, Joel A. Bozue, David E. Harbourt and Pamela J. Glass in Applied Biosafety
Footnotes
Authors’ Notes
Some information was presented at the 2019 ABSA conference by Dr David Harbourt.
Acknowledgments
We would like to thank many individuals for their assistance and discussion during the conduct of these studies, specifically, in the Biosafety Office (James Lackemeyer, Aangela Reagan), Comparative Medicine (Shannon Marko, Keith Esham, Mike Winpigler, Harold Mills, Brian Scott, Debra Harrison, Donna Witcher), Diagnostic Systems Division (Randy Scheopp, William Dorman, Samantha Tostenson), Facilities Management Office (Robert Koning, Brad Anderson, Jeff Beck, Jonathan Horton, David Dinterman, Edward Norton), FSI (Tyler Hoagland, David Graham), and members of the Laboratory Contingency Working Group. We also would like to thank Dr Sara Ruiz for assistance and discussions during the conduct of these tests. Opinions, interpretations, conclusions, and recommendations are those of the authors and are not necessarily endorsed by the U.S. Army.
Declaration of Conflicting Interests
The author(s) declared no potential conflicts of interest with respect to the research, authorship, and/or publication of this article.
Funding
The author(s) received no financial support for the research, authorship, and/or publication of this article.
Supplemental Material
Supplemental material for this article is available online.
References
Supplementary Material
Please find the following supplemental material available below.
For Open Access articles published under a Creative Commons License, all supplemental material carries the same license as the article it is associated with.
For non-Open Access articles published, all supplemental material carries a non-exclusive license, and permission requests for re-use of supplemental material or any part of supplemental material shall be sent directly to the copyright owner as specified in the copyright notice associated with the article.