
Abstract
Flexible plastic-walled HEPA-filtered containment chambers, referred to as “primary containment systems” in the Biosafety in Microbiological and Biomedical Laboratories, have been used in animal biosafety level 4 (ABSL-4) in the past as a means to control environmental contamination at its source. The air-cleaning efficiency of these systems, including particle decay rates and protection factors for large animal care staff, is understudied in the literature. A series of studies using large animals (sheep) as well as aerosolized salt solutions were conducted to quantify the performance characteristics of a commercially available primary containment system in an ABSL-4 room (operating at biosafety level 0). When charged with particles that closely match the particle size distribution of loose-housed sheep, results show that particle counts inside the primary containment system are >45 000 times higher than particles outside the chamber in ABSL-4. These data demonstrate that primary containment systems of this type can provide significant safety enhancements and greater contamination control for ABSL-4 staff who work with loose-housed animals.
The central tenet of industrial hygiene and biological safety is to control contamination as close as possible to its source. This provides for maximum effectiveness and efficiency of the control. Loose-housed animals present risks to scientific and animal care staff because of the potential to shed infectious materials in their excreta that can be subsequently aerosolized and present an inhalation risk to staff. The Centers for Disease Control and Prevention has acknowledged this aerosol risk to staff in animal biosafety level 3 (ABSL-3) and ABSL-4 and requires the use of primary containment systems for all animal species within high and maximum containment. 1 Soft-walled negative pressure enclosures that draw room air and exhaust HEPA-filtered air are viewed as a potential solution for housing animals in biocontainment. 2 While HEPA-filtered primary containment enclosures have been the industry standard for rodent research applications for many years, there are no scientific publications that evaluate their usefulness as primary containment enclosures for larger animals. Therefore, the goals of this study were to (1) establish experimental benchmarks for the airborne particle concentration and particle size distribution for loose-housed livestock (sheep) within an animal room and a soft-walled negative pressure enclosure, (2) establish an engineered source (aerosolized salt solution) that replicates the airborne distribution observed with housed sheep, and (3) determine the performance characteristics and level of protection of a soft-walled negative pressure enclosure in biocontainment.
Method
The experimental approach used to evaluate the performance of the containment enclosure is based on demonstrated methods for determining the performance of filters and filtration apparatus.3 -5 Specifically, challenge particles are delivered to the system of interest, and analytic equipment is utilized to monitor the ability of the system to collect or retain the challenge particles. In this study, the system of interest is a soft-walled negative pressure containment enclosure. Particles are delivered to the inside of the containment enclosure, and the particle concentration was monitored inside and outside the containment enclosure as a function of time.
Containment Enclosure
A soft-walled negative pressure containment enclosure (model PU-2525-02-01; bioBUBBLE Inc, Fort Collins, Colorado) was configured for use with large animals by placing a modular kennel inside the enclosure (Lab Products Inc, Seaford, Delaware). The containment enclosure measures 2.29 m × 1.37 m × 2.44 m (wide × deep × tall). The volume of the enclosure is 7.66 m3. The 4 walls and the ceiling of the enclosure comprised individual sheets of soft vinyl plastic that are joined with Velcro-type connectors and supported by an aluminum frame. The front wall has a zippered access point that extends vertically from the top to the bottom, as shown in Figure 1. The ceiling has an opening in it that allows for penetration of a HEPA filtration unit (AFH 2424; bioBUBBLE Inc). The soft ceiling is fastened to the HEPA filtration unit with Velcro-type connectors. When the walls are in place on the frame, there is a 7-cm space between wall and the floor, allowing for air to be drawn into the enclosure at the floor and subsequently filtered and exhausted through a HEPA filtration unit at the top of the enclosure. According to the manufacturer’s specifications, the air flow rate through the HEPA filtration unit is 8.5 m3/min. The soft-walled negative pressure enclosure was placed within a decontaminated ABSL-4 room whose volume is 74.98 m3, as shown in Figure 2. HEPA-filtered air was delivered to the ABSL-4 room through a ceiling vent at a rate of 31.2 ± 0.1 m3/min and exited the room though 2 ceiling exhaust ports at a combined rate of 42.5 m3/min.
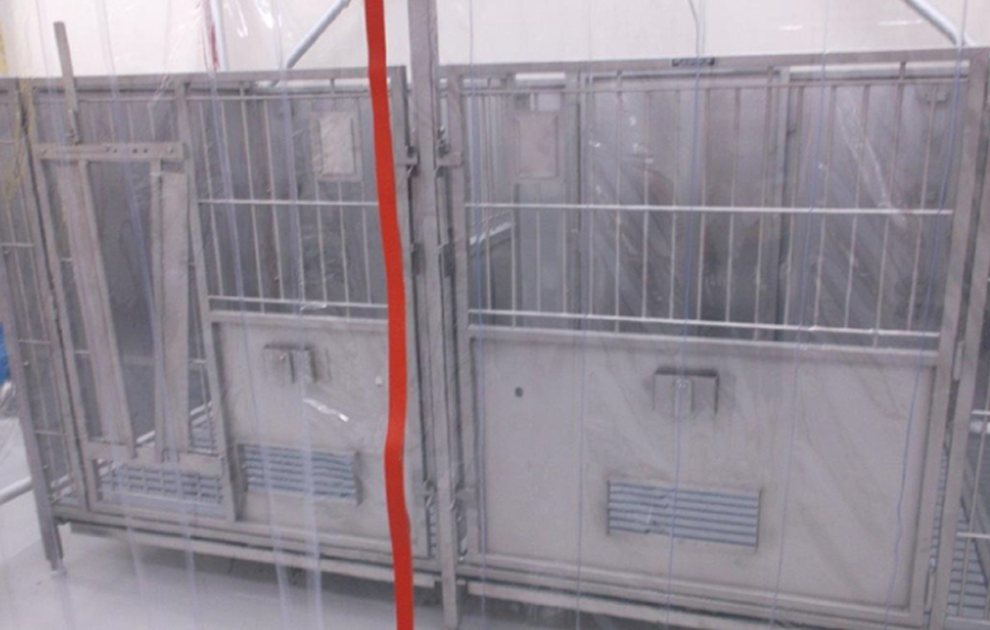
Soft-walled negative pressure containment enclosure with pen housing system.
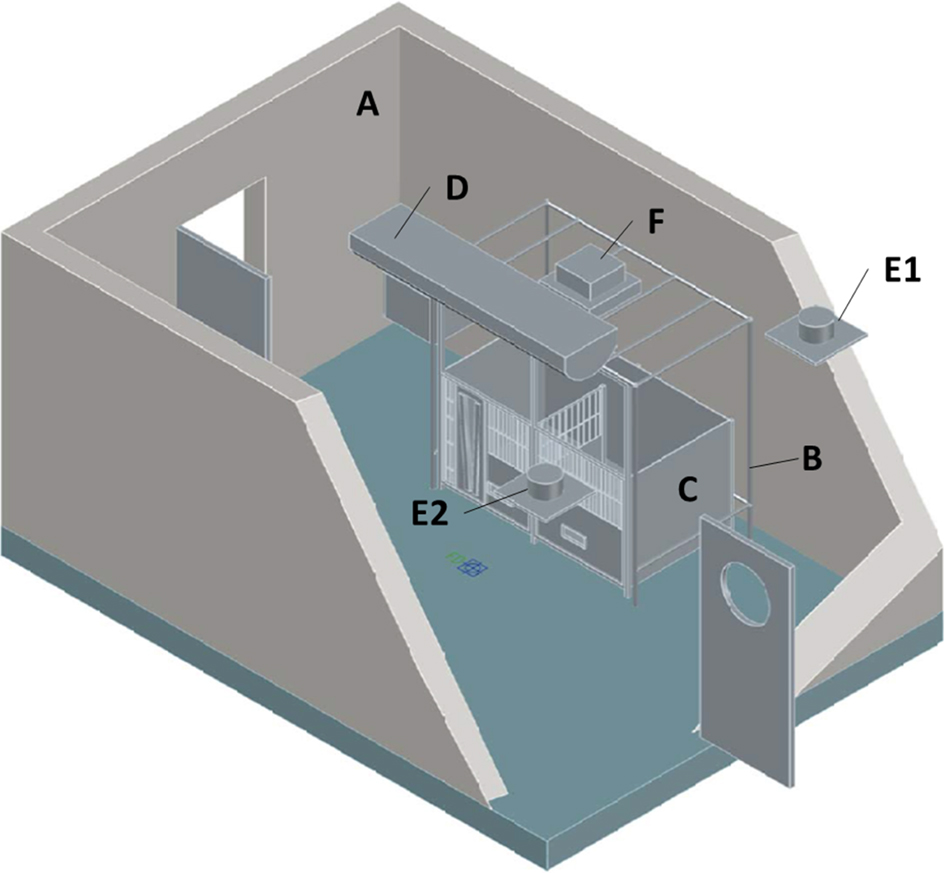
Location of the soft-walled containment enclosure with the animal biosafety level 4 (ABSL-4) room. A, ABSL-4 room; B, soft-walled containment enclosure support frame; C, kennel; D, ABSL-4 room air inlet vent; E1 and E2, ABSL-4 room exhaust vents; F, containment enclosure HEPA filtration unit. The soft walls of the containment enclosure are not shown.
Particle Concentration Measurements
All particle concentration measurements were made with handheld particle counters (AeroTrak model 9303-01; TSI Inc, Shoreview, Minnesota).6,7 The AeroTrak particle counter uses light scattering to count and size individual particles over the size range of 0.3 to 25 μm. Unless otherwise specified, all particle concentration data that are reported herein are the cumulative particle concentration measured over the complete size range of the particle counter. An internal pump draws air through the AeroTrak at a rate of 2.83 L/min. During testing, the particle counters were configured to continuously repeat a cycle that comprised a 110-second data collection and a 10-second pause unless specified otherwise.
Particle Concentration Measurements With Housed Sheep
Particle concentrations were measured inside the primary containment enclosure for 10 minutes on 2 separate occasions when 2 Dorset sheep were present. The sheep were approximately 8 weeks old, between 25 and 30 lb (Figure 3). These measurements were used as a benchmark for the development of a saline solution that matched the size distributions of particles produced by sheep. In this way, the saline solution could be used as a surrogate of sheep particulates for more detailed analyses of the performance characteristics of the containment enclosure. Sheep were housed within a soft-walled enclosure in a decontaminated animal biosafety level 4 room. A fan was used to simulate sheep freely moving around the pen.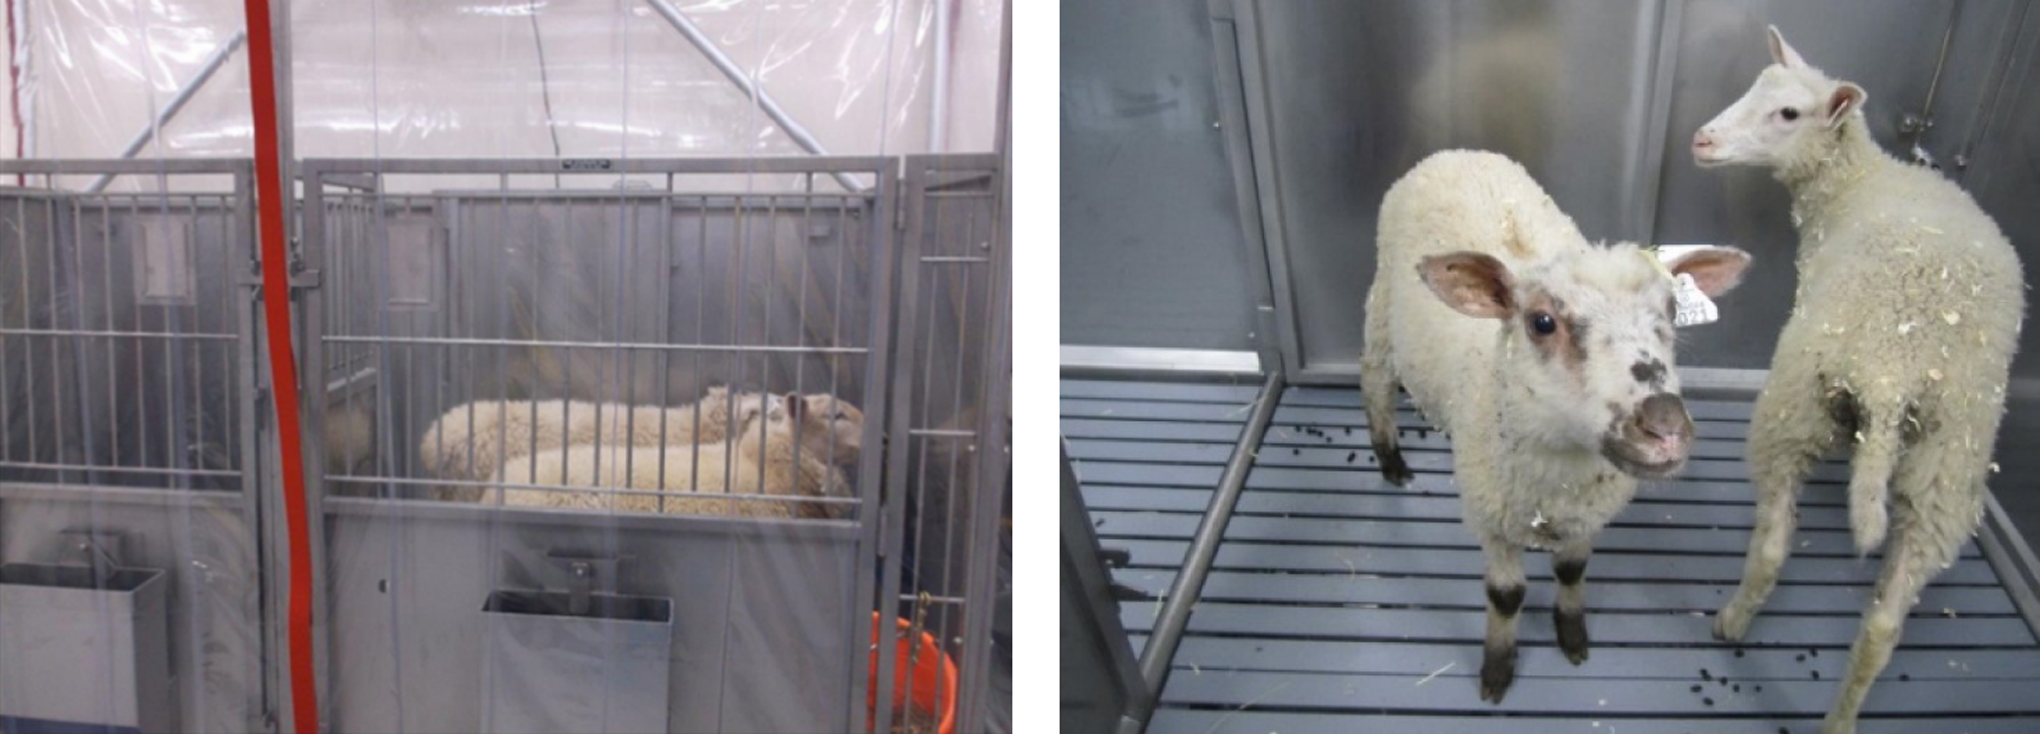
Containment Enclosure Performance Assessment
For each test, sodium chloride particles were generated by atomizing a solution of sodium chloride in water with an ultrasonic humidifier (Drop Humidifier model EE-5301; Crane USA Inc, Itasca, Illinois) located near the center of the kennel. The output of the humidifier was 102.2 ± 20.5 mL/h. Atomization of chloride solution produces wet particles, which rapidly evaporate. The goal was to produce sodium chloride particles whose size distribution is similar to that of the airborne particles observed when large animals were present in the containment enclosure. The final particle size of the sodium chloride particles is dependent on the initial droplet size distribution produced by the humidifier, the concentration of salt present in solution, and the relative humidity of the room. 6 Given that the initial particle size produced by the humidifier and the average room relative humidity (49.5% ± 1.9%) are nearly constant, the concentration of salt present in the solution was varied to achieve a particle size distribution matching that observed with the animals present in the enclosure. It was determined that utilizing a 1.3% (wt/vol) solution of sodium chloride (Morton Table Salt Plain; Morton Salt Inc, Chicago, Illinois) in water produced an appropriate particle size distribution.
The concentration of ambient airborne particles was much greater in the hallway outside the ABSL-4 room. Therefore, the entry of personnel into the room to set up the test apparatus resulted in an increase in the ambient particle concentration measured inside the ABSL-4 room. Therefore, a programmable timer (Digital Lamp and Appliance Timer model SA140; Sylvania, Danvers, Massachusetts) was used to delay the initiation of the aerosol generation for 30 to 60 minutes following exit of personnel from the room to allow the ambient particle concentration in the room to return to normal ABSL-4 background levels. The automatic timer was also used to control the duration of the aerosol generation period by turning the humidifier on and off at preprogrammed times. The humidifier was operated for 1 minute unless otherwise noted, since this duration resulted in airborne particle concentrations inside the enclosure that were close to the maximum concentration of the particle counter.
Two separate sets of tests were performed. In the first set of tests, aerosol was generated without the soft walls and HEPA-filtered exhaust of the enclosure present, to determine the concentration of particles that would be present at various sampling locations in the room without the enclosure. Three replicates were performed in this configuration. In the second set of tests, aerosol was generated with the soft walls in place and the HEPA filtered exhaust operating. Three replicates were also performed in this configuration.
The average measured particle concentrations for each series of tests were compared and utilized to calculate a protection factor for the enclosure. The protection factor was defined as the ratio of the average concentration of particles measured at the particle counter (Cwo ) without the enclosure present, less average pregeneration background (CB ), to the average concentration of particles measured at the particle counter (Cw ) with the enclosure present and operating, less average pregeneration background (CB ; see equation 1). The pregeneration background level was determined by taking the average particle concentration for a period of up to 45 minutes immediately before the particle generation period. The protection factor was calculated with concentration data collected at 2 different sampling locations: (1) directly in front of the room exhaust (E1 in Figure 2) and (2) near the base of the vinyl wall of the enclosure where room air is drawn into the enclosure.
Particle decay rates were also determined for the ABSL-4 room to determine if operation of the soft-walled negative pressure containment enclosure goes beyond containing particulate and actually increases the rate at which particles are removed from the room. An initial set of tests was performed to determine the ABSL-4 particle decay rate without the containment enclosure operating to estimate the baseline decay rate in the room. For these tests, the walls and ceiling of the containment enclosure were removed, and the particle decay rate in the ABSL-4 room was estimated for sodium chloride particles and ambient air particles from the exterior hallway. The HEPA filtration unit on the soft-walled containment enclosure was not operating during these challenges. An additional series of tests were performed with the containment enclosure in place and the HEPA filtration unit operating, to determine if enclosure and HEPA filtration unit increased the measured decay rate. For these tests, sodium chloride particles were generated in the ABSL-4 room outside the containment enclosure. For both series of tests, the particle concentration was measured at the room exhaust. The particle concentration as a function of time (Ct ) in the ABSL-4 room can be fit to a first-order rate equation (equation 2) to determine the rate of particle decay. 10 The ratio of the room ventilation rate (r) to the room volume (vR ) defines the decay rate constant (k). The particle decay rate for a given test was determined by plotting the particle concentration on a log scale as a function of time and fitting to the linear portion of the decay (ie, estimating k) with Microsoft Excel 2013 to reconstruct the exponential curve.

Results
Aerosol Particle Size Distributions
The size distribution of the sodium chloride challenge particles produced by the humidifier, given as percentage in each of the 3 size bins measured, is shown in Table 1. For comparison, the size distribution of particulate observed when 2 sheep were present in the containment enclosure kennel is also shown. The humidifier was able to produce a particle size distribution similar to that observed when large animals were present within the containment enclosure. The particle size distribution of the ambient particulate present outside the ABSL-4 room is also shown.
Particle Size Distributions Measured With the AeroTrak Particle Counter.a
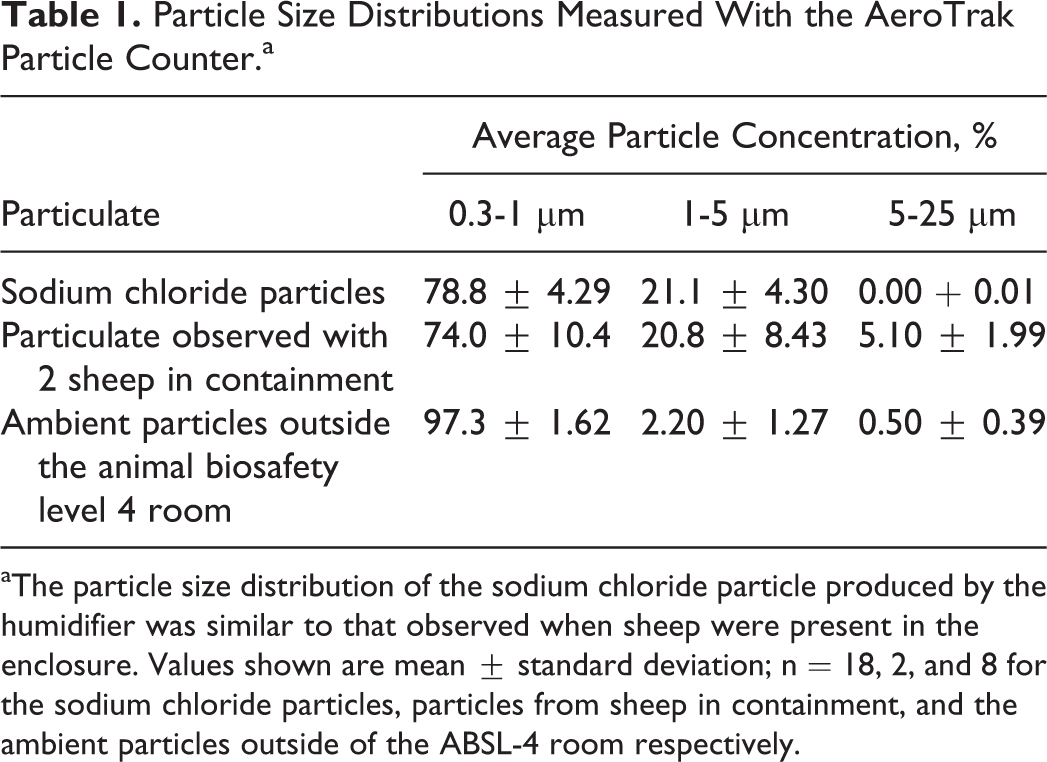
The particle size distribution of the sodium chloride particle produced by the humidifier was similar to that observed when sheep were present in the enclosure. Values shown are mean ± standard deviation; n = 18, 2, and 8 for the sodium chloride particles, particles from sheep in containment, and the ambient particles outside of the ABSL-4 room respectively.
Protection Factors
Figure 4 shows 2 aerosol particle concentration profiles. The first profile, in red, represents the particle concentration measured inside the enclosure for 1- and 2-minute aerosol generation periods, initiated at approximately 65 and 190 minutes, respectively. The second profile, in blue, represents the background particle concentration measured at the room exhaust with the enclosure present and operating during the same period as the first profile. The particles present in both profiles prior to 30 minutes are due to particles that entered the ABSL-4 room following entry and exit of personnel from the hallway outside the room. This concentration decreased to the background level of the room once it was sealed prior to initiation of testing.
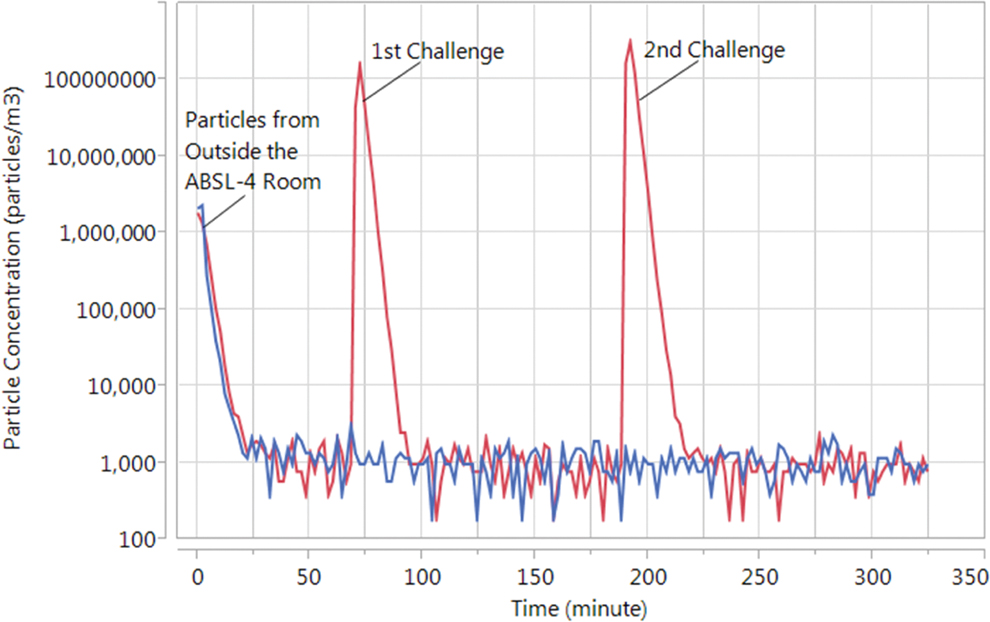
Typical aerosol particle concentration profiles inside the enclosure. The red tracing shows the particle concentration measured inside the enclosure for 1- and 2-minute aerosol generation periods, initiated at approximately 65 and 190 minutes, respectively. The blue tracing shows the particle concentration measured at the room exhaust with the enclosure present and operating during the same period as the red tracing. The high particle concentration present in both tracings prior to 30 minutes is due to entry and exit of personnel from the hallway outside the room, which had a significantly higher background particle concentration than the animal biosafety level 4 room. This concentration decreased to the background level of the room once it was sealed prior to initiation of testing.
In Figure 5, 2 separate profiles are again shown. The first profile, in red, represents the particle concentration measured at the room exhaust without the enclosure present for a 1-minute aerosol generation period. The second profile, in blue, represents the particle concentration measured at the room exhaust with the enclosure present and operating.
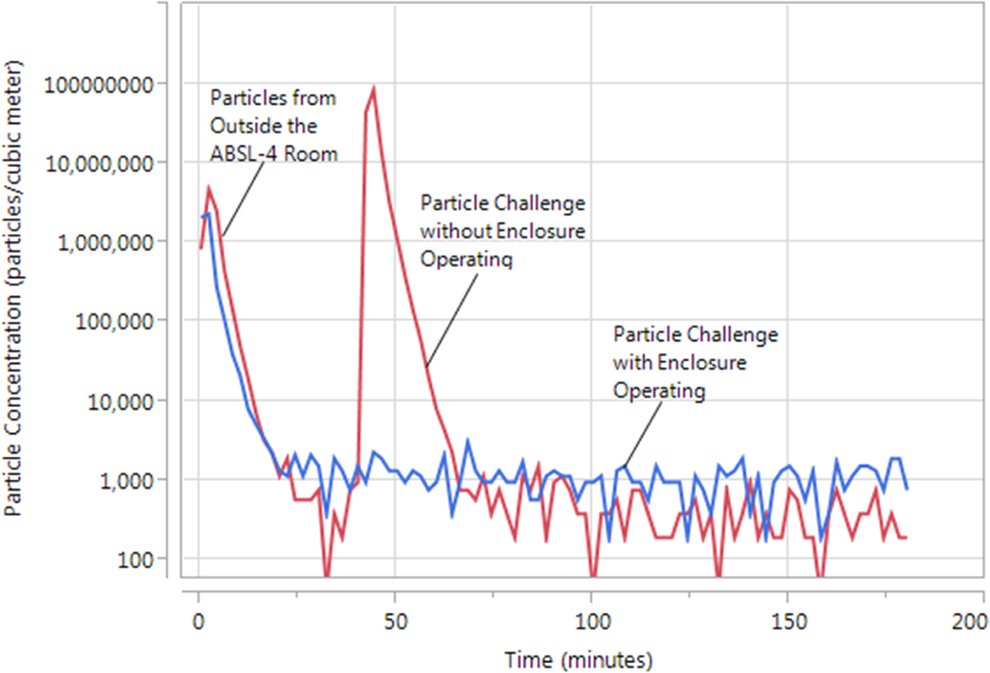
Typical aerosol particle concentration profiles in the ABSL-4 room with and without the enclosure present. The red tracing shows the particle concentration measured at the room exhaust without the enclosure present for a 1-minute aerosol generation period. The blue tracing shows the particle concentration measured at the room exhaust with the enclosure present and operating. The high particle concentration present in both tracings prior to 30 minutes is due to entry and exit of personnel from the hallway outside the room, which had a significantly higher background particle concentration than the animal biosafety level 4 room. This concentration decreased to the background level of the room once it was sealed prior to initiation of testing.
The protection factor was estimated for tests in which aerosol was generated for 1 minute, and the results are shown in Tables 2 and 3. The calculated protection factor when concentrations were measured at the room exhaust was 45 896 (Table 2). The calculated protection factor when concentrations were measured at a point near the base of the enclosure was 70 448, similar to that calculated at the room exhaust (Table 3).
Particle Concentrations Measured at the Room Exhaust for a 1-Minute Aerosol Generation Period.a
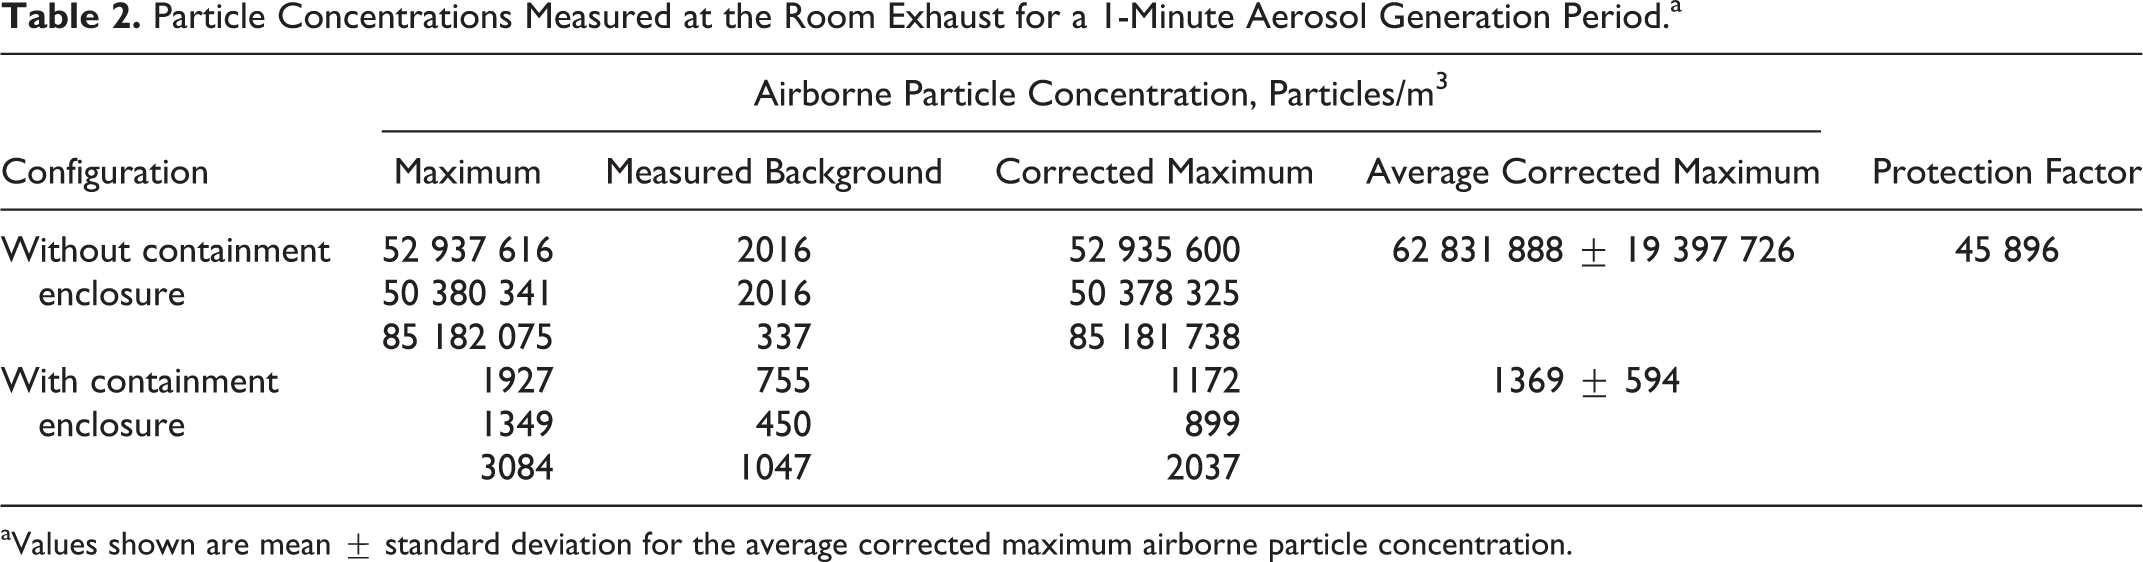
Values shown are mean ± standard deviation for the average corrected maximum airborne particle concentration.
Particle Concentrations Measured at the Enclosure Base for a 1-Minute Aerosol Generation Period.a
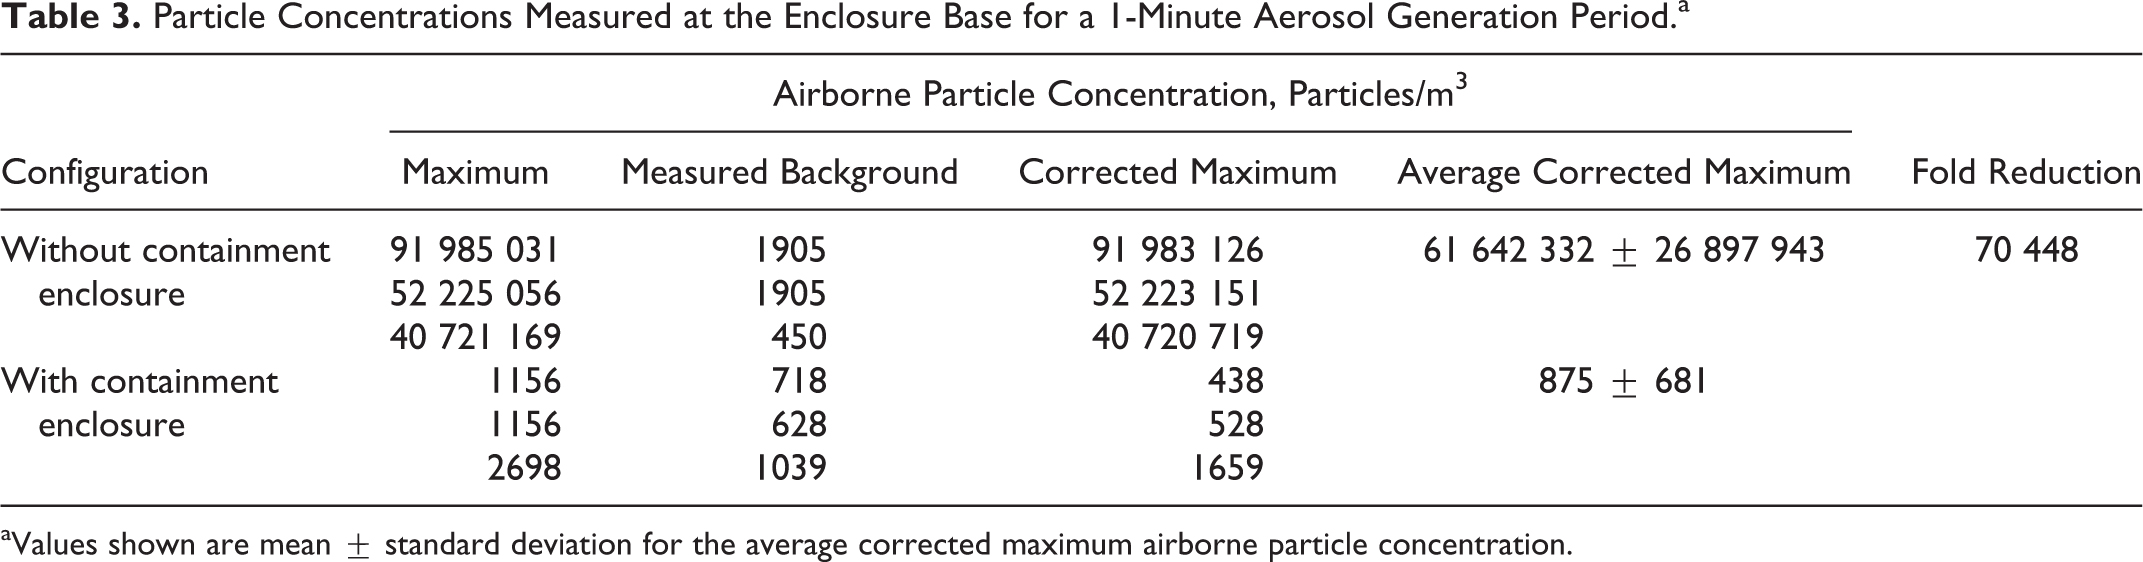
Values shown are mean ± standard deviation for the average corrected maximum airborne particle concentration.
Room Decay Constants
The particle decay constants, with and without the enclosure present and HEPA filtration unit operating, are shown in Table 4 and Figure 4. Without the enclosure present, the decay rate was found to be 0.410 ± 0.012 min-1, whereas with the enclosure present and the HEPA filtration unit operating, the decay rate increased to 0.560 ± 0.0321 min-1. The difference in the observed decay rates is significant when compared with a 1-way analysis of variance with a Neuman-Keuls posttest (P < .0001; GraphPad Prism 5.04, GraphPad, La Jolla, California). Representative tracings of the particle concentration versus time with and without the enclosure present and operating are shown in Figure 6.
Decay Constants for the ABSL-4 Room With and Without the Enclosure Present.a
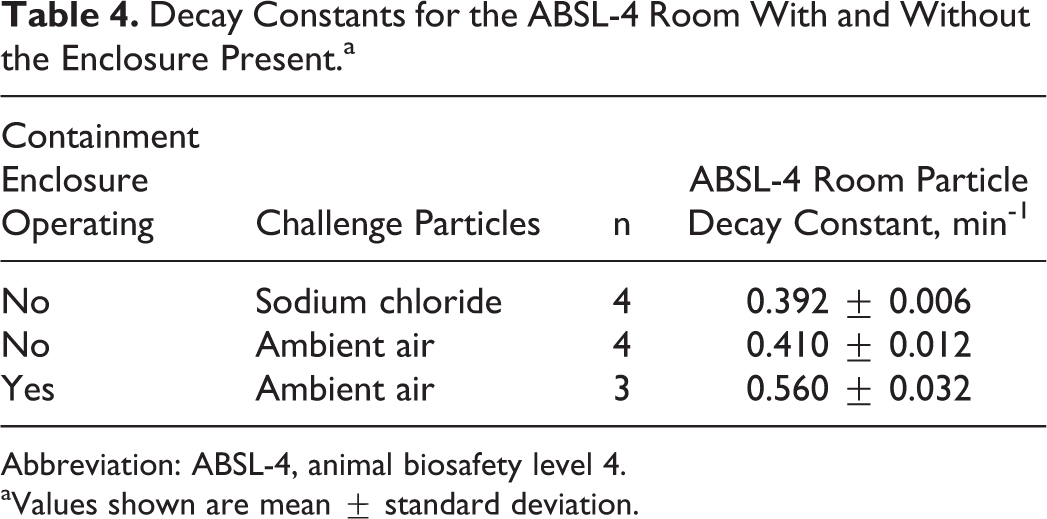
Abbreviation: ABSL-4, animal biosafety level 4.
Values shown are mean ± standard deviation.
Representative concentration decay profiles for the animal biosafety level 4 room with and without the enclosure present. The decay constant measured with the enclosure present and HEPA filtration unit operating (0.560 ± 0.032 min-1) was significantly greater than the decay constant measured without the enclosure and HEPA filtration unit present (0.410 ± 0.012 min-1), suggesting that the presence of the enclosure and HEPA filtration unit significantly enhances clearance of aerosol particles from the room. Particle concentration was measured at the room exhaust for both tracings.
Discussion
The use of soft-walled negative pressure containment enclosures provides several important safety functions for animal care staff:
Particle concentrations outside the enclosure were, on average, a minimum of 45 000 times greater when compared with the particle concentrations measured without the enclosure present (eg, when animals are simply in cages or pens). Such levels of particle reduction provide significantly increased protection against infectious airborne particles for animal care staff. Large increases in particles within the containment enclosure are contained within the enclosure, with no detectable increase in concentration above background levels in the ABSL-4 room. Specifically, during 1- and 2-minute particle injections mimicking sheep aerosols inside the containment enclosure, there was no significant increase in particle concentrations at the ABSL-4 room exhaust vents.
The particle decay rate of the ABSL-4 room increases outside the enclosures. The presence of the containment enclosure’s HEPA filter results in the room air being cleaned at a faster rate as compared with an animal room without an enclosure. This is important because many animal husbandry tasks—such as cage and pan cleaning, animal feeding, and body fluid specimen collection—require the enclosure to be opened for a specific time. Having the enclosure (and its powerful HEPA filter exhaust motor) operating ensures that any plumes of particles will be cleared out at a faster rate than a conventional animal room.
Limitations
Under the experimental conditions tested, there was no evidence of particles escaping from the soft-walled enclosure into the room. There are scenarios where it is likely to have particles escaping into the room, including when working with the doors of the enclosure open. The material balance model that we developed can help address this and other operating scenarios and trade-offs.
Based on the experimental evidence, soft-walled negative pressure containment enclosures provide an increased level of cleanliness to ABSL-4 operations, including that for animal species that are typically housed in open caging (eg, rabbits and nonhuman primates) or loose-housed species (eg, sheep, goats, and pigs).
Animal Use Statement
All research was conducted in compliance with the Animal Welfare Act 8 and other federal statutes and regulations relating to animals and experiments involving animals and adheres to principles stated in the Guide for the Care and Use of Laboratory Animals. 9 The facility where this research was conducted is fully accredited by the Association for Assessment and Accreditation of Laboratory Animal Care International.
Footnotes
Acknowledgments
We thank the following people for their contribution and assistance to the completion of this project: Ron Bowman, Jason Harrington, Stacy Miller, Susan Miller, Mike Schuit, and Dr Jim Swearengen.
Authors’ Note
The views and conclusions contained in this document are those of the authors and should not be interpreted as necessarily representing the official policies, either expressed or implied, of the US Department of Homeland Security. In no event shall the Department of Homeland Security, National Biodefense Analysis and Countermeasures Center, or Battelle National Biodefense Institute have any responsibility or liability for any use, misuse, inability to use, or reliance upon the information contained herein. The Department of Homeland Security does not endorse any products or commercial services mentioned in this publication.
Declaration of Conflicting Interests
The author(s) declared no potential conflicts of interest with respect to the research, authorship, and/or publication of this article.
Funding
This work was funded under contract HSHQDC-15-C-00064 awarded by the Department of Homeland Security Science and Technology Directorate for the management and operation of the National Biodefense Analysis and Countermeasures Center, a federally funded research and development center.