
Abstract
Emotions impact our everyday life. The ability to regulate one`s emotions and attentional focus are important aspects mindfulness-based interventions teach us. Mindfulness-based interventions (i.e. mindfulness meditation, mindfulness-based stress reduction, mindfulness-based cognitive therapy) have been derived from Buddhism and introduced to medicine around 40 years ago (mindfulness-based stress reduction program1,2). Ever since, mindfulness-based interventions have been proven to effectively reduce psychological and physical symptoms in healthy individuals as well as in those who suffer from cancer (for a review see Ref. 3 ; for a meta-analysis see Refs.4,5). All over the world around 18 million people are diagnosed with cancer every year—a diagnosis which impairs the quality of life and poses physical as well as psychological burden on patients.6,7 One of the most prevalent psychological diseases associated with cancer is depression8,9 (for a review see Ref. 10 ; for a meta-analysis see Ref. 11 ). Several studies have shown that patients with depression display “negativity bias” meaning that they pay more attention to negative than to positive stimuli12 -15(for a review see Ref. 16 ). A systematic review and meta-analysis by Schumer et al 17 stated that even a brief mindfulness-based intervention may lead to a modest reduction in negative affectivity. In line with that, a review by Tang et al 18 reasoned that mindfulness practice reduces stress and enhances emotion regulation abilities.
There are multiple ways to assess emotion regulation on a neurophysiological basis. Scalp-recorded event-related potentials (ERPs) enable the assessment of neural responses to affective stimuli with excellent temporal resolution (i.e. milliseconds).19 -21 Therefore, ERPs have become an important tool in the assessment of emotional regulation. The P300 or P3 is a positive wave occurring 250 to 600 ms after stimulus presentation and is assumed to represent attention allocation, initial memory storage 22 as well as evaluation of emotional stimuli. 23 In order to elicit P3, oddball paradigms can be used in which an auditory or visual oddball is infrequently displayed. Thus, the P3 is considered to display the reaction to this unexpected stimulus.24 -26 Olofsson et al 19 summarized in their review that major determinants of P3 amplitude were task-relevance, motivational significance, and arousal level. In addition, they stated that valence levels (negative vs. positive) might modulate P3 when arousal levels (high vs. low) are controlled. Furthermore, P3 alterations have been observed for different states, traits, and mood disorders. Cavanagh and Geisler 27 found that patients with depression displayed decreased P3 amplitudes and delayed P3 latencies when looking at happy faces in comparison to healthy controls. In their interpretation patients with depression displayed reduced cognitive processing ability for mood inconsistent happy faces. These findings emphasize P3 amplitudes and latencies as neurophysiological correlates for changes in emotion regulation in depressed individuals. Taken these findings together, P3 can be considered a valid neurophysiological marker for the assessment of emotion processing.
P3 has been shown to be influenced by mindfulness-based interventions. Diverse studies even suggest P3 as an objective marker for meditation experience. For instance, Atchley et al 28 found that meditators showed increased P3 amplitudes for target tones when instructed to attend to these while showing greater attenuation of P3 amplitudes when instructed to ignore them. Similarly, Sarang and Telles 29 looked at the effects of cyclic meditation in comparison to supine rest on P3. Their participants practiced cyclic meditation for at least 3 months. The authors observed that P3 peak amplitudes at Fz, Cz, Pz were significantly increased and P3 latencies significantly decreased after cyclic meditation. They concluded that cyclic meditation led to increased stimulus processing speed, attentional resources, and efficiency. In a similar manner, Telles et al 30 examined participants who received a 3-month orientation program in OM meditation. This time, they assessed changes in P3 during the practice of 4 different mental states, namely (a) random thinking, (b) non-meditative focusing, (c) meditative focusing, and (d) defocused meditation. Results showed significantly increased P3 amplitudes during meditative sessions (i.e. meditative focusing and defocused meditation). Further, defocused meditation led to significantly decreased P3 latencies. Yoshida et al 31 investigated P3 modifications in non-meditators following focused attention meditation. For this the researchers conducted EEG recordings including a three-stimulus oddball task before and after 8 weeks of focused attention meditation training. Their results showed that the meditation group displayed significantly increased P3 amplitudes and shorter reaction times in comparison to the control group. Regarding sustained modulation of emotion regulation Gootjes et al 32 investigated the effects of Yogic meditation on amplitudes of P3 and LPP (late positive potential). The researchers observed that cognitive reappraisal led to reduced P3 and LPP amplitudes. They reasoned that Yogic meditation is associated with increased positive affect and thought control ability. A review investigating neurophysiological effects of meditation summarized that ERP studies indicate increased attention and enhanced emotional control in meditators. 33
Taken all findings together mindfulness-based interventions seem to modulate P3 amplitudes and P3 latencies, thus influencing attention allocation, emotional regulation, and processing speed in meditators.
Looking at the findings of emotion regulation and mindfulness-based interventions on P3, we aimed to investigate in which ways mindfulness-based intervention may enhance emotion regulation and reduce depressive symptoms in oncological patients. For this, we looked at effects on (i) P3 amplitudes and latencies at Fz, Pz, and Cz as neurophysiological markers of emotion regulation and (ii) clinical outcomes. From this, we derived our hypotheses. Regarding depressive symptoms as indicated by PHQ-9 sum scores we expected a significant reduction after our mindfulness-based intervention. Replicating findings in healthy participants, we expected P3 amplitudes to be significantly higher for high arousal stimuli than for low arousal stimuli. Further, we expected P3 amplitudes for negative stimuli to be significantly lower and P3 amplitudes for positive stimuli to be significantly higher after our mindfulness-based intervention. Also, we expected P3 latencies to be significantly shorter after mindfulness-based intervention reflecting faster processing speed.
To our knowledge, this is the first study that investigated the effects of a mindfulness-based intervention on P3 parameters in oncological patients. Knowledge derived from our data could thus be of use for psycho-oncological treatment as well as in research settings.
Method
The presented single arm waitlist-controlled study was part of a randomized-controlled trial (for results see Ref. 34 ) which was registered at the German Clinical Trials Register ID: DRKS00015773. Approval of the ethics committee of the Medical Faculty of the University of Duisburg-Essen (Nr.: 18-8079-BO) to perform this study was obtained. The study was conducted from October 2018 to April 2021. It was interrupted during the first COVID-19 pandemic shutdown in Germany from March 2020 to May 2020.
Study Design and Procedure
The current study focused on changes in P3 and depression measurements after mindfulness-based intervention in comparison to a wait-list control phase (see Figure 1). After recruitment, all patients were given full information about the study procedure and their rights as participants in a personal meeting with the principal investigator (MF) after which informed consent was granted. Afterward patients filled in the first set of questionnaires and the first EEG (t0) was recorded. Following, a waiting period of 5 weeks took place. Subsequently, patients came in for the second EEG-recording (t1) and filled in the second set of questionnaires. Then, the mindfulness-based group intervention took place twice a week over 5 consecutive weeks. Shortly after, the third EEG (t2) was recorded, and patients filled in the third set of questionnaires.

CONSORT flow diagram.
EEG Data Acquisition
Patients sat comfortably in an insulated, lightly dimmed room, 1.5 m distant from the presentation screen. Active sintered Ag-AgCl electrodes of the extended 10 to 20 system were used for derivation: Fp1, Fp2, F7, F3, Fz, F4, F8, Fc7, Fc3, Fcz, Fc4, Fc8, T3, C3, Cz, C4, T4, Tp5, Cp3, Cpz, Cp4, Tp6, T5, P3, Pz, P4, T6, Oz. Fz was used as recording reference. To control for eye movements, horizontal and vertical EOG (VeogAbove, VeogBelow, HeogLe, HeogRi) were recorded. Patients were instructed to click either the left or right button of a computer mouse whenever they perceived a presented picture as emotionally negative or positive which was randomized across patients. No reaction was required for neutral stimuli. Hereby, it was emphasized that only their subjective perception should be decisive. For EEG-data recording, we used a 32-channel BrainVision DC-EEG amplifier and BrainVision-Recorder software (BrainVision-Recorder, Version 1.23.0001, Brain Products GmbH, Gilching, Germany) which recorded at a sampling rate of 1000 Hz in the frequency range from 0.016 to 250 Hz. The software Presentation® (Version 20.2, Neurobehavioral Systems, Inc., Berkeley, CA, http://www.neurobs.com) was used for stimulus presentation.
Visual Oddball Paradigm
For investigation of emotional processing, a visual oddball paradigm with emotionally significant target stimuli was used. The 230 visual target stimuli (for IAPS identification numbers see Appendix) were derived from the international affective picture system (IAPS)35,36 and presented for 500 ms with an inter-trial interval of 2500 ms. The EEG measurement took place for 30 minutes, resulting in 600 stimuli presentations per participant. The target stimuli contained of different valence (positive – negative) and arousal (low – high) levels, namely positive-low (5%), positive-high (5%), negative-low (5%), negative-high (5%). The remaining 80% of visual stimuli had neutral content. The picture set consisted of 70 neutral stimuli (Mvalence = 5.124 (0.349); Marousal = 3.034 (0.561)), 80 positively valenced (40 arousalhigh, 40 arousallow) and 80 negatively valenced stimuli (40 arousalhigh, 40 arousallow). The mean arousal and valence ratings were as follows: arousallow/valenceneg = 4.512 (0.345) and 2.86 (0.31), arousalhigh / valenceneg = 6.483 (0.321) and 2.87 (0.45); arousallow / valencepos = 4.44 (0.251) and 7.232 (0.223); arousalhigh/valencepos = 6.547 (0.399) and 7.158 (0.372). The stimuli sets were based on IAPS scores. IAPS scores of valence dimension ranged from 1 (very unpleasant) to 9 (very pleasant) and of arousal dimension from 1 (very relaxing) to 9 (very exciting). Both differed significantly from the neutral set (valence: F(4.12) = 13 454.8, P ≤ .001; arousal: F(4.3) = 41 242.890, P ≤ .001).
EEG Data Analyses
Analyzes of EEG data was performed with BrainVision Analyzer software (BrainVision Analyzer, Version 2.2.0, Brain Products GmbH, Gilching, Germany). P3 amplitudes and latencies of midline electrodes (Fz, Pz, Cz) in response to emotional stimuli were of primary interest. First, movement artifacts were excluded from further analysis before re-referencing the data to left and right earlobes as new reference. Then, a bandpass finite impulse response filter between 0.032 and 30 Hz was applied and eye movements were corrected using an implemented independent component analysis. 37 In the following, data were segmented (−100 to 1000 ms), baseline-corrected (−100 to 0 ms) and averaged for each individual and combined test condition: standard neutral (S10), valence positive/arousal low (S20), valence positive/arousal high (S25), valence negative/arousal low (S30), valence negative/arousal high (S35), arousal low/valencepositive and negative (S20_S30), arousal high/valence positive and negative (S25_S35); valence positive/arousal low and high (S20_S25), valence negative/arousal low and high (S30_S35), and all deviances (S20_S25_S30_S35). Thus, yielding in total 10 different test conditions. In a last step positive peak amplitudes of the P3 at Fz, Cz, and Pz from the single-subject averages were identified in the time range from 250 to 600 ms after stimulus onset. Resulting data sets were then exported to SPSS, Version 27.0 (IBM SPSS Statistics for Windows, Armonk, NY: IBM Corp, 2019) for further statistical analyses.
Depression Measurement
Depression was measured by the German version of the Patient Health Questionnaire Depression Scale–9 (PHQ-9)38,39 which is composed of 9 items and has a Cronbach’s α of .839. 40 The items refer to symptoms patients experienced within the past 14 days and range from 0 (never) to 3 (almost every day). Sum scores range from 0 to 27, indicating symptom severity. Scores under 5 indicate the absence of depressive symptoms. Mild severity is assumed for scores ranging from 5 to 9, moderate severity for scores from 10 to 14, strong severity for scores from 15 to 19 and highest severity for scores 20 or higher.
Mindfulness-Based Intervention
The intervention manual (available upon request) was handed to the patients in the first session and was composed of the German translation of validated and widely used exercises for mindfulness-based interventions.41,42 The mindfulness-based intervention was held in small groups (2-5 patients) and led by an experienced and trained meditation trainer (MF). During sessions patients learned about the theory of mindfulness and practiced different techniques to approach a mindful mindset. The sessions started with breathing meditation in which patients were trained to focus entirely on their breath. Subsequently, a new technique was trained during each session ranging from stretch meditation to mindful thought experiments. Group sessions lasted for 40 minutes and were held twice a week over a period of 5 weeks. Median attendance was 9 sessions, with a range from 7 to 10 sessions from a total of 10 sessions.
Statistical Analysis
Statistical analyses were performed using SPSS, Version 27.0 (IBM SPSS Statistics for Windows, Armonk, NY: IBM Corp, 2019). For all analyses level of significance was set at α = .05. Values deviating more than three inter-quartile ranges from the mean were identified as statistical outliers via boxplot (n = 1). Descriptive statistics of the PHQ-9, Pz-, Fz-, and Cz-electrode can be found in the Appendix (Tables A1-A6). For interpretation of the PHQ-9 sum scores have been formed. In order to reveal changes over time, we computed a repeated measurement analysis of variance. Time (t0, t1, t2), electrodes (Fz, Cz, Pz), arousal level (low, high), and emotional valence (positive, negative) were set as within factors. Results are reported regarding Greenhouse-Geisser adjusted results as Mauchly’s-test of sphericity yielded significant results. Bonferroni-adjusted pairwise comparisons were used for post-hoc tests. For estimation of effect size η2 has been reported. Here, values < 0.06 can be interpreted as small, values between 0.06 and 0.14 as medium, and values > 0.14 as large effects. 43 In an explorative manner repeated measurement analysis of covariates with age and PHQ-score as covariates were calculated.
Results
Participants
Recruitment took place at the West German Cancer Center, University Hospital Essen. 18 patients were enrolled in the study of which one patient resigned due to fear of COVID-19 infection. Thus, the final sample consisted of 17 oncological patients with a mean age of 51 years (SD = 9.17, range = 32-67). The CONSORT flowchart of the entire RCT is displayed in Figure 1, whereas the single arm described by this paper is circled. Fifteen patients were right-handed, one patient left-handed and one patient ambidextrous. All patients had normal or corrected-to-normal vision. For study inclusion patients had to be diagnosed with a malignant tumor and be aged between 18 and 70 years. Exclusion criteria encompassed major depressive episode (F32.2, F33.3, F33.2, F33.3), history of neurological disease including neurological metastasis, psychotic symptoms or disease, acute suicidality, poor language competence, or drug abuse. Patients had various cancer entities with a median UICC (Union for international cancer control) stage of IV. Demographics, cancer entity and UICC stage of our patients are displayed in Table 1.
Demographics.

P3 Amplitudes
The P3 mean amplitudes across Fz, Cz and Pz decreased from 6.174 µV (t0) to 6.040 µV (t1) to 5.740 µV (t2). Main factor time revealed no significant effect (F(1.839) = 0.596, P = .544, η2 = .036).
The main factor arousal yielded a significant effect (F(1) = 4.511, P = .050, η2 = .220). Post-hoc analyses revealed that high arousal stimuli yielded significantly higher P3 amplitudes than low arousal stimuli (arousallow M = 5.700 µV, arousalhigh M = 6.270 µV, P = .050). The main factor valence as well revealed significant differences (F(1) = 9.848, P = .006, η2 = .38). Post-hoc analyses showed that positive stimuli evoked significantly higher amplitudes than negative stimuli (valencepos M = 6.368 µV, valenceneg M = 5.601 µV, P = .006).
There were no interactions of time * electrode, time * arousal and time * valence (time * electrode: F(3.024) = 1.850, P = .150, η2 = .104 ; time * arousal: F(1.847)= 0.539, P = .575, η2 = .033; time * valence: F(1.942) = 0.309, P = .730, η2 = .019).
The main factor electrode also revealed significant differences (F(1.513) = 11.807, P = .001, η2 = .425). Post-hoc analyses using Bonferroni correction showed that Fz amplitudes (M = 4.421 µV, SE = 0.483, SD = 0.117) differed significantly from Pz amplitudes (M = 8.697 µV, SE = 0.590, SD = 0.143, P = .008) as well as Cz amplitudes (M = 4.836 µV, SE = 0.462, SD = 0.112) differed significantly from Pz amplitudes (P = .001). The difference between Fz and Cz amplitudes was not significant (P = 1.00).
P3 amplitudes with age as covariate
As our patients age ranged from 32 to 67 years, we decided to use the variable age as a covariate in a repeated measures ANOVA. The covariate age did not interact significantly with the main factors electrode (F(1.541) = 0.807, P = .429, η2 = .051) or arousal (F(1) = 2.564, P = .130, η2 = .146). However, the covariate age interacted significantly with the main factor valence (F(1) = 7.636, P = .014, η2 = .337). Also the interaction between time * valence * age yielded significant differences (F(1.934) = 4.428, P = .022, η2 = .228). Looking at the graphs it is shown that amplitudes for positive stimuli were reduced over time.
P3 amplitudes with PHQ-score as covariate
To test whether PHQ-score influences P3 amplitudes we used PHQ-score as a covariate. This yielded no significant main or interaction effect.
P3 amplitudes at Fz, Cz, and Pz
In order to further investigate differences over time at Fz, Cz, and Pz, we used repeated-measures ANOVA. We found no significant differences over time for the P3 mean amplitude at Cz- and Pz-electrodes. However, we found changes in P3 mean amplitude over time for the Fz-electrode. Amplitudes decreased significantly for the following stimulus conditions: neutral (F(1.870 = 6.260, P = .006, η2 = .281), valencepos (F(1.896) = 4.281, P = .025, η2 = .211), arousallow (F(1.724) = 3.525, P = .049, η2 = .181), arousalhigh (F(1.854) = 5.608, P = .010, η2 = .260) and all deviances (F(1.805) = 8.164, P = .002, η2 = .338). For stimuli with valenceneg a trend could be observed (F(1.692) = 2.640, P = .097, η2 = .142).
Post-hoc tests revealed that decreases at Fz-electrode were linear from t0 to t2, but only significant when comparing t0 with t2, not when comparing t1 to t2. For stimuli with valencepos post-hoc tests showed that Fz mean amplitudes decreased from 5.438 µV (t0) to 4.221 µV (t1) to 3.771 µV (t2), P = .044, SE = 0.608. For valenceneg mean amplitudes decreased from 4.321 µV (t0) to 3.764 µV (t1) to 2.789 µV (t2), P = .031, SE = 0.526, SD = 0.128. For arousallow mean amplitudes decreased from 4.732 µV (t0) to 4.069 µV (t1) to 2.971 µV (t2), P = .048, SE = 0.654. For arousalhigh mean amplitudes decreased from 5.379 µV (t0) to 4.297 µV (t1) to 3.189 µV (t2), P = .006, SE = 0.590. These changes are displayed in Figures 2 and 3. For all deviances, Fz mean amplitudes decreased from 4.941 µV (t0) to 3.727 µV (t1) to 2.782 µV (t2), P = .002, SE = 0.484, SD = 0.117.
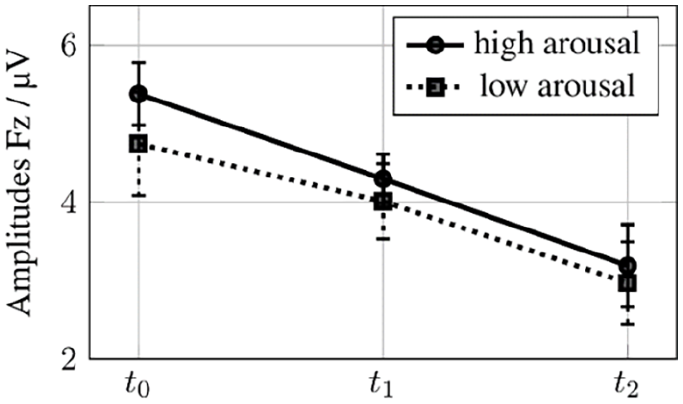
Amplitudes low and high arousal stimuli at t0, t1, t2 with error bars.
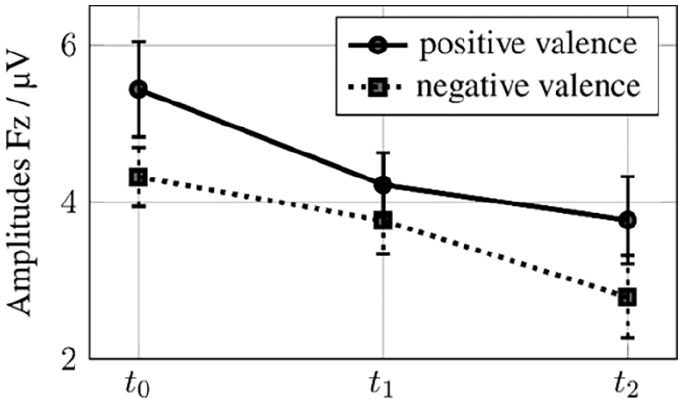
Amplitudes positive and negative valence stimuli at t0, t1, t2 with error bars.
Grand averages were calculated for all patients at t0, t1, and t2 at electrodes Fz, Cz, and Pz as displayed in Figure 4.

Grand averages at Fz, Pz, Cz at t0, t1, and t2. N = 17.
P3 Latencies
The main factor time showed no significant effect on P3 mean latencies across Fz, Cz and Pz (F(1.870) = 0.017, P = .979, η2 = .001). The main factor electrode revealed significant differences in mean latencies (F(1.191) = 4.568, P = .040, η2 = .222). Bonferroni-corrected post-hoc analyses showed that Pz mean latencies of 419.892 ms showed a trend of being shorter than Cz mean latencies of 441.91 ms (P = .066, SE = 8.683, SD = 2.106).
Mean latencies for the main factor valence showed a trend (F(1) = 3.503, P = .080, η2 = .180). Post-hoc comparisons showed that mean latency for negatively valenced stimuli was shorter than for positively valenced stimuli with 427.712 to 439.667 ms, respectively (P = .080, SE = 6.387, SD = 1.549). The main factor arousal revealed no significant differences (F(1) = 2.101, P = .167, η2 = .116).
P3 latencies with age as covariate
No significant interaction between time * age could be observed (F(1.827) = 0.512, P = .586, η2 = .033). The interaction time * valence * age revealed significant differences (F(1.372) = 5.901, P = .017, η2 = .282). Additionally, we could observe a significant interaction effect between time * valence * arousal * age (F(1.912) = 3.375, P = .050, η2 = .184).
P3 latencies with PHQ-score as covariate
To test whether PHQ-score influenced P3 mean latencies, we used PHQ-score as a covariate. This yielded no significant main or interaction effect.
Depressive Symptoms
The prevalence of mild depressive symptoms (PHQ-9 sum scores ≥ 5) in our sample at study inclusion (t0) was 65% (n = 11). The prevalence of moderate depressive symptoms (PHQ-9 sum scores ≥ 10) at t0 was 35%. After a 5-week waiting period before intervention, it decreased slightly to 31% (t1) and after intervention decreased slightly to 29% (t2). Paired sample t-tests were used to compare mean PHQ-scores between t0 (pre-waitlist), t1 (pre-), and t2 (post-treatment). No significant differences could be observed between t1 and t2 (t1/t2: M = 1.750, SD = 4.203, t(15) = 1.665, P = .117). Looking at the waiting period, again no significant differences could be observed (t0/t1: M = 0.188, SD = 3.816, t(15) = 0.197, P = .847). When comparing t0 with t2, a trend could be observed (t0/t2: M = 2.059, SD = 4.465, t(16) = 1.901, P = .075). These findings are displayed in Figures 5 and 6.

PHQ-9 Mean sum score at t0, t1, t2.

Prevalence of moderate depressive symptoms in percentage at t0, t1, t2.
Discussion
To our knowledge this is the first study which investigated changes in P3 mean amplitudes and latencies in response to emotional stimuli with different arousal and valence levels in oncological patients before and after a mindfulness-based intervention. In line with previous studies in other populations, the present study also found changes in P3 characteristics to emotional salient stimuli in a sample of oncological patients. As expected, we could show that amplitudes for high-arousal stimuli yielded higher values than for low-arousal stimuli. Further, we could see that positively valenced stimuli yielded higher P3 amplitudes than negatively valenced stimuli. This implies that even though our sample is psychologically burdened the perception of positively valenced stimuli does not seem to be impaired as oftentimes observed in patients with major depression disorder displaying negativity bias (for a review see Ref. 16 ). At the same time, we observed shorter P3 latencies for negatively valenced stimuli than for positively valenced stimuli. This may suggest a subtle negativity bias in our sample. On one hand this could be explained by the psychological burden our sample had to face and its depressive symptomatology. On the other hand, it could be interpreted as a confrontational approach to negative aspects of life. Further, it has been argued that a faster reaction to negatively valenced stimuli is also observed in psychologically healthy participants as it is crucial for survival to react fast to negative stimuli (e.g., Refs.44,45). Surely, it must be noted that our sample did not consist of patients with major depression disorder, but rather of oncological patients with depressive symptoms.
Regarding electrodes we could replicate the finding that amplitudes for emotional relevant stimuli seemed to evoke highest amplitudes for parietal electrodes, 25 in our case Pz. P3 amplitudes at Pz were significantly higher than P3 amplitudes at Fz or Cz, whereas P3 amplitudes for Fz and Cz did not differ significantly from each other.
Looking more specifically at P3 amplitudes at Fz we could observe a decrease in P3 mean amplitude over time in several conditions. P3 amplitude decreases could be observed for stimuli with positive and negative valence as well as for stimuli with low and high arousal. This effect was also observed when all emotional stimuli were combined. We may interpret this as if patients have learned to react less strongly to emotional salient stimuli over time. Thus, endorsing a higher level of emotional regulation during the course of our study. The P3 can be divided into two components, namely P3a and P3b. Whereas P3a is thought to be derived from frontal lobe areas and to reflect top-down attentional mechanisms and subjective stimulus salience; P3b is believed to originate from the parietal and medial temporal lobe and to reflect the processing of an incoming stimuli, its context updating and subsequent memory storage. 22 As we observed a decrease in P3 mean amplitude over time in several conditions at Fz only, we could assume that this mainly reflects changes of the P3a component. Thus, we could interpret that our participants might have needed less attention allocation for target discrimination during the course of our study which would support the idea of enhanced emotion regulation capacities. In line with that Tillman et al 46 found that the P3a amplitude to trauma-related stimuli in PTSD patients was reduced after successful trauma-focused PTSD treatment. The researchers interpreted this finding as well as enhanced emotion regulation capacities within their participants. Next to target discrimination the P3a in comparison to the P3b component is considered to be more rapidly affected by habituation effects. 47 We used the same visual stimuli derived from the IAPS across all three measurement times. Thus, simple habituation effects might partly explain our observations. Regarding a P3a and P3b component-based analysis, it must be noted that studies which particularly aim at a P3a and P3b component-based analysis usually use a three-stimulus oddball task in order to elicit the distinctive P3a and P3b component more profoundly.
We recruited our patients in the West German Cancer Centre in Essen where patients received ongoing oncological treatment. Thus, at time of inclusion many patients just finished a course of treatment—simply by passing some weeks between treatment and the second measurement might have already improved emotion regulation capacities of our patients. Further, the idea of study inclusion and thus the reception of psycho-oncological support in near future might as well have led to improved emotion regulation capacities. We advise future studies to include a measurement encompassing cancer-related symptom severity to rule out this possible bias. As the effects from pre-to posttreatment displayed a linear decrease, we assume that our mindfulness-based intervention might have partly improved emotional regulation in our patients, thus yielding lower P3 amplitudes for emotional salient pictures. This is in line with a study by Gootjes et al, which has found that Yogic meditation led to reduced P3 and LPP amplitude which the researchers interpreted as increased thought control ability 32 and with the findings of a review by Schumer et al 17 who have found that even short mindfulness-based interventions may reduce negative affectivity. Although it must be noted that other studies on P3 changes after mindfulness-based intervention reported an increase in P3 amplitudes after mindfulness-based intervention rather than a decrease. This is usually explained by heightened attention allocation resources after mindfulness-based intervention.30,31,33 Given the fact that the P3 decrease was only significant when comparing P3 amplitudes at inclusion with P3 amplitudes after treatment, we cannot assume that our mindfulness-based intervention led to the P3 amplitude decrease. Rather it might have been a mixture of adaptation over time and our intervention. This would be in line with the linear character of the decrease of P3 amplitudes.
Oncological patients are especially burdened - psychologically as well as physically.6,7,48 Further, oncological patients have many therapy appointments leaving them with less time for psycho-oncological interventions. To meet their special needs, we have decided for this shortened, manual-based 5-week long intervention. Looking at our results, it might be that oncological patients need a more intensified intervention to profit. Most other studies using mindfulness-based interventions apply a 10-week long intervention, as suggested by Kabat-Zinn. 1 As our intervention only lasted 5 weeks, this period might have been too short to elicit pronounced effects on emotion regulation. This would also explain that PHQ-scores did not improve as much as we have anticipated. Although some studies suggest that even a brief mindfulness-intervention might enhance emotion regulation capacities. 17 Looking only at PHQ-measurements our study lacks statistical power to derive conclusions. Thus, we included PHQ-measurements only to get an idea of the evolution of depressive symptoms, primary object of this study was the investigation of effects of a mindfulness-based intervention on P3 amplitudes and latencies.
Limitations
As our study fell in the time of COVID-19 pandemic, recruitment was more difficult than expected. Especially conducting a study with high-risk patients like oncological patients posed challenges and led to a smaller study sample than anticipated. Furthermore, our study design as a single arm waitlist-controlled design as part of a RCT does not allow for full understanding of underlying mechanisms. This design has been chosen due to the high mortality and morbidity of our patients and to enable all patients immediate access to the intervention. In addition, a higher degree of blinding would certainly have been beneficial.
Clinical and Empirical Implications
Our study supports the idea that oncological patients profit from mindfulness-based interventions in terms of depressive symptomatology as well as emotion regulation capacities as shown by effects on P3 mean latencies and amplitudes. Empirically, this study could inspire other research groups to further investigate changes in P3 characteristics in oncological patients after a mindfulness-based intervention which might lead to the establishment of changes in P3 characteristics as an objective marker for the effectiveness of mindfulness-based interventions in the psycho-oncological treatment. This might support the further establishment of mindfulness-based interventions in psycho-oncological treatment. Thus, enabling more oncological patients to profit from its benefits.
Conclusion
The aim of the current study was to investigate changes in P3 amplitude and latency to emotional stimuli with different arousal and valence levels after mindfulness-based intervention in oncological patients. We could show that arousal and valence levels are important modulators of P3 amplitudes and latencies in oncological patients. P3 mean amplitudes at Fz decreased significantly from study inclusion until after mindfulness-based intervention, decreases from pre-to post-intervention were not significant. Depressive symptoms could be alleviated. We suggest further studies to replicate our findings with a larger and more homogeneous sample to draw clear conclusions. A longer mindfulness-based intervention period may be advisable.
Footnotes
Appendix
Descriptive Statistics of Fz Latencies.

| Outcome | N | M | SD | S (SE) | K (SE) |
|---|---|---|---|---|---|
| t0 FzP3 std Latency | 17 | 475.824 | 85.554 | 0.461 (0.55) | −0.838 (1.063) |
| t0 FzP3 poslow Latency | 17 | 449.412 | 68.194 | 0.809 (0.55) | 1.635 (1.063) |
| t0 FzP3 poshigh Latency | 17 | 464.471 | 80.331 | 0.665 (0.55) | 0.381 (1.063) |
| t0 FzP3 neglow Latency | 17 | 424.353 | 66.299 | 0.568 (0.55) | 2.424 (1.063) |
| t0 FzP3 neghigh Latency | 17 | 438.176 | 83.093 | 0.649 (0.55) | −0.815 (1.063) |
| t1 FzP3 std Latency | 17 | 457.588 | 82.473 | 0.582 (0.55) | −0.674 (1.063) |
| t1 FzP3 poslow Latency | 17* | 420.706 | 84.643 | 1.276 (0.55) | 2.257 (1.063) |
| t1 FzP3 poshigh Latency | 17 | 455.765 | 52.502 | 0.529 (0.55) | −0.258 (1.063) |
| t1 FzP3 neglow Latency | 17* | 422.353 | 74.806 | 0.701 (0.55) | 2.169 (1.063) |
| t1 FzP3 neghigh Latency | 17 | 439.294 | 60.161 | 0.623 (0.55) | −0.065 (1.063) |
| t2 FzP3 std Latency | 17 | 437.941 | 69.865 | 0.905 (0.55) | −0.624 (1.063) |
| t2 FzP3 poslow Latency | 17* | 438.765 | 61.543 | 1.589 (0.55) | 3.298 (1.063) |
| t2 FzP3 poshigh Latency | 17 | 447.353 | 65.844 | −0.037 (0.55) | 0.504 (1.063) |
| t2 FzP3 neglow Latency | 17 | 436.882 | 61.448 | 0.458 (0.55) | 2.83 (1.063) |
| t3 FzP3 neghigh Latency | 17 | 433.706 | 84.797 | −0.332 (0.55) | −0.149 (1.063) |
| ∆P3Fz poslow (t2 − t1) | 17* | 18.059 | 81.362 | −2.006 (0.55) | 5.676 (1.063) |
| ∆P3Fz poshigh (t2 − t1) | 17 | −8.412 | 53.962 | 0.155 (0.55) | 1.827 (1.063) |
| ∆P3Fz neglow (t2 − t1) | 17 | 14.529 | 50.169 | 0.63 (0.55) | −0.493 (1.063) |
| ∆P3Fz neghigh (t2 − t1) | 17 | −5.588 | 56.256 | −0.224 (0.55) | −1.68 (1.063) |
| ∆P3Fz poslow (t2 − t0) | 17 | −10.647 | 44.055 | 0.046 (0.55) | 0.09 (1.063) |
| ∆P3Fz poshigh (t2 − t0) | 17 | −17.118 | 80.721 | 0.613 (0.55) | 0.863 (1.063) |
| ∆P3Fz neglow (t2 − t0) | 17 | 12.529 | 64.94 | −1.14 (0.55) | 3.852 (1.063) |
| ∆P3Fz neghigh (t2 − t0) | 17 | −4.471 | 89.634 | −0.567 (0.55) | −0.464 (1.063) |
| ∆P3Fz poslow (t1 − t0) | 17* | −28.706 | 93.321 | 1.083 (0.55) | 2.766 (1.063) |
| ∆P3Fz poshigh (t1 − t0) | 17 | −8.706 | 71.018 | −0.267 (0.55) | −0.899 (1.063) |
| ∆P3Fz neglow (t1 − t0) | 17 | −2 | 59.537 | −0.887 (0.55) | 0.898 (1.063) |
| ∆P3Fz neghigh (t1 − t0) | 17 | 1.118 | 68.144 | 0.438 (0.55) | 0.049 (1.063) |
Abbreviations: N, sample size; M, mean; SD, standard deviation; S, skewness; K, kurtosis; SE, standard error.
Statistical outlier IQR ≥ 3; N = 2.
Authors’ Contributions
T.S. made substantial contributions to the recruitment of participants, performed acquisition of data, provided support in mindfulness treatment, conducted the pre-processing and analysis of the EEG data, conducted the statistical analyses, interpreted the data, and prepared the manuscript. M.F. undertook project management, designed the study, conducted mindfulness treatment, performed acquisition of data, and made substantial contributions in editing of the manuscript. K.S. and S.P. made substantial contributions to data acquisition and recruiting of participants. M.K. provided support in EEG data pre-processing and analysis. B.W.M. provided the EEG, presentation software and emotion processing task as well as equipment and training for the EEG data acquisition and analysis. E.S. gave substantial support in supervision of the study and editing of the manuscript. M.T. made major contributions to the studys’ conception and design, actively participated in the interpretation of data, and revised the manuscript critically for important subject-specific content. All authors contributed to the article and approved the final version of the manuscript.
Availability of Data and Material
All data are available on request from the responsible author.
Declaration of Conflicting Interests
The author(s) declared no potential conflicts of interest with respect to the research, authorship, and/or publication of this article.
Funding
The author(s) disclosed receipt of the following financial support for the research, authorship, and/or publication of this article: This study was supported by the Else-Kroener-Fresenius Foundation and the Wiedenfeld-Stiftung for Cancer Research. The funders had no role in the design and conduct of the study; management, collection, analysis, and interpretation of the data; preparation, review, or approval of the manuscript; and decision to submit the manuscript for publication.