
Abstract
Trial registration: Registered retrospectively, ISRCTN Registry, www.isrctn.com, ISRCTN23276302
Clinical Implications: Cancer treatment centers and physical examination centers should consider providing music therapy and intervention to the appropriate patients as a routine component of a comprehensive clinical care during medical examinations.
Keywords
Key Messages
What is already known on this topic: Cancer patients are more heavily affected and impacted by psychiatric comorbidities than the average population. Music therapy and intervention are safe and non-pharmacological methods for alleviation with physiological effects.
What this study adds: Music therapy and intervention were able to reduce anxiety and endocrine responses of NSCLC patients with fear of cancer recurrence, and also favorably changed the glucose metabolism of 18 F-FDG in fear-related regions of the brain.
How this study might affect research, practice or policy: This study suggests that cancer treatment centers and physical examination centers should consider providing music therapy and intervention to the appropriate patients as a routine component of a comprehensive clinical care during medical examinations.
Background
Accumulating and compelling evidence is showing an association between cancer patients with psychiatric symptoms and the progression of their cancer disease.1-2 This includes higher death rates, higher rates of cancer recurrence and metastases.3-4 However, due to the diverse clinical manifestations of patients with oncological diseases and psychiatric symptoms, this patient population is 1 that is difficult for clinicians to manage.5-6 Cancer patients experience 3-fold higher rates of psychological stress, anxiety, and depression after routine treatments of cancer, which may persist for prolonged periods or even for the duration of an individual’s life. 7 Patients with non-small cell lung cancer (NSCLC) suffer not only cancer-related symptoms and functional impairment, but also psychological distress. 8
Of the reported psychological problems in cancer survivors, fear of cancer recurrence (FCR) is the most prevalent. 9 Without a clear consensus on its definition, FCR has been increasingly conceptualized as “fear or worry that cancer will come back or progress or metastasize.” 10 Mild FCR usually improves over time, while high FCR may have devastating effects on mood, work, relationships, use of health services, and patients’ quality of life. The condition has recently been receiving more attention, as it is estimated that up to 50% of cancer survivors experience moderate to severe FCR, 11 and about 7% suffer severe and highly disabling FCR.
FCR can be measured by the Fear of Cancer Recurrence Inventory (FCRI). 12 Studies have reported that cancer survivors with higher levels of FCR repeated medical examinations for symptoms more frequently than those with lower levels of FCR. 13 Furthermore, the levels of anxiety reported by patients in the waiting room before diagnostic testing were even higher than those of patients undergoing more complicated and risky treatments. For instance, studies 13 have revealed that over 50% of patients reported high anxiety when undergoing a positron emission tomography (PET) with 18 F-fluorodeoxyglucose (FDG) examination, which is even more than patients during operations (approximately 35%). 14 High patient anxiety can affect the well-being, quality of life, and social functioning of the patients and may even cause dysfunction of the neuro-endocrine system. 15 These results underline the necessity to provide effective psychological treatments for anxiety during examinations, especially for cancer patients with high levels of FCR.
Music interventions and music therapy interventions are a safe and non-pharmacological method for alleviating anxiety. 16 There are many mechanisms by which music can alleviate anxiety 17 Some researchers revealed that music has powerful therapeutic effects on the circulatory, respiratory, and endocrine systems. 17 For example, it alters neurochemical and neurohormonal secretions to affect the dynamics of brain activity and autonomic functions. 17 It also improves physiological responses such as heart rate, respiration, blood pressure, and temperature. These indicators are also considered markers of anxiety and fear. 18 Furthermore, music interventions and music therapy interventions, as a nonpharmacological/nonchemical method, have the ability to reduce pain; decrease anxiety, depression, and nausea; and improve sleep quality. 19
In addition, music therapy interventions can promote social competence and expressive skills, improve moral immunity, and provide individualized and effective support in palliative care. 20 Recent studies have demonstrated the effectiveness of music therapy for reducing anxiety during magnetic resonance imaging, bone marrow aspiration, CAT scans for radiation therapy, and physical examinations.21 -25 Despite these findings, few studies have examined the effects of music interventions and music therapy interventions during PET examinations in NSCLC patients with high levels of FCR. 4
Objective
This randomized, controlled trial aimed to examine if music therapy interventions could have positive effects on salivary cortisol levels, sAA levels as well as glucose metabolism during 18 F-FDG PET imaging in NSCLC patients with FCR.
Methods
Selection and Description of Participants
The study included 2 groups of participants: NSCLC patients with high levels of FCR who received music therapy intervention (Group 1, n = 31), NSCLC patients with high levels of FCR but who did not receive music therapy intervention (Group 2, n = 31). Participants were explicitly asked to give consent for their participation in the study without pay and on a voluntary basis. Subjects who did not provide written informed consent were excluded. This study was approved by the Ethics in Research Committee of Huashan Hospital, Fudan University Institutional Review Board (No. 2013 M–010).
Sample Size
According to the fourth edition of “Medical Statistics” (People’s Health Publishing House, editor in chief: Sun Zhenqiu and Xu Yongyong), the sample size estimation formula for comparing the superiority of 2 means was N = (Zα + Zβ)2(1 + 1/K)σ2/δ2, with α = .05, β = .1, and assuming that the sample size of the 2 groups is equal at K = 1, with a dropout rate of about 20%, 31 cases were determined for the music therapy intervention group and 65 cases for the control group.
Patient Recruitment
NSCLC patients between 50 and 60 years of age were enrolled in this study from the PET Center within the Department of Nuclear Medicine at Huashan Hospital, Fudan University. Healthy controls were recruited from health examinations at Huashan Hospital, who did not reveal clinical evidence of NSCLC (Figure 1).

Recruitment of NSCLC patients and healthy controls.
Healthy Controls
All healthy control individuals met the following inclusion criteria: ①currently without psychiatric or organic symptoms; ②no history of mental or physical illness; ③ no administration of drugs 4 weeks prior to screening that could influence SAM systems or the HPA axis. Exclusion criteria included: ①current or a history of psychiatric symptoms; ②any other diseases and conditions that could confound the data (eg, cancer, immune diseases, endocrine diseases, pregnancy).
NSCLC Patients
All patients were explicitly diagnosed with NSCLC. These participants also did not take any drugs 4 weeks prior to screening that could influence SAM systems or the HPA axis (eg, corticosteroids or antidepressants). Those with other diseases or any conditions that might confound the interpretation of data (eg, endocrine diseases, cardiovascular, or neurological diseases) were also excluded.
Severity Subscale of the Fear of Cancer Recurrence Inventory
FCR was evaluated using the FCRI. The FCRI is a multi-dimensional questionnaire composed of 7 subscales: triggers, severity, psychological distress, functional impairments, insight, reassurance, and coping strategies. 26 Higher summary scores indicate greater FCR.
Randomization
After signed consent was provided and FCRI assessments were completed, NSCLC patients with high levels of FCR were randomly allocated to 1 of 2 study arms: NSCLC patients with high levels of FCR who received music therapy intervention (Group 1), and NSCLC patients with high levels of FCR but who did not receive music therapy intervention (Group 2). To control for selectivity bias, each participant was randomly assigned a number using the online program RANDOM.org. All participants were then randomly divided into Group 1 or Group 2 using the online randomization program Research Randomizer.
Music Intervention and Music Therapy Intervention
For semantic and conceptual clarity, we define the term “music intervention” as a patient’s exposure to music without the involvement of a music therapist, and the term “music therapy intervention” as a patient’s exposure to music with the involvement of a music therapist. In the following, when we intend to address both, it will be written as “music (therapy) intervention.” Patients in Group 1 received a music intervention, as well as a music therapy intervention which were both organized and conducted by a trained and experienced music therapist. The patients met for 2 sessions, from Time −30 to Time 0 and from Time +30 to Time +60, for a total of 60 minutes (Figure 1). During the first session, before the PET examination, the subjects were asked to restfully close their eyes and to not talk in the waiting room to avoid interference with the brain’s glucose metabolism. This first session involved a passive music intervention. Music therapists developed suitable music lists for patients based on their age, educational level. For the music intervention, the music therapist selected 6 songs, namely 3 instrumental songs and 3 vocal songs, all of which had slow rhythms and comfortable melodies. If the patient felt that the music was too noisy or made them feel uncomfortable, then the music therapist changed the music until the patient felt comfortable. Although the music therapist selected the music and was available for adjustments during the listening, there was no formal therapeutic involvement, which is why we labeled this part of the intervention as a music intervention.
During the second session, from Time +30 to Time +60, the music therapy intervention was carried out in individual sessions (one-on-one therapy) using a standardized plan of music intervention techniques. The subjects reclined halfway on a bed in a comfortable environment and were encouraged to listen to the music played in the first session for 15 minutes. After that, they discussed their responses such as images or feelings evoked by the music, the mood of the music, or associated memories. During the music therapy intervention sessions, the therapist provided encouraging responses to the subject’s comments.
The procedures are described in more detail in the supplemental material.
Real-Time Monitoring of the Anxiety of NSCLC Patients
The Mandarin Chinese version of a shortened 6-item Dutch version of the State-Trait Anxiety Inventory (STAI) was used to assess patients’ anxiety levels. It includes state anxiety, used to evaluate their feelings of apprehension, tension, nervousness, and worry. 27 Therefore, for this study, the high-anxiety STAI threshold of 40 points for the 20-item STAI was converted to a threshold of 12 points for a 6-item STAI (40/20*6=). STAI measurements were taken 6 times before collecting salivary samples. At the same time, real-time monitored of the subjects’ heart rates was conducted.
Procedures
Patients’ clinical history was obtained, and a physical examination was performed prior to their arrival for the PET scan. Routine laboratory measurements were taken, and an additional physical examination was performed upon their arrival. In addition, all NSCLC patients received a baseline assessment for quality of life (QOL) and Karnofsky Performance Status (KPS) to eliminate the confounding factors of age, cancer stage, types of cancer treatment, quality of life, and performance status. The PET scan took about 40 minutes, and results were obtained 1 hour later.
To control for variations in sAA and cortisol levels, saliva was collected between 13:00 and 16:00 hours. Six saliva samples were collected during the session, immediately after heart-rate and STAI assessments: 30 minutes prior to the PET scan (Time −30; S1), just before the PET scan (Time 0; S2), immediately after the PET scan (Time +30; S3), another 30 minutes after completion of the PET scan at +60 minutes (Time +60; S4), and then at +70 minutes (Time +70; S5), and +80 minutes (Time +80; S6) (Figure 2).

Protocol for music (therapy) intervention and sample collection. Passive music intervention refers to the music intervention. Active music intervention refers to the music therapy intervention.
The individuals in Group 1 received the music (therapy) interventions during the interval times of the PET examination, from Time −30 to Time 0 (music intervention), and from Time +30 to Time +60 (music therapy intervention).
A Salivette (Sarstedt, Rommelsdorf, Germany), which contains a small cotton tube, was used to collect salivary samples. Patients put the tube in their mouths and chewed for about 3 minutes for the Salivette to soak up the saliva. The Salivette was then centrifuged at 5000 rpm and 4°C for 20 minutes. The liquid in the bottom was collected and frozen at −80°C for further evaluation.
Salivary cortisol concentrations were measured using a modified version of a commercially available radioimmunoassay kit (Acthrel, Ferring, Tarrytown, NY). The means of inter- and intra-assay coefficients of variation were 4.6% and 5.8%, respectively. The sAA levels were analyzed using the enzyme kinetic method described previously. Heart rates were measured using an ambulatory sphygmomanometer (A&D Company, Tokyo, Japan). The timing of the various sample collections is depicted in Figure 2.
The Full trial protocol can be accessed by contacting the main author.
Statistical Analyses
To reduce the probability of producing type-I errors, the PET measurements were designated as being primary, and all the other measurements as secondary.
All data are presented as the mean ± standard deviation (SD). Group comparisons of categorical variables were tested using Pearson’s chi-square test or Fisher’s exact test. The one-way analysis of variance (ANOVA) or Kruskal-Wallis test was used to compare different groups of patients. The Bonferroni post hoc test and the Mann-Whitney U test were used for continuous variables of normally and non-normally distributed data, respectively. All statistical analysis was performed using SPSS software version 17.0, and a P value less than .05 was considered statistically significant.
The area under the curve (AUC) and relative variation (VAR) over the testing period were defined by integrating the measurements in System International units with the testing time in hours and the change over the testing period, respectively. To avoid confusion, we would like to point out that our measurement of VAR is not the same as heart rate variability, but istead reflects the range between the highest and the lowest measurements throughout the entire measurement period as a whole. For each participant, 2 time points were chosen: the max and the min. For instance, sAA VAR is equal to (sAA max minus sAA min) divided by sAA max.
Findings
Demographic Features
Demographic features among Groups 1 and 2 were similar; there were no statistically significant differences among the groups with respect to age, sex, body mass index, height, weight, or smoking pack-years. The stages of cancer and the types of NSCLC treatment were not statistically different between the groups (Table 1).
Demographic and Clinical Characteristics of the Study Groups.

Smoking pack-years, the packs of cigarettes smoked per day multiplied by the number of years smoked.
Abbreviations: HAMD, 24-item Hamilton depression rating scale; HADS, hospital anxiety and depression scale; KPS, Karnofsky performance status; QOL, quality of life; FCRI, fear of cancer recurrence inventory; NSCLC, non-small cell lung cancer; SD, standard deviation.
Psychometric Results
The average FCRI scores of Group 1 and Group 2 were 19 (ranging from 14 to 26) and 18 (ranging from 16 to 23), respectively (t = 981.00, P = .96). Prior to the interventions, there were no significant differences between the FCRI scores, Hamilton Depression Rating Scale scores, Hospital Anxiety and Depression Scale scores, KPS scores, or QOL scores of Group 1 and Group 2 (Table 1).
PET Results
(All areas were significant at uncorrected P < .001 and cluster level corrected P < .05).
Group 1 showed higher glucose metabolism of 18 F-FDG in the frontal lobe, superior frontal gyrus (BA 10, BA 11), right anterior cingulate (BA 24), right superior temporal gyrus (BA 38), left temporal lobe, fusiform gyrus (BA 20), and left limbic lobe, parahippocampal gyrus (BA 28) when compared to Group 2 (P < .001) (Figure 3; Table 2).

PET comparisons between Groups 1 and 2. Patients in Group 1 showed lower glucose metabolism of 18 F-FDG in the occipital lobe, left and right middle occipital gyrus (BA 18), left and right frontal lobe, and precentral gyrus (BA 4, BA 6) when compared to those in Group 2.
Brain Regions with Significant Metabolic Changes in Group 1 Compared to Group 2.

Group 1 showed lower glucose metabolism of 18 F-FDG in the occipital lobe, left, and right middle occipital gyrus (BA 18), left and right frontal lobe, and precentral gyrus (BA4, BA 6) when compared to Group 2 (P < .001) (Figure 3; Table 2).
Real-Time Monitoring of Anxiety of NSCLC Patients
There was no significant difference between the STAI scores of Group 1 and Group 2 at Time −30 (t = 0.12, P = .90, Figure 4A). The STAI scores at S2 (Time 0), S3 (Time +30), S4 (Time +60), S5 (Time +70), S6 (Time +80) and the STAI-score AUC were significantly lower in Group 1 than in Group 2 (t = −2.22, P = .03; t = −4.42, P < .001; t = −5.65, P < .001; t = −5.35, P < .001; t = −4.21, P < .001; t = −4.85, P < .001, Figure 4A and B). There was no significant difference between the STAI-score VARs of Group 1 and Group 2 (t = 940.50, P = .65) (Figure 4C).

Real-time monitoring of the anxiety and heart rates of NSCLC patients. (A) Except for at Time −30 (P = .90), there were significant differences in STAI scores between Group 1 and Group 2 (all P < .01, Figure 4A). (B) The STAI-score AUC in Group 1 was significantly lower than in Group 2 (P < .01). (C) There was no significant difference between the STAI-score VARs of Group 1 and Group 2 (P = .65). (D) Compared to Group 2, significant associations were detected at S3 (Time +30), S4 (Time +60), and S5 (Time +70) (all P < .01). (E) and (F) The heart-rate AUC (E) and VAR (F) in Group 1 were significantly lower than in Group 2 (all P < .01). *P < .01. All data are shown as the mean ± standard deviation.
Heart Rate
The heart rates at S3 (Time +30), S4 (Time +60), and S5 (Time +70) in Group 1 were significantly lower than those in Group 2 (t = −4.99, P < .001; t = −2.12, P = .04; t = −3.06, P = .003, Figure 4D). The heart rate AUC and VAR in Group 1 were significantly lower than those in Group 2 (t = −2.58, P = .01; t = 767.50; P = .003, Figure 4E and F).
Salivary Cortisol
Salivary cortisol levels at S2 (Time 0), S3 (Time +30), S4 (Time +60), and S5 (Time +70) and the salivary cortisol AUC in Group 1 were significantly lower than those in Group 2 (t = −2.26, P = .03; t = −4.14, P < .01; t = −2.13, P = .003; t = −3.12, P = .04; t = −3.06, P = .003, Figure 5A and B). The salivary cortisol VAR did not differ between the 2 groups (t = −0.95, P = .35, Figure 5C).
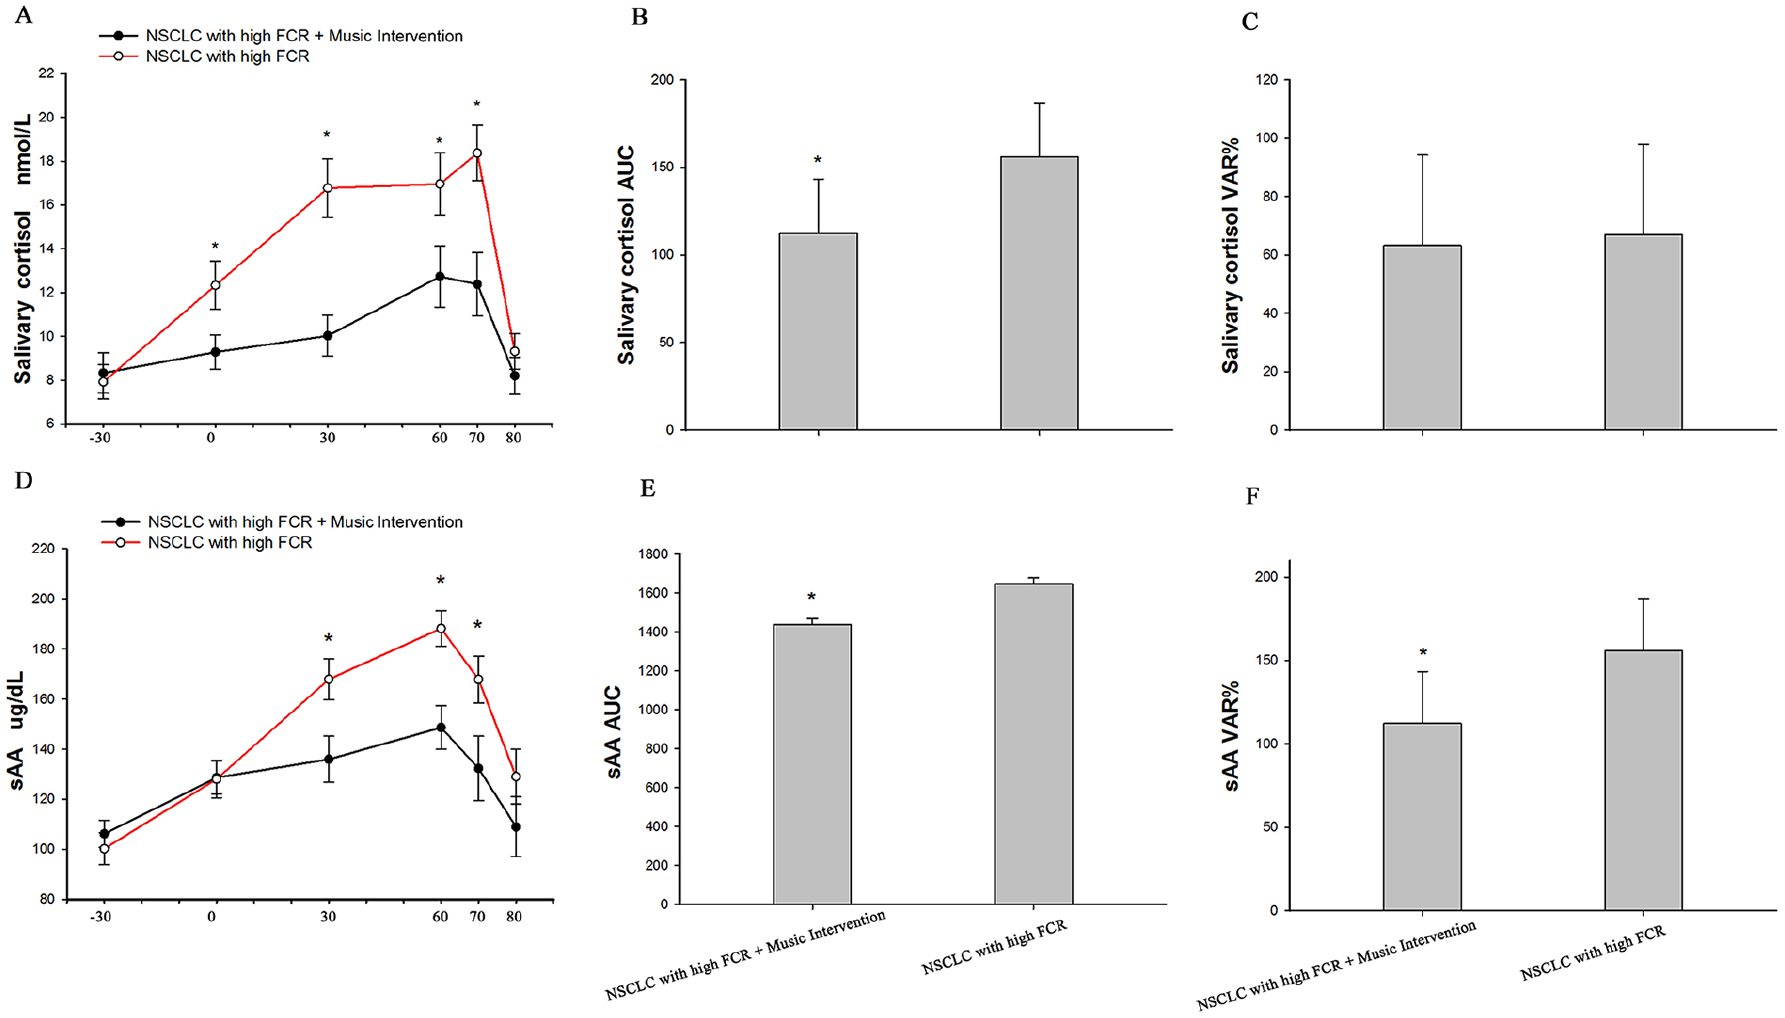
Relative variation of salivary cortisol and sAA levels. (A) and (D) The relative variations (VARs) of salivary cortisol (A) and sAA (D) were assessed. In Group 1, the salivary cortisol area under the curve (AUC) (B), sAA AUC (E), and sAA VAR (F) were significantly higher than those in Group 2 (all P < .05). (C) There was no difference between Group 1 and Group 2 in salivary cortisol VAR (P = .35). *P < .05. All data are shown as the mean ± standard deviation.
SAA
The sAA values at S3 (Time +30), S4 (Time +60), and S5 (Time +70) were significantly lower in Group 1 than in Group 2 (t = −2.60, P = .012, t = −3.526, P < .001, t = −2.233, P = .029, Figure 5A). The sAA AUC and sAA VAR in Group 1 were also significantly lower than those in Group 2 (t = −2.147, P = .036; t = −3.060, P = .003, Figure 5B and C).
Discussion
Patients with fear of cancer recurrence (FCR) often experience distress, depression, anxiety, and frequent body checking, 28 resulting in a heavy psychological burden. This makes its early identification and management a matter of priority. The results of the present study demonstrate that music (therapy) interventions can greatly benefit non-small cell lung carcinoma (NSCLC) patients with high levels of FCR, particularly when they experience anxiety during medical examinations. To our knowledge, this is the first study that monitored the anxiety of NSCLC patients during positron emission tomography (PET) procedures in real-time, and by measuring heart rate, salivary cortisol, salivary alpha-amylase (sAA) levels, and glucose metabolism. In addition, this is the first study that assessed whether beneficial changes in the above mentioned could be brought about by music (therapy) interventions.
The music therapy program of this study was developed based on the experience of over 5 years of clinical practice with patients suffering from malignant tumors. During this time, different methods and protocols were implemented in the therapeutic setting. After repeated improvement and optimization, the particular music therapy protocol emerged that was used in this study, based on what was effective in the clinical setting. In our medical practice, music therapy has shown to be more advantageous in many ways than other non-pharmacological interventions. It is very safe and non-invasive, as opposed to surgical interventions for example. 16 It doesn’t require physical strain as opposed to exercise, which is often problematic for patients with more advanced illness to engage in. It is very unlikely to lead to unintended negative effects, 29 as opposed to procedures such as radiation therapy. In light of the very favorable features, such as those just mentioned, it appeared to be a valuable and important endeavor to investigate music therapy further. Our hope was and is to contribute to the field of music therapy, so that it can be better understood and improved upon, as well as accepted by mainstream medicine and implemented more effectively by it. Finding physiological correlates for psychological events is 1 important way to attempt to resolve the mind-body-problem created by the enlightenment period, by showing how different emergent levels of the organism are interconnected. 30 As rather general parameters reflecting stress and its reduction, we hypothesized that cortisol, sAA, and heart rate would be reduced as a result of the music therapy.31,32 Previous studies have shown that music therapy can reduce anxiety, fear, pain, depression, and improve sleep quality.16,17,19 Therefore, regarding the brain imaging, we hypothesized that our music therapy protocol would lead to changes in brain areas related to fear and anxiety. PET scans were chosen to test that hypothesis because there was a relative paucity of this particular modality in the literature, with Lee et al.’s study being the only 1 we were able to find. 33 Furthermore, necessary equipment, as well as personnel with good expertise and skill were available to us.
After the examination, there was sufficient time for the patients to participate in a full music therapy intervention which was conducted at that particular time in order to help the patients recover from the negative psychological and physiological effects of the examination. In the period of time in which the patients were waiting for their examination to begin, it would not have been practical to conduct a full music therapy intervention. However, because it has been reported that patients also suffer from anxiety before their examinations, 13 it seemed important to provide support and relief in this time period. Therefore, although it would be plausible that the music intervention would be less effective than the music therapy intervention, both in terms of degree and of duration, it was still implemented because of its more convenient and more flexible applicability. We chose to do both interventions because the protocol aims for the greatest benefit of the patient. However, it would be interesting for future studies to replicate this protocol with only either the music intervention or the music therapy intervention, which would yield data enabling a comparison between the two. We could learn if there are differences in quantitative effectiveness. We might also learn if there are qualitative differences in the sense that 1 may address certain problems more effectively than the other, and vice versa, which would make them complementary. It may also be possible that 1 of the 2 has only negligible effects overall and could therefore be omitted.
In the present study, the area under the curve (AUC) over the time course of the PET scan was used to measure the total amounts of the variables, while the relative variation (VAR) was used to measure the ranges of change in the variables between the highest and the lowest measures throughout the duration of the entire measurement period as a whole. We found that the State-Trait Anxiety Inventory (STAI) scores, heart rates, cortisol levels and sAA levels increased in patients during PET procedures and reached their highest levels before the PET results were reported to the patients. These results were expected, since they reflect the stress that would be assumed to result from the patient’s fear of receiving negative results. The general trend of these measurements was observable whether they received a music (therapy) intervention or not, suggesting that the music (therapy) intervention reduced the intensity, but not the fundamental character of the measurements. The results further demonstrate that the patients experienced short-term but high-intensity psychological stress during the PET procedures. This was also what we would have expected, and further confirms the necessity for interventions. When patients were alone in the waiting room, their anxiety related to FCR increased continuously and peaked shortly before the PET results were reported to them. This is assumed to be due to fear of negative results, indicating that this is a particular important time for fear reduction.
The music (therapy) intervention group showed lower STAI-scores, AUC levels, heart rates, cortisol levels, and sAA levels than the non-intervention group, reflecting reductions in subjective fear, as well as physiological stress. Furthermore, our results showed a decrease in the VAR of heart rates and sAA levels when compared to the non-intervention group, further showing reduced differences between minimum and maximum measurements of physiological stress. These phenomena demonstrate that music (therapy) interventions can reduce anxiety related to FCR during medical examinations. Pharmacological agents may be effective in reducing anxiety, but they have many drawbacks, including ethical objections, undesirable interactions with other drugs, as well as their own side effects. 34 On the other hand, various non-pharmacologic techniques to lower anxiety have been reported in the literature, including physical exercises 35 ; massage therapy, 32 progressive muscle relaxation, 36 and breathing exercises. 36 Most of these, however, seem comparatively difficult to integrate into the workflow of medical examinations,37,38 be it due to the necessity of time to master. The decrease of anxiety-related biomarkers in the present study suggest that music (therapy) interventions can maintain the functions of the sympatho-adreno-medullary (SAM) and hypothalamus-pituitary-adrenal (HPA) axis systems and protect the neuro-endocrine system from psychological stress.
We also found that the peak values of sAA levels, heart rate, and STAI scores occurred earlier than the peak value of salivary cortisol. This finding is in line with previous reports that salivary cortisol displays a prolonged responsiveness after stress tasks. 39
In addition, the present study demonstrated that the music (therapy) intervention group showed higher glucose metabolism of 18 F-FDG in several brain regions. However, it is important to note that the changes in the PET scans can only have resulted from the music intervention, since the music therapy intervention only took place after the scans. Higher glucose metabolism in brain regions is thought to correlate with increases in those brain region’s activity. Because of the brain’s incredible complexity, drawing specific conclusions about general human behavior and wellbeing based on the imaging of lists of individual brain regions is limited. In the following, we will provide some context for our findings from the literature. Beyond that, what is truly necessary are future integrative projects that gather the extensive findings in the literature on brain functioning (such as those of this study), so that conclusions can be drawn that are truer to the dynamic and context dependent interconnectedness of how the brain actually seems to work. We deeply wish that more such endeavors will be undertaken in the future, despite the common tendency of innovation over integration, and it is mainly such projects that we hope our brain imaging data can be useful for.
The key message regarding this study is that music (therapy) interventions can lead to measurable differences in the brain’s functioning, in ways that connect to and affect many other parts of the body’s functioning. It provides further credence to those who believe that medicine must be more than just the fixing of biological machines; that the body and the mind can be artificially separated for practical reasons, but are actually different levels of complexity, belonging to 1 and the same organism and must, therefore, ultimately be treated as an interconnected unit. 40
The superior frontal gyrus is frequently involved in the impaired fear learning observed in anxiety disorders. It integrates cognitive and affective processes, depending on the dynamics of a larger circuit, including the prefrontal attentional network, 41 the hippocampus/parahippocampal gyrus, 42 the thalamus for fear learning, and the amygdala for regulating the fear response. 42
Several recent findings have shown that the anterior cingulate modulates the amygdala response. Consistent with these findings, a functional MRI study revealed that patients with generalized anxiety disorder appeared to have reduced functioning of the anterior cingulate. 43 Furthermore, another functional MRI study reported that pretreatment of anterior cingulate cortex activity was closely related to the response to the antidepressant venlafaxine. 43 It is also interesting to note that the superior temporal gyrus exerts abundant projections to the frontal lobes, particularly the medial prefrontal cortex, which is related to emotional states. 41
There are extensive efferent and afferent connections between the parahippocampal region and the hippocampus, which play seminal roles in memory encoding, formation, and conditioning. Recent neuropsychological studies have shown that the parahippocampal gyrus and amygdala-entorhinal pathway correlate with high anxiety, mood disorders, and anxiety-related behaviors. 41
In addition, the anterior cingulate cortex, parahippocampal gyrus, and amygdala have been found to be fear-related areas of the limbic system, which is relevant to this study, because the SAM and HPA axes are regulated by the limbic system. 42 Previous investigations have reported alterations in stress-related brain regions during music intervention. 44 We also observed increased activity of these fear-related regions in the intervention group when compared to the non-intervention group. These results extend previous work by documenting that music (therapy) intervention for NSCLC patients with high levels of FCR is associated with specific neural correlates, most likely altered functioning of fear-related regions.
The present study has some limitations. First, all subjects were recruited from 1 tertiary center. The study data was based on a well-defined, but small number of NSCLC patients with high levels of FCR. Further investigations are needed with a larger sample size from multiple centers and more geographic representations. Second, each participant performed the 18 F-FDG PET imaging only once during the study. Third, the design of the present study was randomized and controlled, but not double-blinded.
Conclusions
The present study showed that NSCLC patients with high levels of FCR may experience short-term, high-intensity psychological stresses during medical examinations. Music (therapy) interventions reduced the anxiety and endocrine responses of these patients. It also increased the glucose metabolism of 18 F-FDG in fear-related regions of the brain.
Clinical Implications
Music (therapy) interventions decreased anxiety related to FCR and thereby improved the QOL for NSCLC patients. Cancer treatment centers and physical examination centers should therefore consider providing music (therapy) interventions to the appropriate patients as a routine component of a comprehensive clinical care during medical examinations.
Supplemental Material
sj-docx-1-ict-10.1177_15347354241269898 – Supplemental material for Music Therapy and Music Intervention for NSCLC Patients Undergoing PET with Fear of Cancer Recurrence
Supplemental material, sj-docx-1-ict-10.1177_15347354241269898 for Music Therapy and Music Intervention for NSCLC Patients Undergoing PET with Fear of Cancer Recurrence by Yi-jie Du, Yi-hui Guan, Kevin T. Thome and Jing-cheng Dong in Integrative Cancer Therapies
Footnotes
Abbreviations
non-small cell lung cancer (NSCLC), fear of cancer recurrence (FCR), Fear of Cancer Recurrence Inventory (FCRI), positron emission tomography (PET), 18 F-fluorodeoxyglucose ( 18 F-FDG), hypothalamic pituitary adrenal (HPA), sympathetic adrenomedullary (SAM), salivary α-amylase (sAA), State-Trait Anxiety Inventory (STAI), quality of life (QOL), Karnofsky Performance Status (KPS), standard deviation (SD), analysis of variance (ANOVA), area under the curve (AUC), relative variation (VAR)
Author Contributions
Yi-jie Du and Jing-cheng Dong conceived and designed the study. Yi-jie Du and Yulong Jiang designed and implemented the music therapy, evaluated psychiatric conditions and collected medical history information. Yi-hui Guan analyzed the PET data and images. Yi-jie Du wrote the manuscript. Kevin T. Thome revised, edited and submitted the manuscript. Jing-cheng Dong and Yulong Jiang revised the manuscript and supervised the project. Yi-jie Du and Yulong Jiang contributed equally to the article.
Declaration of Conflicting Interests
The author(s) declared no potential conflicts of interest with respect to the research, authorship, and/or publication of this article.
Funding
The author(s) disclosed receipt of the following financial support for the research, authorship, and/or publication of this article: This work was supported by National Key R&D Program 2021YFC2501405, Development Project of Shanghai Peak Disciplines—Integrative Medicine and Western Medicine (No. 20150407) and National Natural Science Program of China (No.81673916 and 81403148).
Supplemental Material
Supplemental material for this article is available online.
References
Supplementary Material
Please find the following supplemental material available below.
For Open Access articles published under a Creative Commons License, all supplemental material carries the same license as the article it is associated with.
For non-Open Access articles published, all supplemental material carries a non-exclusive license, and permission requests for re-use of supplemental material or any part of supplemental material shall be sent directly to the copyright owner as specified in the copyright notice associated with the article.