
Abstract
Background:
Gastric cancer (GC) is a prevalent malignant tumor of the digestive tract. Chemotherapy (CT) is the primary treatment for GC, but it is accompanied by toxic side effects. Several systematic reviews and meta-analyses (SRs/MAs) on the combination of Shenqi Fuzheng injection (SFI) with CT for GC have been published; however, the conclusions have been inconsistent. This overview of SRs/MAs aims to assess the effectiveness and safety of SFI for GC, establishing a dependable foundation for its clinical application.
Methods:
We utilized 7 databases, namely PubMed, Embase, Cochrane Library, CNKI, Wanfang, VIP, and SinoMed, to conduct our search. The retrieval period spanned from inception to August 2023. The methodological quality, bias risk, reporting quality, and evidence quality of the SRs/MAs were assessed using the evaluation tools AMSTAR-2, ROBIS, PRISMA 2020, and GRADE, respectively. Subsequently, the randomized controlled trials (RCTs) included in the SRs/MAs were quantitatively analyzed through the implementation of RevMan 5.4 software.
Results:
Eleven SRs/MAs were included in this study, comprising 54 RCTs involving a total of 9539 patients with GC. The studies covered the period from 2012 to 2021, with the number of original RCTs per study ranging from 3 to 20 and sample sizes ranging from 159 to 1413. The methodological quality of all 11 SRs/MAs was assessed as low or very low, and the quality of evidence was determined to range from moderate to very low. The comprehensive quantitative meta-analysis revealed that the combination of SFI with CT improved the objective response rate (ORR) (RR = 1.30, 95% CI = [1.21, 1.41], P < .00001) and disease control rate (DCR) (RR = 1.13, 95% CI = [1.09, 1.18], P < .00001) in GC patients, without heterogeneity observed among the studies. In comparison with CT alone, SFI combined with CT also demonstrated improvements in the Karnofsky performance status (KPS) (RR = 1.36, 95% CI = [1.25, 1.49], P < .00001) and CD4+/CD8+ level (RR = 1.16, 95% CI = [0.87, 1.46], P < .00001) of patients. In terms of adverse reactions, the combination therapy of SFI with CT was associated with a reduced incidence of gastrointestinal reactions (RR = 0.67, 95% CI = [0.58, 0.78], P < .00001) and neurotoxicity (RR = 0.64, 95% CI = [0.50, 0.81], P = .0002).
Conclusions:
SFI combined with CT can enhance the clinical effectiveness and enhance the quality of life in patients with GC, while minimizing adverse reactions. Nonetheless, the evaluation of overall quality remains deficient, thus restricting the reliability and stability of the conclusions. High-quality, large-sample RCTs remain crucial for establishing dependable clinical evidence.
Systematic review registration:
INPLASY20239004
Keywords
Introduction
Gastric cancer (GC) is one of the most common malignancies of the digestive system. Global cancer statistics indicate that GC ranks fifth in terms of incidence and fourth in terms of mortality among malignant tumors. In China, GC is a major concern, with 480 000 new cases and 370 000 deaths, accounting for 44.04% and 48.05% respectively. 1 Moreover, 80% of GC patients in China are diagnosed at an advanced stage, resulting in poor treatment outcomes and an overall 5-year survival rate of less than 50%. 2 Although immunotherapy and targeted therapy are advancing rapidly, chemotherapy (CT) remains the primary treatment option for GC. However, CT is associated with side effects such as gastrointestinal reactions, neurotoxicity, and bone marrow suppression, which are intolerable to patients and limit its use, thus severely impacting the physical and mental health of patients. Consequently, there is an urgent need to find a safe and effective adjuvant treatment in clinical practice. 3
Shengqi Fuzheng injection (SFI), a traditional Chinese medicine (TCM) injection preparation derived from Codonopsis pilosula and Astragalus membranaceus using modern technology, is widely used as an adjuvant treatment for GC, breast cancer, lung cancer, liver cancer, and others. 4 Modern research has shown that SFI exerts anti-tumor effects by inhibiting tumor cell proliferation, promoting cell apoptosis, reducing tumor cell invasion and metastasis, improving the tumor microenvironment, enhancing body immunity, and strengthening the anti-tumor effect in GC patients.5,6 Some systematic reviews and meta-analyses (SRs/MAs) have confirmed that combining SFI with CT can improve clinical efficacy, enhance the quality of life, boost immune function, and reduce adverse reactions in cancer patients.7 -9 However, due to various factors such as publication year, intervention measures, research design limitations, inconsistent reporting, publication bias, and varying quality of evidence, these SRs/MAs cannot conclusively determine the clinical evidence level. Therefore, the clinical guidance role of these reviews needs further verification.
The purpose of this study is to comprehensively evaluate the methodological quality, risk of bias, reporting quality, and evidence quality of SRs/MAs on SFI treatment for GC. Our aim is to integrate the evidence and provide a basis for future treatment decisions. This comprehensive overview will collect SRs/MAs related to the same health problem, ensuring more reliable, higher-level evidence for users. It will greatly contribute to evidence-based decision-making and clinical guidance. 10
Materials and Methods
The protocol for this overview had been registered on the International Platform of Registered Systematic Review and Meta-analysis Protocols (INPLASY) under the registration number INPLASY202390041 (https://inplasy.com/inplasy-2023-9-0041/).
Inclusion Criteria
The inclusion criteria were as follows: (1) Study type: We selected SRs/MAs based on randomized controlled trials (RCTs) as they are considered the gold standard for evaluating clinical evidence. (2) Subjects: Patients with confirmed GC through histopathology or cytology, regardless of gender, age, course of disease, and other factors. (3) Intervention measures: The test group received treatment with SFI combined with CT, while the control group received CT alone, with no restrictions on the CT regimen. (4) Outcome indicators: The outcome indicators included the objective response rate (ORR), disease control rate (DCR), Karnofsky Performance Status (KPS), CD4+/CD8+ levels, gastrointestinal reactions, neurotoxicity, and others.
According to the World Health Organization’s Response Evaluation Criteria in Solid Tumors (RECIST) efficacy criteria, 11 clinical efficacy can be categorized into complete remission (CR), partial remission (PR), stable disease (SD), and progressive disease (PD). The ORR is calculated as the sum of the proportion of CR and PR, that is, ORR = CR + PR. The DCR is the number of cases achieving remission (PR + CR) and stable disease (SD) after treatment, that is, DCR = CR + PR + SD. The KPS score is graded as follows: an improvement of ≥10 points after treatment indicates an increase, a decrease of ≥10 points indicates a decrease, and an improvement or decrease of <10 points indicates stability. The total improvement rate of the KPS score includes both improvement and stability. 12
Exclusion Criteria
The exclusion criteria for this study were as follows: (1) SRs/MAs involving non-RCTs (eg, network meta-analysis and conference papers). (2) Interventions involving Chinese herb decoctions and other TCM therapies. (3) Duplicated publications. (4) Literature lacking full-text data availability.
Literature Retrieval
In our research, we utilized 2 independent reviewers, Jing Xu and Xiao Li, to conduct a comprehensive search across various databases including PubMed, Embase, Cochrane Library, CNKI, Wanfang, VIP, and SinoMed. To ensure a thorough retrieval, our strategy employed a combination of subject words and MeSH terms. The search terms employed were as follows: “gastric cancer,” “gastric carcinoma,” “stomach cancer,” “Shenqi Fuzheng,” “Shengqifuzheng Injection,” “chemotherapy,” “meta-analysis,” “systematic review,” and “systematic evaluation.” Initially, we performed the first retrieval from the commencement of our study until October 2022. However, during the manuscript submission process, we updated our retrieval period to August 2023, and no new relevant research was identified or published during this period. Additionally, we conducted a secondary search of all references cited in the included literature. To provide clarity, we used the PubMed database as an example to illustrate the specific retrieval strategy (Figure 1). For the retrieval strategies employed in other databases, please refer to the Supplemental Material 1.

PubMed retrieval process.
Literature Screening and Data Extraction
We utilized EndNote X9 to retrieve and remove duplicate literature and subsequently reviewed the remaining sources. The literature was screened, extracted, and cross-checked by 2 researchers (Jing Xu and Xiao Li) based on the predetermined inclusion and exclusion criteria. In cases of uncertainty, discussions were held or a third researcher (Li Hou) provided adjudication. If necessary, contact was made with the authors to acquire complete original data.
Data extraction was conducted independently by 2 researchers (Jing Xu and Xiao Li). The extracted data encompassed the first author, year of publication, number of included studies, sample size, intervention measures, bias risk evaluation tools, outcome indicators, and funding sources.
Calculating Overlap
If the original literature of various SRs/MAs overlaps excessively, it could lead to an exaggerated clinical efficacy of drugs and resulting in similar conclusions. To evaluate the extent of overlap in the original literature, an overlap matrix is established for SRs/MAs and the included studies. The degree of overlap is assessed using the “corrected covered area” (CCA), which is calculated using the formula CCA = (n-r)/(rc-r). Here, n refers to the total number of original studies, r denotes the number of original studies after removing duplicate literature, and c represents the number of SRs/MAs included in the study. 13 The CCA value falls within different ranges: “0~5%” suggests a slight overlap, “6%~10%” indicates a moderate overlap, “11%~15%” signifies a high overlap, and “≥15%” represents an extremely high overlap.
Quality Evaluation
The quality evaluation process was independently evaluated by 2 researchers, Jing Xu and Qing Dong. Any doubts or uncertainties were discussed or resolved by a third researcher, Li Hou.
Evaluation of methodological quality
AMSTAR-2 is used to analyze the methodological quality of the included SRs/MAs. 14 AMSTAR-2 contains a total of 16 items, of which items 2, 4, 7, 9, 11, 13, and 15 are critical, and others are non-critical. According to the match between the content and item, when the relevant content matches an item, it is considered as “yes,” when it does not match entirely, it is considered as “partial yes,” and when it does not match, it is considered as “no.” There are 4 quality grades for SRs/MAs as follows:
I. When none or only one non-critical item is not qualified, it is rated as “high” quality.
II. If more than one non-critical item is not qualified, it is rated as “moderate” quality. When more than one non-critical item does not conform, the confidence of the SAs/MAs may be reduced from moderate to low.
III. If one critical item is not qualified, it is rated as “low” quality regardless of whether the non-critical item is qualified.
IV. If more than one critical item is not qualified, it is rated as “critically low” quality.
Bias risk assessment
The Risk of Bias in Systematic Reviews (ROBIS) tool is utilized to assess the bias risk present in SRs/MAs. 15 This tool comprises 3 phases, which are outlined as follows: Phase 1 evaluates correlation, Phase 2 determines the bias risk level in the process of SRs/MAs formulation. It includes 4 domains: “inclusion criteria,” “retrieval and screening,” “data extraction and quality evaluation,” and “data synthesis and results presentation.” Lastly, Phase 3 is employed to assess the bias risk in SRs/MAs, resulting in judgments of “low,” “high,” or “uncertain.” Phases 2 and 3 serve primarily to identify distinct biases.
Evaluation of reporting quality
The Preferred Reporting Items for Systematic Reviews and Meta-analyses (PRISMA) 2020 is used to evaluate the reporting quality of SRs/MAs. 16 It is divided into 7 parts: title, abstract, introduction, methods, results, discussion, and other, which includes 27 items (42 sub-items). The evaluation of each item is based on the completion status of the SRs/MAs, with options including “yes,” “no,” or “partially yes.”
Evaluation of evidence quality
The Grades of Recommendation, Assessment, Development, and Evaluation (GRADE) is employed to assess the quality of evidence regarding outcome indicators in SRs/MAs that are included. Factors contributing to downgrading the evidence include study design, inconsistency, indirectness, imprecision, and publication bias. 17 After evaluating the evidence, it is categorized into 4 levels: “high,” “moderate,” “low,” and “extremely low.”
Drawing a radar map
In this overview, a radar map is created to comprehensively assess SRs/MAs from 6 dimensions: publication year, study type, homogeneity, publication bias, AMSTAR-2, and PRISMA. Among these, publication year, study type, homogeneity, and publication bias are used for qualitative evaluation, while AMSTAR-2 and PRISMA are employed for quantitative evaluation. The process includes multivariate evaluation and rank conversion. 18 Considering the timeliness of SRs/MAs, a higher rank is assigned to more recent publication years. The inclusion of RCT elevates the rank in terms of study type. High homogeneity is determined using the criteria of Q test P ≥ .01 and heterogeneity test I2 ≤ 50%. Literature with publication bias tests is assigned a high rank, whereas those without such tests are given a low rank. Each item in AMSTAR-2 and PRISMA is rated as “yes,” “partially yes,” or “no,” with corresponding scores of 2, 1, and 0, respectively. The total score for AMSTAR-2 is 32 points, while the PRISMA scale has a total score of 54 points. Consequently, the ranks for each SRs/MAs in different categories are obtained. A higher rank indicates a more favorable evaluation result for the respective item. Radar charts are used to offer visual assessments of the quality of each SRs/MAs.
Efficacy Evaluation
RevMan 5.4 is employed for quantitative analysis of RCTs, including SRs/MAs, to provide a clearer understanding of the effectiveness and safety of SFI for GC. Relative risk (RR) is utilized for binary classification outcome measures, while standardized mean difference (SMD) is employed for continuous outcome indicators. Heterogeneity assessment is determined using I2. If the P > .1 and I2 ≤ 50%, the fixed-effect model is applied; otherwise, the random-effect model is adopted. In cases of significant heterogeneity, subgroups or sensitivity analysis may be conducted to lessen heterogeneity, and funnel plots can be utilized to assess publication bias in the included studies.
Results
Literature Screening Results
A total of 56 articles related to the study were initially retrieved. After removing duplicates, 22 articles remained. Upon further review of the title, abstract, and full text, a total of 12 articles were considered relevant. Finally, after exclusion of one article that did not meet the inclusion criteria, 11 SRs/MAs were included in the analysis,19 -29 as depicted in Figure 2.

Literature retrieval process.
Characteristics of the Included Literature
Among the 11 SRs/MAs included in this study, 9 were written in Chinese and 2 were written in English. The study period encompassed the years 2012 to 2021. The original RCTs included in the SRs/MAs ranged from 3 to 20, with sample sizes varying from 159 to 1413. To evaluate the risk of bias in the RCTs, 4 SRs/MAs utilized the Cochrane Handbook assessment tool, 6 SRs/MAs employed the Jadad scale, and 1 SR/MA mentioned the Jadad score without conducting a thorough study quality evaluation. Regarding funding details, 3 SRs/MAs reported receiving support from scientific research projects, while the remaining research reports did not provide any information regarding project support or funding (Table 1).
Characteristics of the included SRs/Mas.

Abbreviations: T, test group; C, control group; ①ORR; ②KPS; ③CD4+/CD8+; ④gastrointestinal reaction; ⑤neurotoxicity.
Overlap of Original Literature
A total of 11 SRs/MAs were included in this study, comprising 125 original literature sources. After removing duplicates, 58 sources remained. Consequently, CCA was calculated as (125−58)/(58 ×11−58) ×100% = 12%, indicating a high overlap. Figure 3 illustrated the “cloud-like” relationship between SRs/MAs and the RCTs, with 69 nodes and 125 edges representing the original study and inclusion frequency, respectively.

“Cloud-like” relationship between SRs/MAs and original RCTs.
Quality Evaluation
Assessment of methodological quality
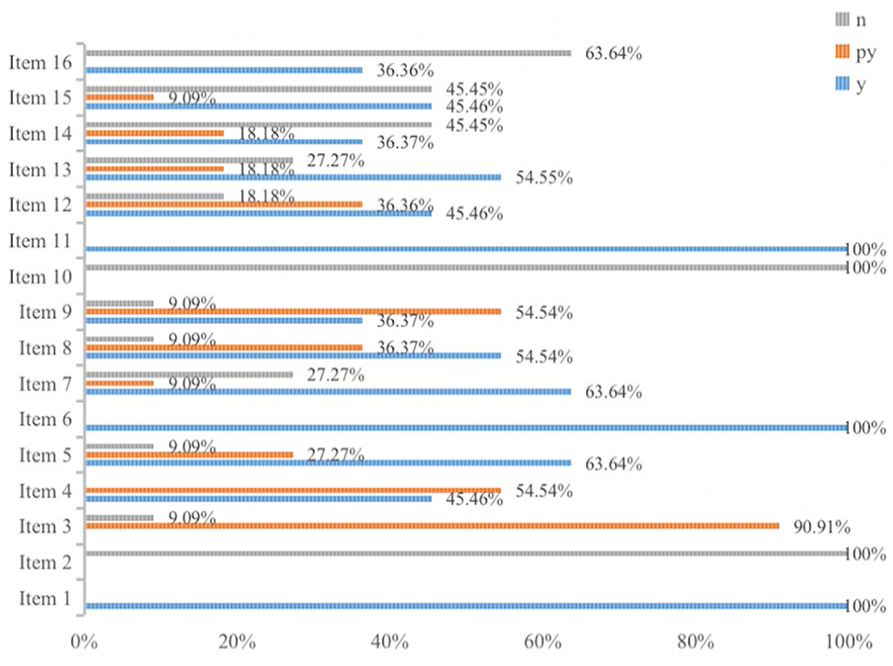
The methodological quality of the included SRs/MAs was assessed using the AMSTAR-2. Our findings revealed that 11 SRs/MAs had one or more critical weaknesses. Among these, 6 SRs/MAs19,23,25,27 -29 were classified as very low quality, while 5 SRs/MAs20 -22,24,26 were considered low quality. Additionally, 11 SRs/MAs adhered to the PICO principle and provided comprehensive descriptions of the objective, intervention measures, outcome indicators, design types, and adopted appropriate statistical methods. However, most of the included SRs/MAs exhibited certain limitations. Notably, none of the studies preregistered their protocols before conducting the SRs/MAs (Item 2), and none reported the funding sources for each included study (Item 10). Furthermore, 63.64% of the studies failed to disclose any potential sources of conflict of interest. Figure 4 displayed the AMSTAR-2 evaluation items of the SRs/MAs, while the detailed results could be found in Supplemental Material 2 (Table 1).
Methodological quality assessment of SRs/MAs by AMSTAR-2. .
Bias risk assessment of included SRs/Mas
All studies were deemed to have a low risk in Phase 1 and Domain 1 of Phase 2. However, in Domain 2 of Phase 2, 7 out of the 11 included studies (63.64%) had a high risk of bias. This was due to either an incomplete retrieval database or the absence of a screening process. In Domain 3, one study 28 was rated as having a high bias risk due to the lack of double reviewers involved in the data extraction process. In Domain 4, 5 out of the 11 studies (45.45%) were found to have a high risk of bias as they did not address heterogeneity or conduct sensitivity analysis. Moving to Phase 3, 6 out of the 11 studies (54.55%) were found to have a high bias risk as they failed to analyze or address bias in SRs/MAs. The detailed results could be seen in Table 2.
ROBIS Bias Risk Assessment of SRs/Mas.

Report quality evaluation of included SRs/Mas
According to the 2020 PRISMA statement, the report quality of 11 SRs/MAs was assessed. Among the 27 items evaluated, all studies included the title, theoretical basis, objective, information source, inclusion and exclusion criteria, outcome indicators, bias assessment, combined effect indicators, results synthesis, screening process, limitations, and conclusions. However, there were notable deficiencies in the report concerning certainty assessment (item 15), certainty of evidence (Item 22), scheme registration and registration information (Item 24), sources of funds (Item 25), conflicts of interest (Item 26), and information disclosure (Item 27). Figure 5 displayed the PRISMA 2020 items of SRs/MAs, while the detailed results could be found in Supplemental Material 2 (Table 2).

Report quality evaluation of SRs/MAs by PRISMA 2020.
Evidence quality evaluation of included SRs/Mas
Eleven SRs/MAs were included in this study, involving a total of 47 outcome indicators. One primary outcome indicator, namely ORR, and 4 secondary outcome indicators, which were KPS, immune function (CD3+ cells, CD4+ cells, CD8+ cells, CD4+/CD8+ cells, NK cells), gastrointestinal reaction, and neurotoxicity, were extracted. The evaluation results of evidence quality showed that 8 out of 47 indicators (17.02%) were rated as moderate quality, 17 (36.17%) were rated as low quality, and 22 (46.81%) were rated as extremely low quality. There was no clinical evidence of high quality available. The main reason for the low evidence quality was the study design of RCTs, which accounted for all 47 indicators (100%). Publication bias (65.96%) and inaccuracy (25.53%) were also contributing factors to the lower evidence quality. Specifically, out of the 11 SRs/MAs, ORR was reported in 9 SRs/MAs, with 3 rated as intermediate evidence, 4 rated as low evidence, and 2 rated as extremely low evidence. KPS was reported in 8 SRs/MAs, with 3 rated as intermediate evidence, 3 rated as low evidence, and 2 rated as extremely low evidence. CD4+/CD8+ level was reported in 5 SRs/MAs, including 1 with intermediate evidence, 1 with low evidence, and 3 with extremely low evidence. Gastrointestinal reactions were reported in 7 SRs/MAs, with 1 intermediate evidence, 5 low evidence, and 1 extremely low evidence. Neurotoxicity was reported in 4 SRs/MAs, with 2 rated as low evidence and 2 rated as extremely low evidence. More details could be found in Table 3.
Evidence Quality Evaluation Included in SRs/MAs by GRADE.
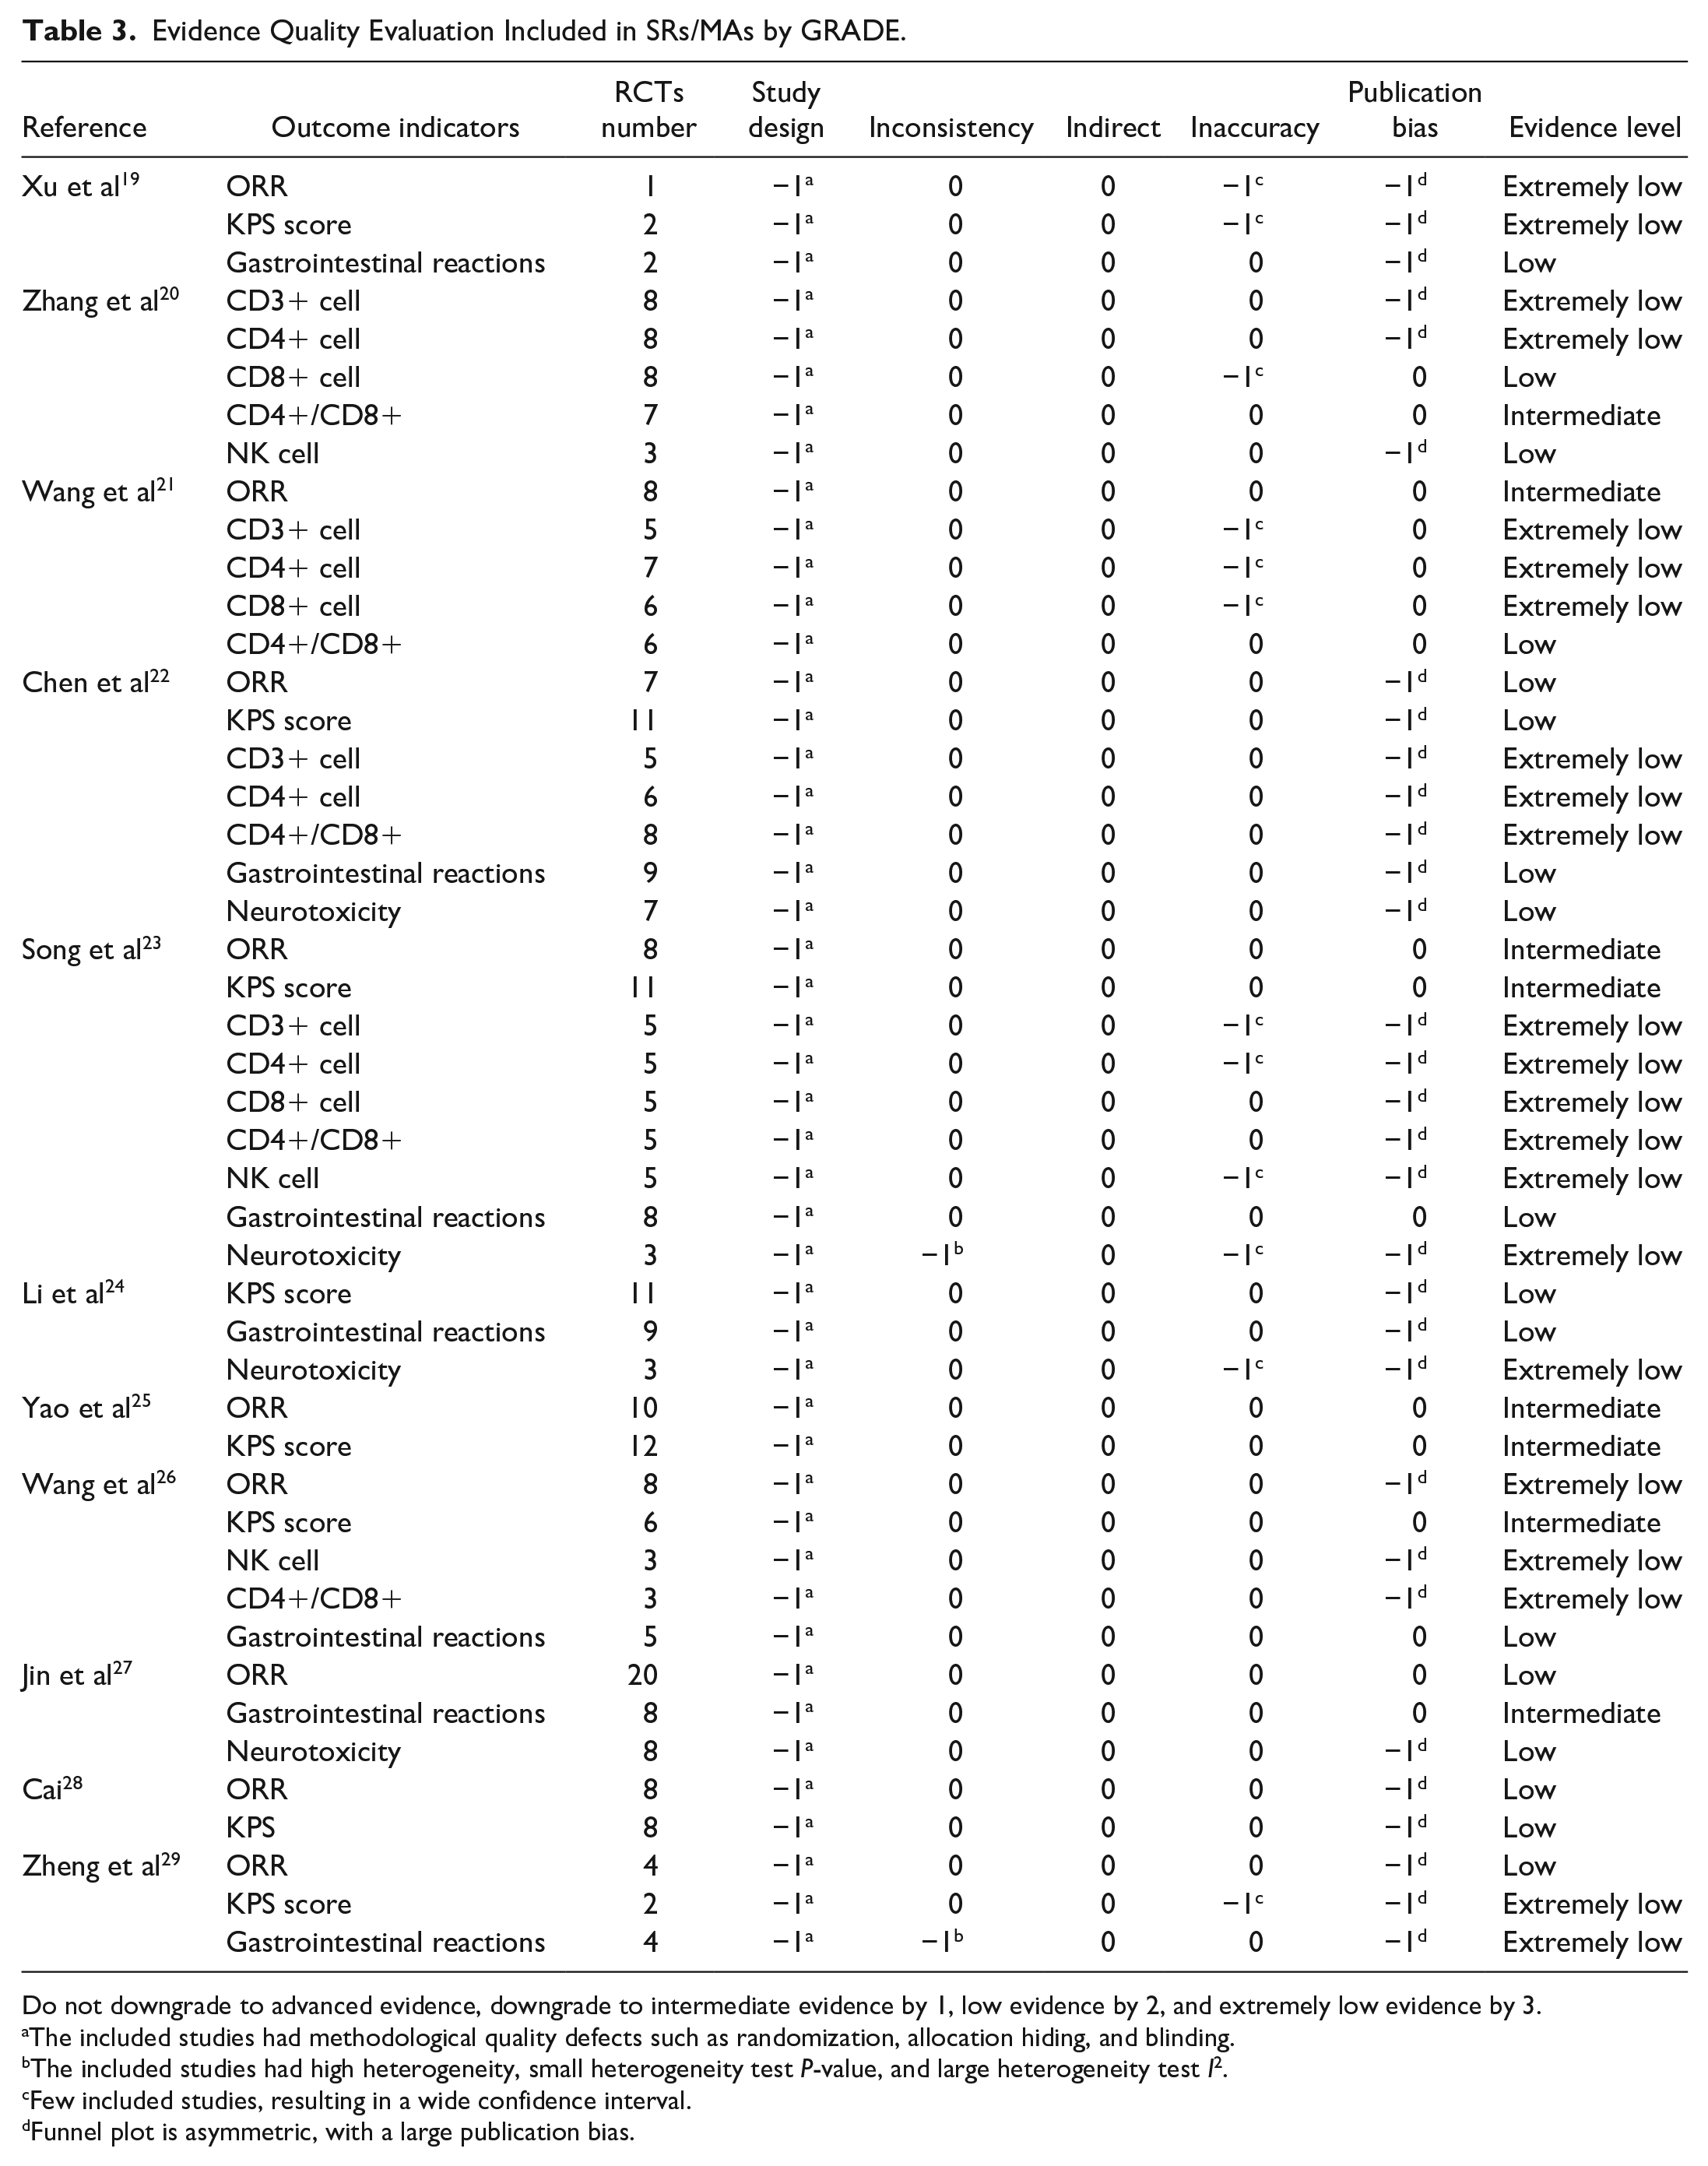
Do not downgrade to advanced evidence, downgrade to intermediate evidence by 1, low evidence by 2, and extremely low evidence by 3.
The included studies had methodological quality defects such as randomization, allocation hiding, and blinding.
The included studies had high heterogeneity, small heterogeneity test P-value, and large heterogeneity test I2.
Few included studies, resulting in a wide confidence interval.
Funnel plot is asymmetric, with a large publication bias.
Radar map evaluation
The publication year of the SRs/MAs ranged from 2012 to 2021, with a higher rank associated with more recent years. In 2021, 1 SR/MA 21 achieved the maximum rank of 11, while 2 SRs/MAs22,28 published in 2012 obtained the minimum rank of 2. All studies were RCTs, with a rank of 11. Among the SRs/MAs, one 20 had an I2 value exceeding 50% and a significance level of P < .01, resulting in a low homogeneity rank of 1. Four SRs/MAs19,24,28,29 did not provide any description of publication bias and received a minimum rank of 4. In terms of the AMSTAR-2, the highest rank achieved was 11, with a maximum score of 26, while the lowest rank was 1, with a score of 10. Regarding the PRISMA, the highest rank was 11, with a score of 41, while the lowest rank was 1, with a score of 20. Table 4 displayed the ranks of the 6 dimensions. Based on these ranks, a radar map was constructed, where a larger area represented higher literature quality and greater significance of the SRs/MAs. Please refer to Figure 6. The radar map clearly indicated that Wang et al 21 had the highest quality and the most balanced and stable scores, followed by Li et al. 24 On the other hand, Zheng et al 29 exhibited a lack of literature quality, with low scores in terms of publication bias, homogeneity, AMSTAR-2, and PRISMA.
SRs/MAs Rank Score on 6 Dimensions of Multivariate Evaluation.


SRs/MAs radar diagram.
Efficacy Evaluation of Included RCTs
Clinical efficacy
Our study conducted a meta-analysis of RCTs that were included in SRs/MAs. After screening and removing duplicates, 35 RCTs (2379 participants) reported the ORR, and no heterogeneity was observed between the studies (P = 1.00, I2 = 0%). Therefore, we used a fixed-effects model. The results indicated that the combination of SFI and CT yielded a statistically significant improvement in ORR compared to CT alone (RR = 1.30, 95% CI = [1.21, 1.41], P < .00001). Similarly, among the 33 RCTs (2240 participants) that reported the DCR, no heterogeneity was detected between the studies (P = .79, I2 = 0%), and a fixed-effects model was employed. The findings demonstrated that the combination of SFI and CT led to a superior DCR when compared to CT alone (RR = 1.13, 95% CI = [1.09, 1.18], P < .00001) (Figure 7).

Forest map of clinical efficacy.
KPS score
The study included 19 RCTs (1311 participants) which reported KPS. There was significant heterogeneity among the studies (P = .03, I2 = 41%), thus a random effect model was used. The results indicated that the KPS of the SFI combined with CT group was superior to that of the CT alone group (RR = 1.36, 95% CI = [1.25, 1.49], P < .00001) (Figure 8).

Forest map of KPS score.
CD4+/CD8+
The 21 RCTs involving 1635 participants reported CD4+/CD8+ levels, revealing significant heterogeneity among the studies (P < .0001, I2 = 86%). A random effect model was employed. The results indicated that the combined treatment of SFI with CT was associated with improved CD4+/CD8+ levels compared to CT alone (RR = 1.16, 95% CI = [0.87, 1.46], P < .00001). Sensitivity analysis helped identify the source of high heterogeneity, and the stability of the results remained unaffected even after consecutively excluding each study (Figure 9).

Forest map of CD4+/CD8+.
Adverse reactions
Gastrointestinal reaction
The 29 RCTs (1917 participants) included in this study reported gastrointestinal reactions, and exhibited significant heterogeneity (P = .02, I2 = 38%). To account for this heterogeneity, a random effects model was employed. The findings demonstrated that the incidence of gastrointestinal reactions was significantly lower in the group receiving SFI combined with CT compared to the CT alone group (RR = 0.67, 95% CI = [0.58, 0.78], P < .00001) (Figure 10).
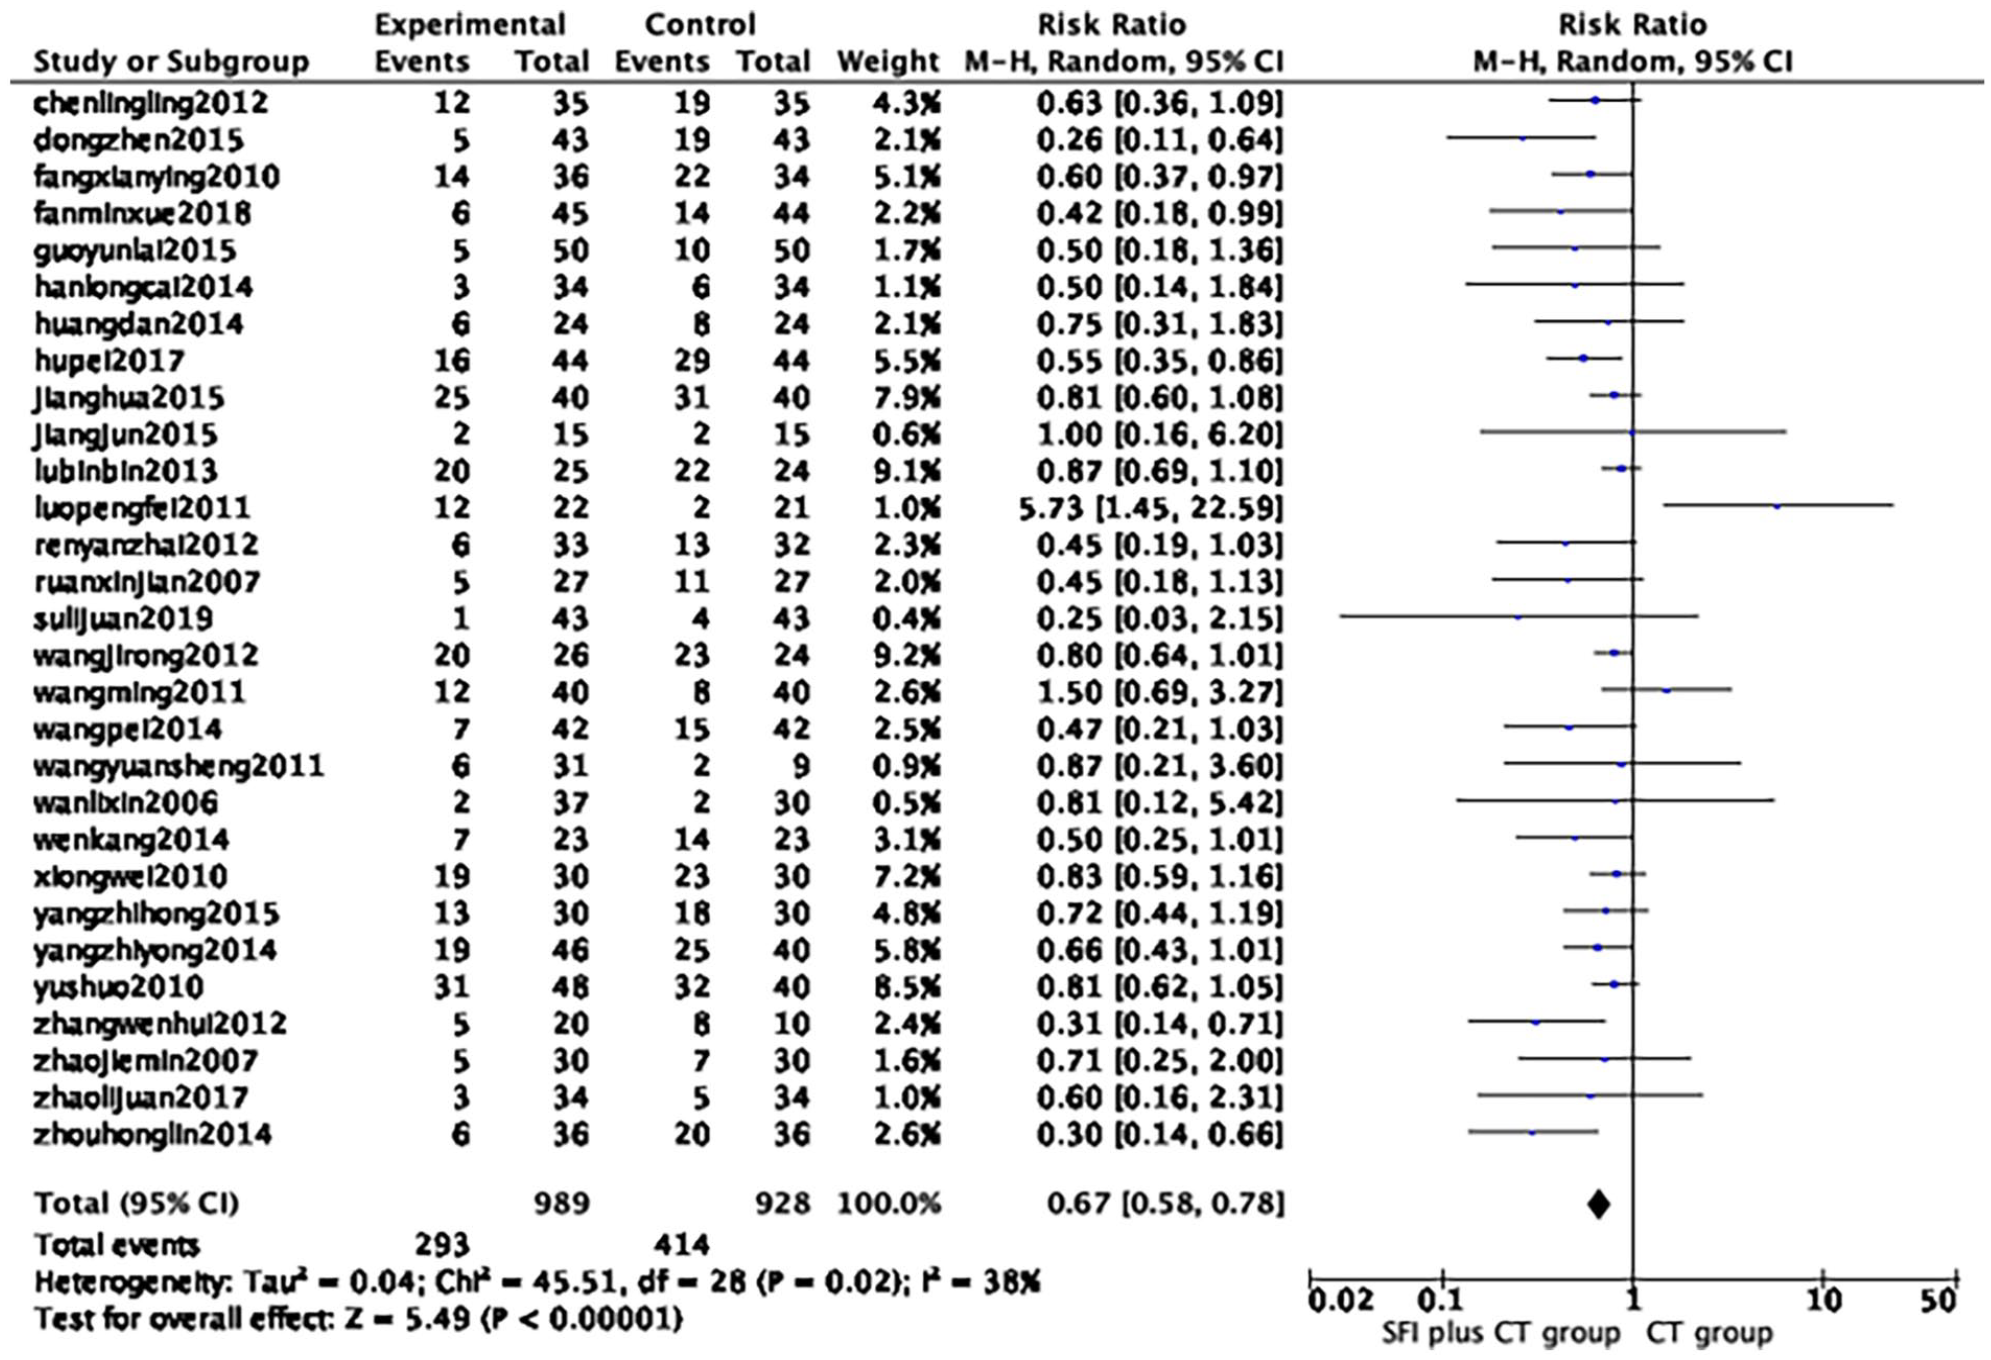
Forest map of gastrointestinal reaction.
Neurotoxicity
The 17 RCTs involving 1113 participants reported neurotoxicity, and there was no heterogeneity observed among the studies (P = .93, I2 = 0%). A fixed effect model was employed for analysis. The results revealed that the level of neurotoxicity in the group receiving SFI combined with CT was significantly lower compared to the group receiving CT alone (RR = 0.64, 95% CI = [0.50, 0.81], P = .0002) (Figure 11).

Forest map of neurotoxicity.
Sensitivity analysis
The study revealed a significant heterogeneity in the KPS (P = .03, I2 = 41%). After conducting a comparative analysis of the available literature, we removed the studies conducted by Chen et al, 30 Wang et al, 31 and Zhao. 32 As a result, the heterogeneity in the KPS decreased considerably (P = .57, I2 = 0%). This suggested that the heterogeneity was mainly attributed to the quality of the included studies. The forest map of sensitivity analysis of KPS score is shown in Supplemental Material 2 (Figure 1).
Publication bias
We performed a funnel plot analysis to evaluate the clinical efficacy, and the results revealed a lack of complete symmetry, which can be attributed to the inclusion of studies with low quality and small sample sizes (Figure 12).

Funnel plot of clinical efficacy.
Discussion
GC has a significant impact on the economic health due to its high morbidity and mortality rates. 33 Although CT is a common treatment for GC, its side effects often hinder patients from completing sufficient treatment courses, thus severely affecting the survival and prognosis of GC patients. In China, TCM serves as a complementary and alternative treatment method that enhances the efficacy of CT, reduces adverse reactions, and prolongs patient survival. Among these methods, SFI has gained attention in the adjuvant treatment of GC patients, leading to numerous related RCTs studies.34 -36 Likewise, several SRs/MAs have been conducted and frequently published, but inconsistencies still exist regarding the clinical efficacy and safety of SFI for GC. These inconsistencies pertain to its ability to improve clinical efficacy and quality of life for GC patients, as well as its potential to reduce adverse reactions.19,26 Consequently, our study focuses on evaluating the efficacy and safety of SFI in treating GC through SRs/MAs, utilizing AMSTAR-2, ROBIS, PRISMA 2020, GRADE, and radar map analysis to assess the quality of evidence for its clinical application.
Summary of Results
Our study comprehensively evaluated the efficacy and safety of adjuvant CT with SFI in the treatment of GC through 11 SRs/MAs. The results of the quantitative meta-analysis demonstrated that the combination of SFI and CT can improve the ORR and DCR in patients with GC, enhance their quality of life, boost immune function, and reduce the occurrence of gastrointestinal reactions and neurotoxicity. Although there were significant heterogeneities in some outcome measures, employing SFI in conjunction with CT for treating GC patients proved to be beneficial. However, the overall quality assessment of the original RCTs was poor, which resulted in the unreliability and instability of conclusions drawn by the corresponding SRs/MAs regarding the efficacy and safety of SFI in combination with CT for GC. Furthermore, most of the SRs/MAs did not meet the satisfactory level for overall methodological quality and evidence quality according to evaluations with AMSTAR-2, PRISMA 2020, ROBIS, and GRADE. Therefore, it is essential to enhance the quality of RCTs and the design of SRs/MAs protocols to obtain accurate and dependable conclusions.
AMSTAR-2 was employed to evaluate the methodological quality of the 11 SRs/MAs, out of which, none of them were classified as high or moderate quality. Five SRs/MAs were classified as low quality, and 6 were rated as extremely low quality. While all 11 SRs/MAs adhered to the PICO principles, described basic research characteristics, and employed appropriate statistical methods, they also exhibited several issues. Firstly, some studies failed to include professional registration platforms and grey literature, leading to incomplete retrieval results. Secondly, no study protocols were registered in any of the studies, potentially causing selective reporting bias. Thirdly, most studies employed the JADAD scale to evaluate the risk of bias in the included studies, resulting in incomplete information in the bias risk assessment. Finally, none of the studies reported the funding sources for the included studies, affecting the objectivity of the SRs/MAs results. Similar deficiencies were observed in PRISMA 2020. In the case of ROBIS, factors contributing to a high risk of bias included incomplete retrieval, screening, and data extraction processes, as well as the absence of sensitivity analysis. By constructing a radar map, we were able to further identify inconsistencies in the quality of the 11 SRs/MAs.
GRADE was utilized to assess the evidence level of the outcome indicators. Our findings demonstrate that the combination of SFI and CT can lead to improved ORR and DCR in GC patients, as well as enhanced quality of life and increased CD4+/CD8+ levels, while reducing the occurrence of gastrointestinal reactions and neurotoxicity. However, the evidence lacked high-quality data and exhibited varying levels of quality, ranging from “moderate” to “very low.” The primary reason for the low quality of evidence stemmed from the study design of RCTs (47/47, 100.00%), predominantly due to flaws in randomization, allocation concealment, blinding implementation, and potential risks of selective reporting. This was followed by publication bias (31/47, 65.96%) and inaccuracies (12/47, 25.53%), where the latter arose from small sample sizes and wide confidence intervals of the combined outcome indicator effect.
Implications for Future Studies
By summarizing the results, the implications for future studies are as follows: First, the high overlap of CCA suggests unnecessary repeatability when combining SFI with CT in the treatment of GC. Therefore, it is necessary to conduct pre-registration before starting new studies, regardless of whether they are SRs/MAs or RCTs. This pre-registration can prevent resource waste and enhance the stability and authenticity of the study. Future SRs/MAs should only be undertaken if the research purpose is entirely different. Second, it is crucial to develop a comprehensive and detailed retrieval strategy that includes the retrieval of grey literature and clinical trial registries. Simultaneously, the process of literature retrieval, data screening, and data extraction should strictly adhere to the principle of multi-person independence and duplication. Third, heterogeneity and research bias should not be overlooked, and subgroup and sensitivity analysis should be conducted to analyze the sources of heterogeneity and bias. Fourth, based on the GRADE analysis, it was found that the quality of evidence was low, primarily due to the declining quality of the included RCTs. To address this, future research should focus on designing high-quality RCTs with large sample sizes and placebo controls. Furthermore, it is important to acknowledge that funding and conflicts of interest can influence the objectivity of researchers. Therefore, all studies should consistently report their funding sources and conflicts of interest in a timely manner.
SFI is an intravenous injection of TCM derived from herbs like Codonopsis pilosula and Astragalus membranaceus, both known for their anti-tumor and immunomodulatory properties.37,38 A network meta-analysis of 6 TCM injections combined with the SOX regimen in treating GC revealed that SFI was superior to other TCM injections, enhancing the quality of life for GC patients, prolonging survival time, and reducing gastrointestinal reactions. 39 This overview suggests that combining SFI with CT is advantageous for GC patients. Numerous real-world studies have consistently shown that combining SFI with CT improves clinical efficacy, quality of life, and regulates the body’s immune response while reducing adverse reactions in cancer patients.34,40 -42 Furthermore, extensive fundamental studies have further supported the anti-tumor mechanism of SFI. These studies have shown that SFI can enhance the sensitivity of GC cells to chemotherapy through the lncRNA HOTAIR/miR-17-5p/PTEN axis, using 4 different GC cell lines (BGC-823, MGC-803, SGC-7901, and MKN2843). 43 Another study found that long-term administration of SFI can boost NK cell activity and macrophage phagocytosis by promoting the proliferation of T and B cells, thereby strengthening the body’s immune response. 44 In addition, the safety of TCM injections is a topic of great concern. A real-world analysis of 930 cases of SFI found that mild to moderate systemic allergic reactions are the main adverse events, with an incidence rate of 3.22%. After symptomatic treatment, they can all disappear. 45 Due to the fact that the SRs/MAs included in this study did not report adverse events related to SFI itself, there has not been much discussion on adverse events in the study.
Strengths and Limitations
In recent years, numerous SRs/MAs have demonstrated that using SFI as an adjuvant to CT can enhance the effectiveness and safety of GC treatment. However, SRs/MAs typically merge various studies in a simplistic qualitative and quantitative manner, which possesses certain limitations in establishing the quality and reliability of the evidence. In this study, we conducted a comprehensive evaluation of 11 SRs/MAs for the first time, utilizing an extensive search strategy and standardized quality assessment tools. Nevertheless, our study was not without limitations. First, the inclusion criteria for the overview did not restrict the stage and chemotherapy regimens of the GC patients, thereby potentially influencing the study outcomes. Second, the survival time is a crucial indicator for cancer patients, yet the majority of original studies lacked long-term follow-up data, precluding the assessment of SFI’s long-term efficacy in GC treatment. Third, the safety of TCM injections is a matter of utmost concern. It is noteworthy that the SRs/MAs included in this study did not report any adverse events associated with SFI. Consequently, there is a limited discussion on adverse events within the study, warranting attention in future research endeavors. Lastly, all the employed evaluation tools in the overview were heavily influenced by personal interpretation, rendering the quality assessment of the results somewhat subjective.
Conclusion
Through qualitative and quantitative synthesis and analysis of 11 SRs/MAs, our study discovered the beneficial effects of SFI combined with CT in treating patients with GC. Nonetheless, the overall quality assessment revealed limitations that compromised the reliability and stability of our findings. Undoubtedly, high-quality, large-sample RCTs remain crucial for establishing dependable clinical evidence.
Supplemental Material
sj-docx-1-ict-10.1177_15347354231210811 – Supplemental material for Shenqi Fuzheng Injection Combined With Chemotherapy for Gastric Cancer: An Overview of Systematic Reviews and Meta-Analyses
Supplemental material, sj-docx-1-ict-10.1177_15347354231210811 for Shenqi Fuzheng Injection Combined With Chemotherapy for Gastric Cancer: An Overview of Systematic Reviews and Meta-Analyses by Jing Xu, Xiao Li, Qing Dong, Liyuan Lv, Zhangjun Yun and Li Hou in Integrative Cancer Therapies
Supplemental Material
sj-docx-2-ict-10.1177_15347354231210811 – Supplemental material for Shenqi Fuzheng Injection Combined With Chemotherapy for Gastric Cancer: An Overview of Systematic Reviews and Meta-Analyses
Supplemental material, sj-docx-2-ict-10.1177_15347354231210811 for Shenqi Fuzheng Injection Combined With Chemotherapy for Gastric Cancer: An Overview of Systematic Reviews and Meta-Analyses by Jing Xu, Xiao Li, Qing Dong, Liyuan Lv, Zhangjun Yun and Li Hou in Integrative Cancer Therapies
Footnotes
Author Contributions
LH, LYL, and JX conceived and designed the study. JX and XL conducted the literature search, extracted and assessed the data. JX, QD, LYL, and ZJY wrote sections of the manuscript. All authors participated in the manuscript revision and approved the final version for submission.
Data Availability Statement
The original contributions presented in this study have been included in the article/Supplemental Material. For any further inquiries, please feel free to contact the corresponding authors.
Declaration of Conflicting Interests
The author(s) declared no potential conflicts of interest with respect to the research, authorship, and/or publication of this article.
Funding
The author(s) disclosed receipt of the following financial support for the research, authorship, and/or publication of this article: This work was supported by the National Natural Science Foundation of the People’s Republic of China (No: 81573959) and the Capital Health Development Scientific Research Special Project (2020-2-4193).
Supplemental Material
Supplemental material for this article is available online.
References
Supplementary Material
Please find the following supplemental material available below.
For Open Access articles published under a Creative Commons License, all supplemental material carries the same license as the article it is associated with.
For non-Open Access articles published, all supplemental material carries a non-exclusive license, and permission requests for re-use of supplemental material or any part of supplemental material shall be sent directly to the copyright owner as specified in the copyright notice associated with the article.