
Abstract
Introduction
Alzheimer’s disease (AD) is the most prevalent type of dementia, affecting an estimated 32 million people globally. 1 In the United States, AD impacts about 10.7% of those aged 65 and older, with its occurrence rising with age. 2 This condition significantly diminishes individuals’ quality of life, impairing their daily functioning, interpersonal relationships, and social engagement. It is the fifth-leading cause of death for Americans over 65, with 121 499 deaths recorded in 2019. 2 Moreover, caregivers experience substantial challenges and burdens in providing care to individuals with dementia and AD. In 2022, the estimated costs for healthcare, long-term care, and hospice for older adults with dementia totaled $321 billion. 2
Mild cognitive impairment (MCI) is a critical precursor to AD. Individuals with MCI exhibit significant cognitive decline that exceeds normal age-related changes yet does not meet the clinical criteria for dementia.3,4 Approximately 22% of those aged 71 and older are affected by MCI. 5 The risk of progressing from MCI to dementia is estimated to be 3 to 5 times greater than for those with normal cognitive functions,6-8 with an annual rate of progression estimated to be 12% in the general population and 17% to 20% in those with subtypes of prodromal AD and those with a history of stroke. 5
Accurately distinguishing between normal cognitive function, MCI, and AD is essential. Early and precise diagnosis of MCI and AD allows for interventions that can slow disease progression, thereby enhancing the quality of life for those affected. 9 Early detection of cognitive decline helps tailor specific care strategies that meet individual needs effectively, enabling patients and families to better manage the disease’s impacts. From a societal point of view, an accurate diagnosis informs more strategic healthcare planning and resource allocation, ensuring that patients receive appropriate treatments at the optimal time, and healthcare systems can better manage the substantial care demands associated with these conditions. This accuracy not only improves patient outcomes but also contributes to the overall efficiency of healthcare services, reducing unnecessary costs and maximizing the use of available medical and supportive resources.10,11
The study “Advancing Reliable Measurement in Alzheimer’s Disease and Cognitive Aging” (ARMADA), a longitudinal multi-site study,12,13 used the NIH Toolbox® (NIHTB), a “common currency” measuring multidimensional aspects of health across cognition, emotion, motor, and sensory function for individuals aged 65 to 85 across the cognitive spectrum from normal aging to Alzheimer’s dementia, aiming to predict cognitive decline and its association with Alzheimer’s disease biomarkers. 12 NIHTB is an iPad-based standardized assessment platform that can be easily administered in various settings with minimal training. It offers psychometrically robust, adaptable measures that ensure measurement consistency, support data sharing, and facilitate the integration of findings within research environments. This study aims to improve the identification of cognitive impairment by analyzing the ARMADA dataset to pinpoint key measures across domains that effectively differentiate individuals with normal cognition (NC), MCI, and AD.
Methods
Data Source and Population
This study used the ARMADA dataset, 12 which includes a diverse sample of adults aged 65 and above. The dataset includes assessment data from the baseline visit (year 1), with additional follow-up assessments at 12-month (year 2) and 24-month (year 3) intervals. The sample includes adults with normal cognitive functions (NC), those clinically diagnosed with mild cognitive impairment (MCI), and those diagnosed with AD.
Participants aged over 85 were excluded due to differing recruitment criteria. 12 While participants aged 65 to 85 were selected to represent a range of cognitive health statuses and demographic groups proportionate to the general U.S. population, those over 85 were recruited solely on cognitively normal individuals and primarily from one site.12,14 This group was excluded to maintain consistency in cognitive health representation.
Year 2 and year 3 data were also excluded due to loss of follow-up. In Year 2, 174 participants remained from the original 319 in Year 1, representing a 54.5% retention rate. In Year 3, 107 participants remained from the original 319 in Year 1, representing a 33.5% retention rate. This is largely due to the COVID-19 pandemic, which rendered in-person assessment difficult.
Variables
The following variables are used in this paper. (1) Dependent variable: diagnosis outcome, which includes normal cognitive function, mild cognitive impairment, and Alzheimer’s disease. (2) Demographic variables: race, age, gender, and education level. (3) Clinical assessment uncorrected score variables are (see Table 1 for details): Dimensional Change Card Sort (DCCS), Eriksen Flanker task (Flanker), List Sorting Working Memory (LSWM), Oral Reading Recognition (ORR), Pattern Comparison Processing Speed (PCPS), Picture Sequence Memory (PSM), Picture Vocabulary (TPVT), Anger – Affect (AngerAff), Anger – Hostility (AngerHost), Anger – Physical Aggression (AngerPhysAg), Emotional Support (EmoSup), Fear – Affect (FearAff), Fear – Somatic Arousal (FearSom), Friendship (Friend), General Life Satisfaction (GenLS), Instrumental Support (InstSup), Loneliness (Lone), Meaning and Purpose (MeanP), Perceived Hostility (PHost), Positive Affect (PosAff), Perceived Rejection (PReject), Perceived Stress (PStress), Sadness (Sad), Self-Efficacy (SelfEff), Grip Strength Test – Dominant hand (Gripd), Grip Strength Test - Non-dominant hand (Gripnd), 9-Hole Pegboard Dexterity Test - Dominant hand (Peg9hd), 9-Hole Pegboard Dexterity Test - Non-dominant hand (Peg9hnd), 2-Minute Walk Endurance Test (Walk2Min), 4-Meter Walk Gait Speed Test (Walk4M), Odor Identification Test (Odor), Pain Interference (PainInt), Visual Acuity Test (VisualAc), Words-In-Noise Test – left (WINL), Words-In-Noise Test – right (WINR) Clinical Assessment Score Variable Details.

Data Imputation
In this study, all records have less than 10% missing assessment scores. Missing clinical assessment scores were imputed using Multiple Imputation by Chained Equations (MICE) with random forest. 15 This method imputed missing values for each assessment score based on all available assessment scores in the dataset, as well as the demographic characteristics of the individual.
Descriptive Analysis
Descriptive analysis was conducted on demographic and clinical measures of all subjects. The analysis included counts, percentages, means, standard deviations, and statistical tests to compare differences among individuals with NC, MCI, and AD. Categorical variables (race, gender, and education level) were assessed using chi-square tests, while continuous variables (age and clinical assessments) were analyzed using t-tests.
Recursive Partitioning Tree Model
The study sample was randomly divided into a training set, which comprised 80% of the sample, and a test set, which comprised 20%. With this split, a recursive partitioning tree model 16 was used to classify individuals into three categories: NC, MCI, and AD. This model recursively splits the dataset based on the most significant variables at each decision point. It selects the variables that best separate the categories. It creates a decision tree that classifies individuals based on demographic information (race, age, gender, and education level) and clinical assessment scores from cognitive, motor, emotional, and sensory measures.
Model Evaluation and Interpretation
To evaluate the model’s performance, both multi-class macro-AUC and micro-AUC metrics were used.17,18 Macro-AUC provides insight into how well the model performs for each class, regardless of class size, while micro-AUC gives more weight to larger classes and reflects the model’s overall performance across the entire dataset. For both training and test sets, macro- and micro-AUC were calculated. The model is considered to perform well with higher AUC values, where 1 indicates perfect classification, and 0.5 suggests random chance. An AUC of 0.7 to 0.8 indicates acceptable discrimination, while values above 0.8 indicate excellent discrimination. 19
Additionally, we assessed the One-Vs-All ROC curve to gain insights into how well the model can identify individual categories within a multi-class classification problem. 20 Furthermore, we assessed the model’s performance using precision, recall, and F1 score. This helped us understand how accurately the model identified each cognitive state and balanced the trade-off between false positives and false negatives.
Interpreting the decision tree model involved visualizing its structure. Each split highlighted the most informative variables influencing classification. Higher-level splits indicated more influential factors in distinguishing cognitive states. This visualization can provide clear insights into the key drivers of cognitive function and impairment.
Model Validation
To evaluate the performance and generalizability of the classification model, we employed a five-fold cross-validation,21-23 which provides a reliable performance estimate while mitigating overfitting. The dataset was randomly divided into five subsets. Each subset maintained a representative distribution of the cognitive states: NC, MCI, and AD. In each iteration, one fold served as the test set, while the remaining four were used for training. This process was repeated until each fold had been tested. Performance was evaluated using accuracy, calculated as the proportion of correctly classified instances, and Cohen’s Kappa, which accounts for chance agreement and offers a more robust measure of effectiveness. Kappa above 0.4 indicates moderate agreement, while a value above 0.6 indicates substantial agreement. 24
Model Comparison and Benchmarking
The performance of the recursive partitioning tree model was compared with three benchmark models: Support Vector Machine (SVM), 25 Random Forest, 26 and Neural Network. 27 The SVM model was implemented with a radial basis function kernel. The Random Forest model was specified with 500 trees, and the maximum depth of each tree was left unrestricted. The Neural Network model consisted of a feedforward architecture with one hidden layer containing 10 nodes, a maximum of 200 iterations, and a weight decay of 0.01 to help prevent overfitting.
These models were chosen to evaluate whether they provide superior classification performance in identifying individuals with NC, MCI, and AD. All models were trained and evaluated on the same dataset, and their performance was assessed using macro- and micro-AUC metrics to compare classification results.
Sensitivity Analysis
To further evaluate the robustness of the model and understand the influence of individual predictors on its performance, we conducted a sensitivity analysis using two approaches: Global Sensitivity Analysis (GSA)28-30 and Scenario Sensitivity Analysis.31,32
GSA used Sobol’s indices to quantify the contribution of each predictor variable to the output variance of the model.28-30 This method provides a detailed understanding of how uncertainty in model inputs propagates to uncertainty in model predictions. By calculating the main effect (first-order) and total effect (total Sobol index) for each predictor, we gained a better understanding of their individual and combined impacts. The main effect represents the contribution of a single predictor to the output variance, assuming all other variables are held constant. In contrast, the total effect captures both the individual contribution of a predictor and its interactions with other variables. This analysis highlighted the most influential predictors, allowing us to prioritize them for further exploration.
Additionally, we performed a Scenario Sensitivity Analysis31,32 by systematically removing the most important predictors identified in GSA and observing how the model’s performance was affected. This approach enabled us to evaluate the model’s stability and adaptability by assessing its ability to maintain performance in the absence of key variables. Furthermore, we monitored which alternative variables were selected by the model in these scenarios, thus revealing potential compensatory relationships among predictors. Collectively, these sensitivity analyses not only highlighted the critical predictors that significantly influence the model’s outcomes, but also enhanced our understanding of the model’s resilience and flexibility in varying conditions.
Subgroup Analysis
To explore potential variations in the model’s performance across different age groups, we conducted a subgroup analysis stratifying the dataset into two distinct categories based on the median age: individuals aged 72 years or younger and those aged 73 years or older. This division allowed us to investigate how age might influence the model’s predictive capabilities. Evaluation metrics such as macro- and micro-AUC were used to assess the model’s performance within each age group.
Results
Study Cohort and Descriptive Analysis
To establish the cohort for this study (Figure 1), 850 records for 462 unique individuals in the ARMADA database were extracted. The final study population included 319 unique individuals aged between 65 and 85 with baseline assessment data. Flow Diagram of the Study Population.
Demographic Characteristics by Cognitive States.

Notes for abbreviations: NC: normal cognition; MCI: mild cognitive impairment; AD: Alzheimer’s disease.
Clinical Assessment by Cognitive States.
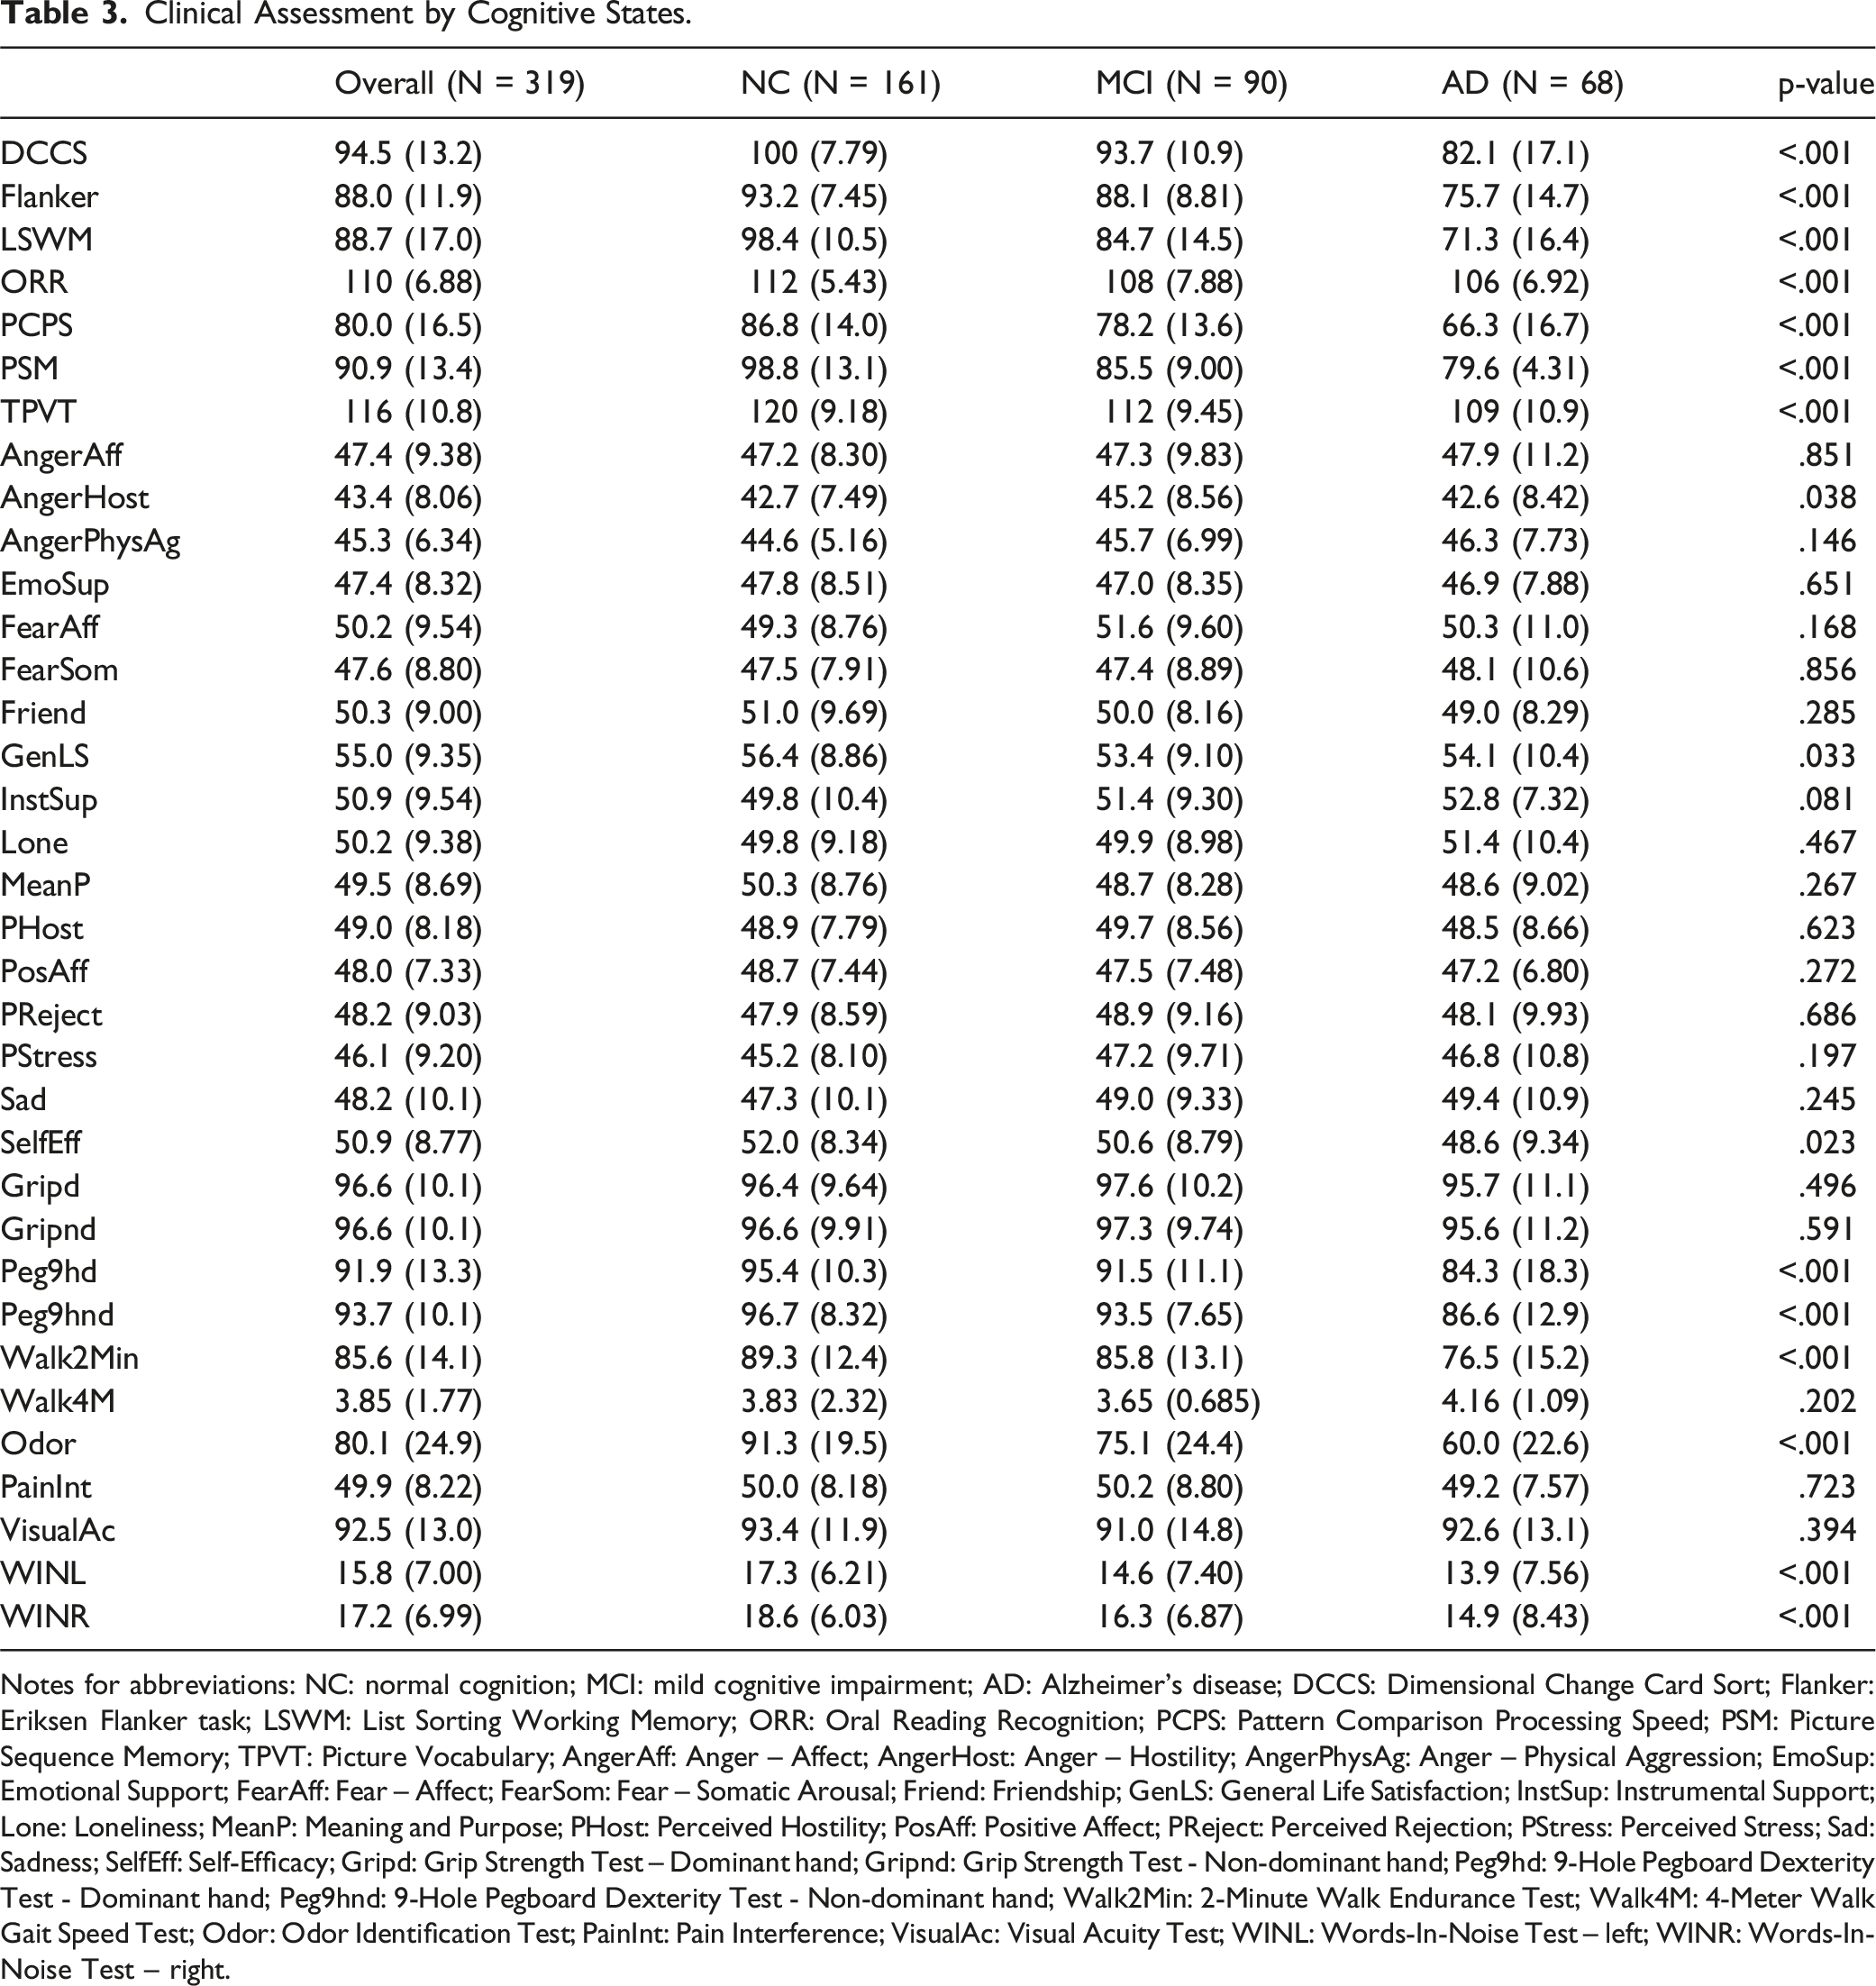
Notes for abbreviations: NC: normal cognition; MCI: mild cognitive impairment; AD: Alzheimer’s disease; DCCS: Dimensional Change Card Sort; Flanker: Eriksen Flanker task; LSWM: List Sorting Working Memory; ORR: Oral Reading Recognition; PCPS: Pattern Comparison Processing Speed; PSM: Picture Sequence Memory; TPVT: Picture Vocabulary; AngerAff: Anger – Affect; AngerHost: Anger – Hostility; AngerPhysAg: Anger – Physical Aggression; EmoSup: Emotional Support; FearAff: Fear – Affect; FearSom: Fear – Somatic Arousal; Friend: Friendship; GenLS: General Life Satisfaction; InstSup: Instrumental Support; Lone: Loneliness; MeanP: Meaning and Purpose; PHost: Perceived Hostility; PosAff: Positive Affect; PReject: Perceived Rejection; PStress: Perceived Stress; Sad: Sadness; SelfEff: Self-Efficacy; Gripd: Grip Strength Test – Dominant hand; Gripnd: Grip Strength Test - Non-dominant hand; Peg9hd: 9-Hole Pegboard Dexterity Test - Dominant hand; Peg9hnd: 9-Hole Pegboard Dexterity Test - Non-dominant hand; Walk2Min: 2-Minute Walk Endurance Test; Walk4M: 4-Meter Walk Gait Speed Test; Odor: Odor Identification Test; PainInt: Pain Interference; VisualAc: Visual Acuity Test; WINL: Words-In-Noise Test – left; WINR: Words-In-Noise Test – right.
With respect to clinical assessments, there are statistically significant differences for all cognition tests, including DCCS, Flanker, LSWM, ORR, PCPS, PSM, and TPVT, with NC showing the highest average scores and AD the lowest. Additionally, there is a significant difference for a few of the emotion tests, including AngerHost Test (NC: 42.7; MCI: 45.2; AD: 42.6; p-value = .038), GenLS Test (NC: 56.4; MCI: 53.4; AD: 54.1; p-value = .033), and SelfEff Test (NC: 52.0; MCI: 50.6; AD: 48.6; p-value = .023). Finally, many motor tests and sensation tests also show significant differences. For motor tests, Peg9hd and Peg9hnd show significant differences (NC: 95.4 and 96.7; MCI: 91.5 and 93.5; and AD: 84.3 and 86.6; p-value <.001), and Walk2Min Test (NC: 89.3; MCI: 85.8; AD: 76.5; p-value <.001). For sensation tests, there is a significant difference for Odor Identification test (NC: 91.3; MCI: 75.1; AD: 60.0; p-value <.001), and Words-In-Noise Test, both left (NC: 17.3; MCI: 14.6; AD: 13.9; p-value <.001) and right (NC: 18.6; MCI: 16.3; AD: 14.9; p-value <.001).
Recursive Partitioning Tree Model
The study cohort was randomly split into 255 (80%) for training set and 64 (20%) for test set. The macro-AUC and micro-AUC were 0.92 and 0.91 for the training set, suggesting that the model achieved high accuracy in predicting cognitive states. When applied to the independent test set, the macro-AUC and micro-AUC scores were slightly lower, at 0.89 and 0.86, respectively. Despite this minor reduction in performance, the results suggest that the model retained its predictive power when faced with unseen data.
In addition to the AUC metrics, the model’s confusion matrix (Figure 2) and One-Vs-All ROC curves (Figure 3) were presented, and precision and recall scores were evaluated for each cognitive category (Table 4). The precision for AD was at 0.78, indicating that 78% of the time, the model’s predictions for AD were correct. The recall for AD was notably high at 0.84, demonstrating the model’s proficiency in identifying most actual cases of AD, which is essential for timely clinical interventions. Similarly, for normal cognitive function, the precision and recall scores of 0.83 and 0.88, respectively, suggested strong reliability in the model’s predictions. Conversely, the model exhibited some challenges with MCI classification, as indicated by a precision score of 0.73 and a recall score of 0.61. This discrepancy may suggest difficulties in accurately distinguishing MCI from other cognitive states, possibly due to shared characteristics between MCI and AD, as well as between MCI and NC. Confusion Matrix. One-Vs-All ROC Curves. Precision, Recall, and F1 Score.


For interpretation (Figure 4), the decision tree selected used only nine assessments for prediction, starting with the PSM for episodic memory, and were further assessed using the LSWM. The majority of individuals with NC were predicted by high PSM scores, indicating intact episodic memory function. Conversely, most individuals with MCI were characterized by low PSM scores and high LSWM scores, suggesting compromised episodic memory alongside preserved working memory capacity. In contrast, most individuals with AD demonstrated low scores on both PSM and LSWM, indicating impairment in both episodic and working memory domains. This could be attributed to the progressive nature of AD, where both episodic and working memory types are affected as the disease advances. To enhance prediction accuracy, the tree model branches further based on specific PSM and LSWM score ranges. Those with high PSM (PSM >= 90) and high LSWM (LSWM >= 88) scores were further evaluated using PHost score to discern between NC and MCI. Those with low PSM (PSM < 90) and high LSWM (LSWM >= 72) scores were subsequently evaluated using the PCPS test, followed by either GenLS Test and AngerHost Test to distinguish between NC and MCI, or the Peg9hnd Test and Walk4M Test to distinguish between MCI and AD. Finally, those with low scores on both PSM (PSM < 90) and LSWM (LSWM < 72) were assessed using the Flanker task to discern between MCI and AD. Decision Tree for Cognitive Assessment. Notes for Interpretation: The Percentage Displayed at the Bottom of Each Box Represents the Proportion of Data Contained Within that Box. The Three Numbers Within Each Box Indicate the Percentage of Data Corresponding to the NC, MCI, and AD Groups. For Example, the Bottom Left Box Shows a Percentage of 33%, Indicating that it Includes 33% of the Sample. The Three Numbers - 0.94, 0.06, and 0.00 - Indicate that 94% of the Samples in this Box Belong to the NC Group, While 6% are in the MCI Group. Notes for Abbreviations: MCI: Mild Cognitive Impairment; AD: Alzheimer’s Disease; PSM: Picture Sequence Memory; LSWM: List Sorting Working Memory; PHost: Perceived Hostility; PCPS: Pattern Comparison Processing Speed; GenLS: General Life Satisfaction; AngerHost: Anger – Hostility; Peg9hnd: 9-Hole Pegboard Dexterity Test - Non-dominant Hand; Walk4M: 4-Meter Walk Gait Speed Test; Flanker: Eriksen Flanker Task
5-Fold Cross-Validation
The results from the five-fold cross-validation demonstrate an overall accuracy of 70.22%, which suggests a solid level of performance in distinguishing among the cognitive states, and a Kappa statistic of 0.52, which indicates moderate agreement. These findings suggest that the model makes informed decisions based on the input features and effectively captures the underlying patterns in the data beyond random guessing.
Model Comparison and Benchmarking
AUC Comparison for Recursive Partitioning Tree, SVM, Random Forest, and Neural Network

In summary, while SVM, Random Forest, and Recursive Partitioning Tree performed well, Neural Network struggled. SVM exhibited the highest performance on the training set but was overfitted, while Random Forest and Recursive Partitioning Tree offered more balanced results, with Recursive Partitioning Tree showing the most consistent performance across both training and test sets.
Global Sensitivity Analysis
The Global Sensitivity Analysis (Figure 5) indicates that PSM emerges as the most significant predictor, with a main effect of 0.43, which underscores its strong influence on model outcomes. LSWM follows as the second most important predictor, with an index of 0.24, suggesting a meaningful contribution to the model as well. Conversely, PHost, PCPS, and GenLS have notably lower indices of 0.11, 0.01, and 0.10, respectively, indicating their lesser impact on the model’s predictive power. Additionally, the total effect reveals interaction among parameters, particularly evident in the shifts of total indices (total effect) when key predictors are modified. PSM’s total effect of 0.74 confirms that it is consistently a key predictor, both on its own and when interacting with other variables. The total effect’s broader confidence intervals for other predictors, such as AngerHost and Flanker, suggest that these variables might need closer examination. Sobol’s Indices From Global Sensitivity Analysis
Scenario Analysis
The scenario sensitivity analysis revealed valuable insights into the robustness of the model’s performance when key predictors were removed. In the first scenario, we removed PSM, the most important predictor, which resulted in a decrease in both in-sample macro- and micro-AUC from 0.92 to 0.86 and from 0.91 to 0.87, respectively, while out-of-sample AUC fell from 0.89 to 0.76 and from 0.86 to 0.75. Despite this reduction, the model maintained an acceptable predictive power, with LSWM becoming the most significant predictor. However, the AUC values in this scenario were lower than when PSM was included, indicating that LSWM is not fully interchangeable with PSM but serves as an acceptable substitute in PSM’s absence. Secondary predictors PCPS and Flanker also gained prominence, underscoring the model’s adaptability by leveraging alternative cognitive features for classification.
In the second scenario, LSWM was removed, and in-sample AUC values remained similar to the original model (0.90 macro-AUC and 0.91 micro-AUC), but out-of-sample performance dropped from 0.89 to 0.76 (macro-AUC) and from 0.86 to 0.75 (micro-AUC). This finding further suggests that the model can still effectively capture relevant cognitive patterns even when a key predictor is absent. This pattern suggests that while the model can achieve strong predictive performance without LSWM on the training data, the predictor plays a key role in generalizing to an independent dataset. LSWM, therefore, appears crucial for maintaining the model’s stability and predictive accuracy across broader contexts. In the absence of LSWM, Flanker and PHost gained prominence as significant predictors. Flanker, linked to cognitive control, indicates the model’s reliance on cognitive processes, while PHost adds a social-emotional dimension, implying that perceived hostility may interact with or influence cognitive performance.
Subgroup Analysis
In the subgroup analysis, the model’s performance was evaluated for two distinct age groups: individuals aged 62 to 72 and those aged 73 to 84. The younger group (62 to 72 years) exhibited training AUC values of 0.94 and out-of-sample values of 0.77 (for both macro- and micro-AUC), while the older group (73 to 84 years) showed training AUC values of 0.90, with out-of-sample values of 0.76 (macro) and 0.78 (micro), demonstrating the model’s consistent effectiveness across both demographics. The minimal performance differences across age groups and the alignment of predictive factors with those of the overall model highlight its robustness, suggesting that the model effectively captures critical variables related to cognitive impairments regardless of age. Additionally, both age-specific models exhibit features that closely align with those of the overall model, suggesting that the model effectively captures critical variables relevant to cognitive impairments regardless of age.
Discussion
Summary of Findings and Key Implications
Using the ARMADA dataset, this study used a decision tree model to identify key clinical assessments across cognition, emotion, motor, and sensation domains to distinguish individuals with normal cognition, MCI, and AD. PSM and LSWM were the most influential features, while PCPS, Peg9hnd, Walk4M, and Flanker also contributed to classification. Additionally, self-reported measures such as PHost, GenLS, and AngerHost played a role in distinguishing cognitive states. The predictive power of PSM and LSWM aligns with prior research emphasizing the centrality of cognitive assessments in delineating cognitive states.33,34 Furthermore, the inclusion of additional predictive variables is consistent with the emerging evidence that non-cognitive factors, such as fine motor skills35-37 and emotional regulation, 38 may offer valuable insights for differentiating cognitive states.
The robustness and generalizability of the model were evaluated using a range of analytical approaches. Five-fold cross-validation was employed to reduce the risk of overfitting and to provide a more reliable estimate of model accuracy. Global Sensitivity Analysis was conducted to identify the most influential predictors, notably emphasizing the PSM as a critical variable in the model. Furthermore, scenario analysis was performed to examine how the model operates, ensuring its adaptability and robustness. Subgroup analysis was also utilized to confirm that the model’s effectiveness remained consistent across different age groups, thereby validating its applicability in diverse clinical settings. These methodologies enriched the interpretation of the model’s performance, reinforcing its robustness and generalizability.
Importance of Non-Cognitive Factors
This study not only incorporated a variety of cognitive assessments, such as PSM and LSWM, but also highlighted the significance of non-cognitive measures, including fine motor skills (Peg9hnd), gait speed (Walk4M), emotional regulation (PHost, AngerHost), and general life satisfaction (GenLS). These non-cognitive variables provided additional layers of insight that enhanced the model’s predictive power, as they are likely to reflect broader neurological and psychological processes that influence cognitive function. Previous research has shown that fine motor skills and emotional regulation are not only markers of neurological integrity, but also influence cognitive performance in individuals with varying levels of cognitive decline.38-41 Additionally, integrating these non-cognitive measures into longitudinal studies could offer a deeper understanding of their role in cognitive decline progression. 40
Comparison with Prior Studies
Early diagnosis enables prompt access to support services, therapeutic options, and lifestyle adjustments that may positively influence cognitive outcomes. While traditional diagnostic procedures for cognitive impairment often rely on a combination of biomarker testing and neuropsychological assessments, which often require specialized equipment, 42 this study explores the potential of a data-driven approach using a machine-learning predictive model. Our model incorporates four cognitive tests, two motor function tests, and three self-reported emotion measures to differentiate between NC, MCI, and AD. This method adds to the growing evidence of the utility of machine-learning models in identifying people with MCI and AD.
This study achieved macro-AUC and micro-AUC scores of 0.92 and 0.91 on the training set, and 0.89 and 0.86 on the test set, respectively. By comparison, Park et al 43 reported AUCs of 69.5 with linear regression, 70.6 with support vector machine (SVM), and 76.1 for random forest. Moore et al reported an AUC of 0.82 using random forest, 44 while Revathi et al 45 reported AUCs of 0.90 with SVM and 0.74 with random forest, though it is unclear if these values are in-sample or out-of-sample predictions. In conclusion, this study’s model demonstrated competitive and, in most cases, superior predictive performance compared to previous approaches.
Limitations
This study has several limitations that may affect the generalizability of its findings. The sample is predominantly white and highly educated, which may limit the applicability of our results to more diverse populations. Cognitive risk factors, healthcare access, and socio-economic influences vary across racial and educational groups, suggesting that the model may require further validation and refinement in underrepresented populations. The lack of racial diversity also prevents subgroup analyses on cognitive outcomes across different demographic groups. Additionally, the exclusion of individuals over 85 years, a group at elevated risk for Alzheimer’s disease, limits our ability to examine cognitive risk factors specific to the oldest adults, reducing the comprehensiveness of our findings on late-life cognitive impairment. Furthermore, the omission of follow-up data from years 2 and 3 due to participant attrition constrains the broader applicability of the results, and it restricts our evaluation of the model’s predictive performance over time. Moreover, while our decision tree model achieved high accuracy in predicting cognitive states, it may not capture the full complexity of cognitive impairment, and further refinement and validation are warranted. Lastly, the cross-sectional nature of our study precludes causal inference, and longitudinal research is needed to validate our findings and assess the predictive utility of our model over time.
Future Research
Future research should aim to address the limitations identified in this study and further explore the potential of non-cognitive measures in cognitive health assessment. Longitudinal studies that follow participants over time would provide valuable insights into the trajectory of cognitive decline and the predictive validity of our model. In particular, Random Survival Forests could be a promising method for analyzing survival data and assessing the model’s ability to predict cognitive decline over time.46,47 Additionally, efforts to refine and validate our decision tree approach in diverse populations and clinical settings would enhance its utility and applicability. Furthermore, incorporating other machine learning methods, such as random forests, support vector machines, or neural networks, could provide a more robust comparison and potentially improve predictive accuracy. Finally, investigating the underlying mechanisms linking non-cognitive factors to cognitive impairment could shed light on novel targets for intervention and prevention strategies. Overall, continued research in this area holds promise for advancing our understanding of cognitive health and improving diagnostic and therapeutic approaches for individuals at risk of cognitive decline.
Footnotes
Ethical Statement
Ethical Considerations
This study is a secondary analysis using data collected from the original study, which received ethical approval from Northwestern University. The data used for this analysis is de-identified and adheres to privacy and confidentiality guidelines. Given the secondary nature of the analysis and the use of de-identified data, no additional ethical approval was required.
Author Contributions
All authors contributed to the study’s conception and design. Material preparation and data collection were performed by Dr. Emily H. Ho, Dr. Lihua Yao, and Dr. Richard C. Gershon. Study design and analysis were performed by Zhidi Luo, Stella (Ping) Wang, supervised by Emily H. Ho. The first draft of the manuscript was written by Zhidi Luo, and all authors critically reviewed and revised the manuscript. All authors read and approved the final manuscript.
Funding
The authors disclosed receipt of the following financial support for the research, authorship, and/or publication of this article: This project was supported by Federal funds from the National Institute on Aging, National Institutes of Health, under grant No. U2CAG057441 (Gershon, Weintraub). The analysis presented in this manuscript did not receive any additional funding.
Declaration of Conflicting Interests
The authors declared no potential conflicts of interest with respect to the research, authorship, and/or publication of this article.
Data Availability Statement
The data is planned to be made publicly available within the next 12 months. Until then, it can be accessed upon request.