
Abstract
Objective
Alzheimer’s disease and mild cognitive impairment involve brain atrophy, but neurotransmitter changes and their clinical implications are not well defined. This study aimed to examine the relationship between gray matter atrophy and neurotransmitter distributions and to build machine-learning models using gray matter–neurotransmitter co-localization as features.
Methods
Among 262 participants from the Alzheimer’s Disease Neuroimaging Initiative (140 with Alzheimer’s disease, 50 with mild cognitive impairment, and 72 controls), we used structural magnetic resonance imaging and voxel-based morphometry (family-wise error < 0.05), and JuSpace toolbox was used to assess the spatial correlation between gray matter atrophy and 13 neurotransmitter maps. We applied a train/validation/fixed test split (the test set was never used for selection or training); features were screened by univariate regression and least absolute shrinkage and selection operator regression, and models trained with nested 10-fold cross-validation were evaluated by the area under the receiver operating characteristic curve.
Results
Both Alzheimer’s disease and mild cognitive impairment showed gray matter loss in temporal, frontal, and cingulate areas. Atrophy was correlated with serotonergic, dopaminergic, and glutamatergic systems (false-discovery rate < 0.05). In mild cognitive impairment, reduced metabotropic glutamate receptor 5/μ-opioid receptor–gray matter correlation was associated with higher depression scores (r = −0.44, p = 0.001; r = −0.44, p = 0.001). The Random Forest model achieved an area under the receiver operating characteristic curve of 0.821, and Shapley additive explanations analysis confirmed key feature contributions.
Conclusion
Neurotransmitter-linked gray matter changes contribute to the pathology of Alzheimer’s disease and mild cognitive impairment. The machine-learning model accurately differentiates these conditions, suggesting its utility for early diagnosis and disease staging.
Introduction
Alzheimer’s disease (AD), the leading cause of neurodegeneration in older adults, presents with gradual cognitive deterioration and behavioral changes. 1 Pathologically, it involves the accumulation of amyloid plaques and neurofibrillary tangles.2,3 As global cases surpass 26 million, forecasts predict a substantial rise, with 1 in 85 individuals expected to be affected by 2050. Mild cognitive impairment (MCI) frequently emerges as an early indicator before progression to AD, 4 underscoring the importance of advanced imaging approaches for timely differentiation between these conditions.
Structural magnetic resonance imaging (MRI) has clearly shown that medial temporal lobe atrophy (particularly in the hippocampus, entorhinal cortex, and parahippocampal gyrus) is a hallmark of AD,5,6 with volume reduction strongly associated with memory decline.7–9 Diffusion tensor imaging reveals degeneration of white matter tracts,10,11 while resting-state and task-based functional MRI demonstrate disruptions of large-scale brain networks.12,13 Advanced voxel-based methods such as Granger causality analysis further delineate the directionality of regional interactions. 14 Moreover, integrating neuroimaging data into machine-learning frameworks has shown promise in refining diagnostic and prognostic tools.15,16 However, these modalities alone may overlook complex multimodal interactions and cannot directly probe underlying neurochemical substrates.
Neurotransmitter systems—including glutamatergic, gamma-aminobutyric acid (GABA)-ergic, serotonergic, and dopaminergic pathways—play critical roles in synaptic plasticity, neuroprotection, and neurotoxicity throughout the AD continuum. 17 Positron emission tomography/single‑photon emission computed tomography (PET/SPECT) studies using tracers such as [11C] ABP688 for metabotropic glutamate receptor 5 (mGluR5) and [18F] FPEB have demonstrated altered receptor availability in limbic and cortical regions,18,19 but interventions targeting neurotransmitter pathways in AD and MCI have yielded variable outcomes, likely reflecting limited cohort sizes, inadequate stratification, and incomplete characterization of neurochemical imbalances.
Given the heterogeneity of neurotransmitter abnormalities and the practical limitations of collecting cohort-specific PET/SPECT data, an attractive strategy is to test whether the spatial pattern of our MRI-detected differences aligns with normative maps of specific transmitter systems. Cross-modal frameworks span complementary levels: spatial correspondence between MRI effect maps and receptor distributions (JuSpace), receptor-enriched functional connectivity (REACT), and transcriptomic alignment with brain-wide gene-expression patterns (abagen). We focused on spatial correspondence between gray matter (GM) and neurotransmitter receptors, and the JuSpace toolbox is designed for this purpose: it quantifies cross-modal spatial associations between MRI effect maps and PET/SPECT-derived receptor or transporter distributions (dopaminergic, serotonergic, noradrenergic, and GABAergic), provides permutation-based inferences and false discovery rate (FDR) control, and demonstrates robustness across atlases.20,21 This makes it well suited to our aim of probing putative neurochemical contributions when participant-level molecular imaging is unavailable or underpowered.
JuSpace has been used to link disease- or pharmacologically induced MRI signals to their molecular targets (e.g. dopaminergic and serotonergic correlates in Parkinson’s disease and risperidone-induced cerebral blood flow (CBF)/functional MRI (fMRI) changes) and continues to be adopted in multimodal studies addressing similar cross-modal questions.20–23
In this study, we applied JuSpace to quantify the spatial correspondence between GM alterations in AD/MCI and normative PET and SPECT neurotransmitter maps. We then related these system signatures to clinical measures. These analyses clarify neurochemical mechanisms across the disease continuum.
Materials and methods
Data resources
All data used in this study were obtained from a database of the Alzheimer’s Disease Neuroimaging Initiative (ADNI) (https://adni.loni.usc.edu/), a longitudinal multicenter study that recruited participants from North America. 24 ADNI was launched in 2003 as a public–private partnership led by the principal investigator Michael W. Weiner, MD. By integrating data from multiple imaging and clinical evaluation and sharing these data with researchers worldwide, ADNI aims to improve the diagnosis and treatment of AD. Detailed information on the ADNI cohort, study protocol, and MRI acquisition and processing is available on the ADNI website (https://adni.loni.usc.edu/). In brief, ADNI is a publicly accessible repository of structural MRI and resting-state fMRI data. We enrolled 265 participants from ADNI1, ADNIGO, ADNI2, and ADNI4, including patients with AD (n = 143), patients with MCI (n = 50), and healthy controls (HC) (n = 72) (Figure 1). Data were accessed through the ADNI Image and Data Archive using a single portal with unified filters to identify eligible participants across study phases.

Flowchart of participant screening. Participants were selected from the ADNI database. Radiological criteria required 3.0 T Siemens MRI with 3D T1-weighted MPRAGE. After screening the HC, MCI, and AD cohorts and quality check (3 AD excluded), 262 participants remained for analysis. ADNI: Alzheimer’s Disease Neuroimaging Initiative; AD: Alzheimer’s disease; MCI: mild cognitive impairment; HC: healthy controls; MRI: magnetic resonance imaging; 3D: three-dimensional; MPRAGE: magnetization-prepared rapid gradient echo.
MRI data acquisition
All participants’ MRI data were acquired with a 3.0 T Siemens scanner using a sagittal sequence with the following parameters: flip angle = 9.0º, matrix X = 240.0 pixels, matrix Y = 256.0 pixels, matrix Z = 176.0 pixels, slice thickness = 1.2 mm, echo time (TE) = 3.0 ms, inversion time (TI) = 900.0 ms, and repetition time (TR) = 2300.0 ms.
Image preprocessing
High–spatial-resolution T1-weighted images were processed using standard voxel-based morphometry (VBM) using the Computational Anatomy Tool (CAT 12; http://dbm.neuro.unijena.de/cat12/) in the Statistical Parametric Mapping software (SPM 12; http://www.fil.ion.ucl.ac.uk/spm/). First, all images were checked for artifacts and reoriented to adjust the image origin to the anterior commissure. Second, T1-weighted images were normalized to Montreal Neurological Institute space and segmented into GM, white matter, and cerebrospinal fluid. After obtaining the image quality of each participant and excluding those with a rating below B (three participants with AD were excluded), the segmented GM images were smoothed using an 8-mm full-width at half-maximum Gaussian kernel.
GM atrophy assessment
To investigate group differences in GM volume, we first combined the AD group (n = 140) and the MCI group (n = 50) into a single clinical group and compared it with the HC group (n = 72) using a two-sample t-test. Subsequently, pairwise comparisons were performed between each group: AD vs. HC, MCI vs. HC, and AD vs. MCI. Primary two-sample t-tests were adjusted for age, sex, and total intracranial volume (TIV); in separate factorial models, sex was entered as a factor to test group × sex interactions. Statistical significance was set at the voxel level with p < 0.001, and the results were corrected for multiple comparisons using family-wise error (FWE) correction at p < 0.05.
Spatial correlation between GM atrophy and neurotransmitter maps in AD patients
We used the JuSpace toolbox (version 2.0; https://github.com/juryxy/JuSpace) to assess whether GM atrophy is associated with an atlas-based neurotransmitter system. 20 Using GM images obtained from the VBM analysis as input to the JuSpace toolbox, we selected the following targets: 5-hydroxytryptamine 1a (5HT1a) receptor, 5HT2a receptor, 5HT1b receptor, D1 receptor, D2 receptor, dopamine transporter protein (DAT), fluoro-DOPA (FDOPA), GABAα receptor, μ-opioid receptor (MU), norepinephrine transporter protein (NAT), serotonin transporter protein (SERT), vesicular acetylcholine transporter protein (VAChT), and mGLUR5 to assess serotonin, dopamine, GABA, and glutamatergic systems. The mean GM volume values were extracted for all participants, Spearman correlation coefficients (Fisher z-transform) were calculated between z-score maps of these patients, and exact permutation p-values based on spatial autocorrelation of 1000 permutations were computed to determine whether the distribution of observed Fisher z-transform correlation coefficients was significantly different from zero. All analyses were FDR-corrected. Additionally, as a sensitivity analysis, we repeated the JuSpace GM–transmitter correlations in sex-stratified contrasts; these exploratory results are provided in Supplementary Materials 2.
Model construction and validation
To further distinguish between patients with AD and MCI, we built a predictive model using neurotransmitter-related correlation coefficients as input features. We first partitioned the original dataset (N = 190) into a fixed hold-out test set (n = 38) and a training set (n = 152), stratified by diagnostic group to preserve class balance. Data augmentation was applied only to the training set: for each continuous predictor, we added zero-mean Gaussian noise with a standard deviation equal to 5% of the variable’s standard deviation, generating a noised replica and expanding the training set to 304 observations (original 152 + augmented 152) while leaving the group labels unchanged. 25 On the augmented training data, we performed univariate screening to remove weak predictors, followed by least absolute shrinkage and selection operator regression with cross-validation (LASSO-CV) for multivariate feature selection. Features retained by LASSO-CV were then used to train machine-learning classifiers. Final model performance was assessed on the untouched test set (n = 38).
We compared six classifiers—Extreme Gradient Boosting (XGBoost), Light Gradient Boosting Machine (LightGBM), Random Forest (RF), Support Vector Machine (SVM), K-Nearest Neighbors (KNN), and Decision Tree (DT)—using nested 10-fold CV on the training data. The outer 10-fold provided an unbiased estimate of generalization for each algorithm, while the inner 10-fold performed model-specific hyperparameter tuning; all preprocessing and feature selection steps were executed strictly within folds to avoid information leakage. The primary metric was the area under the receiver operating characteristic (ROC) curve (AUC), with ROC curves plotted for visual assessment. We also reported accuracy (ACC), sensitivity (SEN), specificity (SPE), positive predictive value (PPV), negative predictive value (NPV), F1 score, and Cohen’s kappa (−1 to +1; values >0.75 generally indicate excellent agreement). Based on the outer CV performance, we selected the best-performing model, refit it on the full training set with the tuned hyperparameters, and then evaluated it once on the fixed hold-out test set (n = 38) to assess out-of-sample generalization.
Statistical analysis
The baseline table summarizes the study population by subgroup (AD, MCI, and HC); continuous variables were reported as median (Q1–Q3), and categorical variables as n (%). To assess the association between Fisher z-transformed correlation coefficients (GM–neurotransmitter) and cognitive or depressive symptoms in in the AD and MCI subgroups, Spearman correlation analyses were used, with significant neurotransmitter coefficients and the patient’s clinical scale scores as variables. A two-tailed p-value of <0.05 was considered statistically significant. We additionally tested a co-localization (Fisher z) × sex interaction. Depressive symptoms were assessed using the 15-item Geriatric Depression Scale (GDS-15) and analyzed as a continuous measure; higher scores indicate greater symptom severity. All statistical analyses were performed using R software (version 4.2.3) and Python (version 3.11.4), along with Xsmart software (https://www.xsmartanalysis.com/).
Results
Demographics
A total of 262 participants were included in this study, comprising 140 cases of AD, 50 cases of MCI, and 72 HC. The three groups were similar in terms of sex distribution (males accounted for approximately 50%) and handedness (right-handedness > 90%), reflecting good baseline comparability. The median age was in the early 70s, slightly higher in the AD group, but the interquartile ranges of each group were highly overlapping. The overall years of education were concentrated around 16 years, showing only minor variation. As expected, clinical scales reflected disease progression: from HC to MCI to AD, the Mini-Mental State Examination (MMSE) scores gradually decreased, while GDS scores increased. In summary, the diagnostic groups were overall well matched in terms of demographic characteristics, which would not affect the main conclusions (Table 1).
Characteristics of the study population.
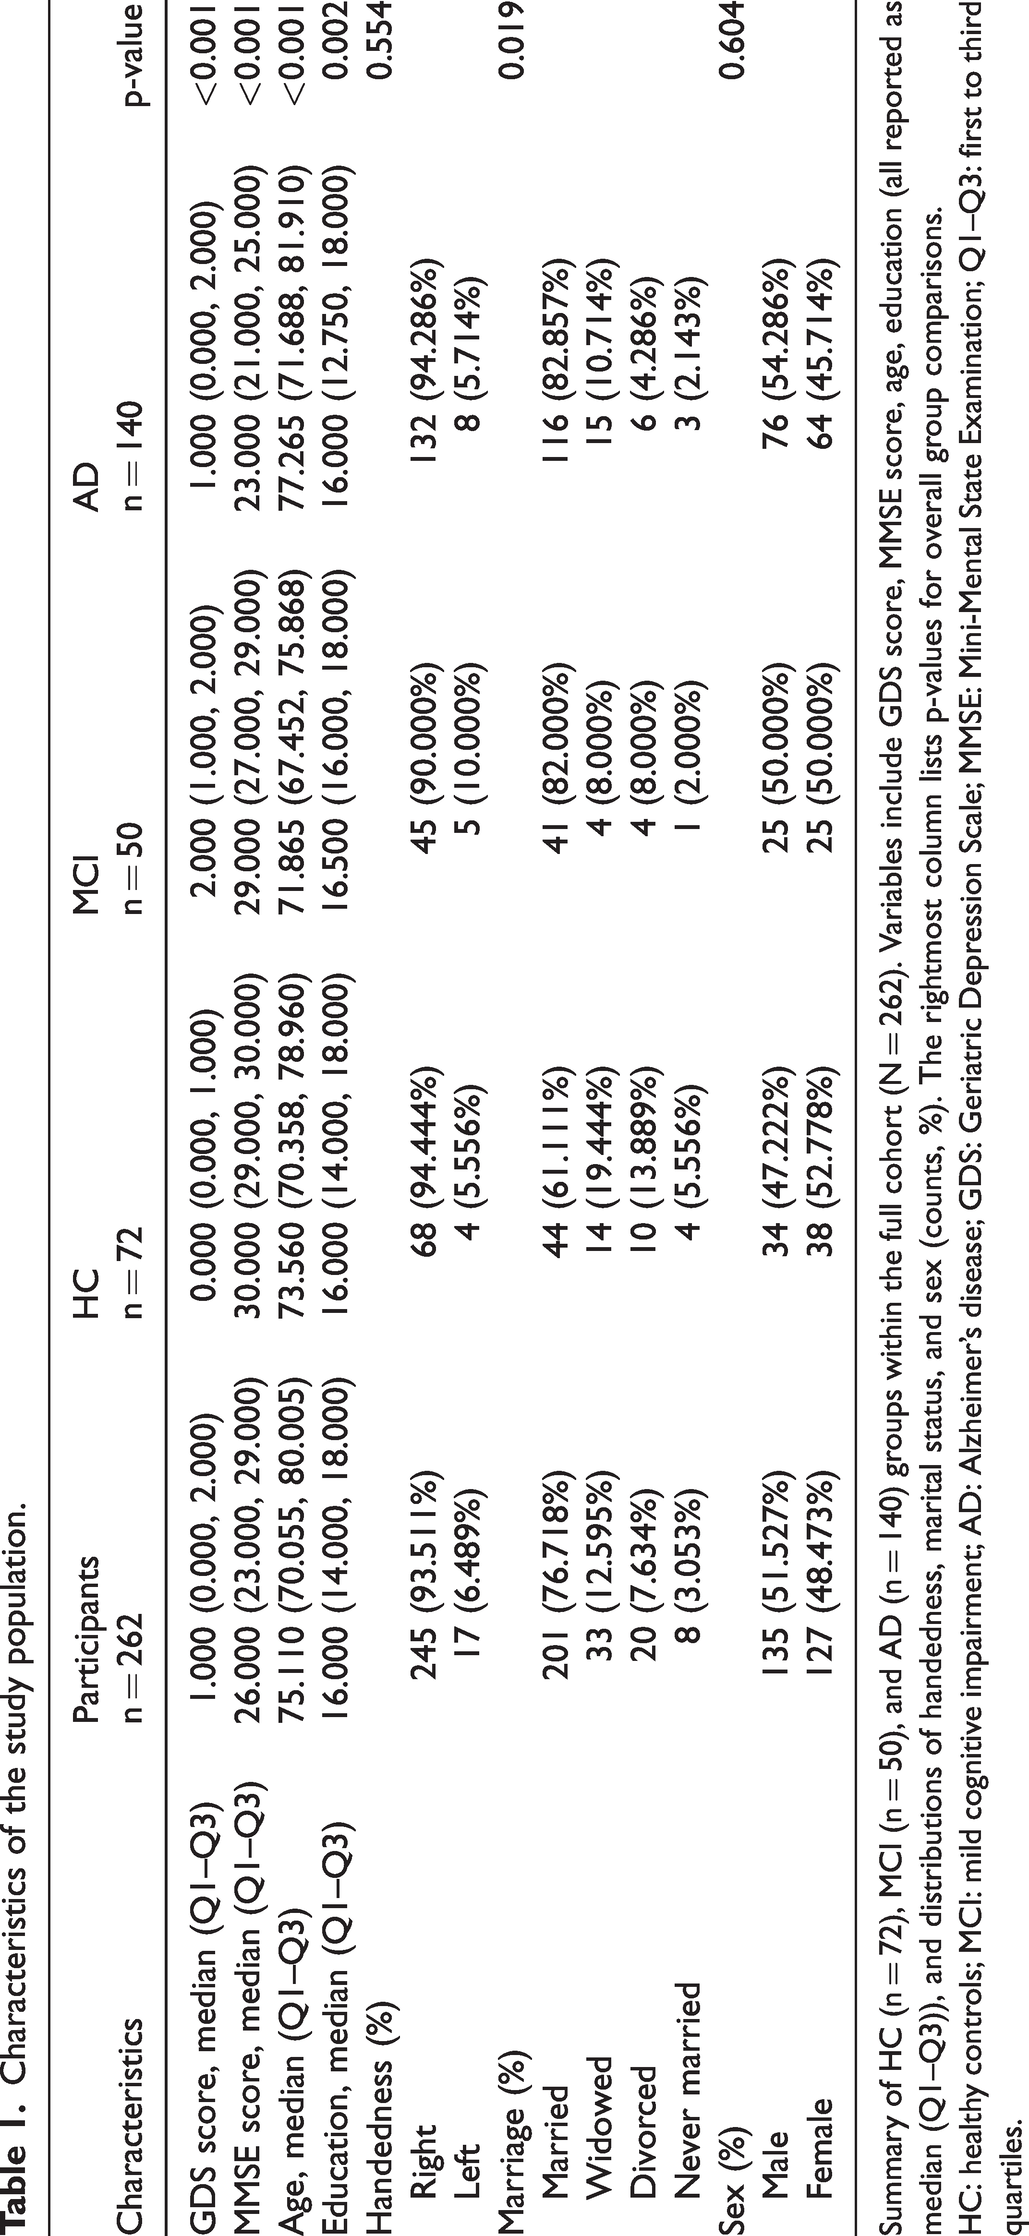
Summary of HC (n = 72), MCI (n = 50), and AD (n = 140) groups within the full cohort (N = 262). Variables include GDS score, MMSE score, age, education (all reported as median (Q1–Q3)), and distributions of handedness, marital status, and sex (counts, %). The rightmost column lists p-values for overall group comparisons.
HC: healthy controls; MCI: mild cognitive impairment; AD: Alzheimer’s disease; GDS: Geriatric Depression Scale; MMSE: Mini-Mental State Examination; Q1–Q3: first to third quartiles.
Common GM atrophy patterns and associated neurotransmitter changes
To identify common structural abnormalities associated with cognitive impairment, we first compared GM volume in the combined patient group (AD+MCI) against HC, adjusting for age, sex, and TIV. Widespread atrophy was observed in the parahippocampal gyrus (PHG), superior temporal gyrus and middle temporal gyrus (STG/MTG), inferior frontal gyrus (IFG), and cingulate gyrus (CG), with the strongest effect observed in the left hippocampus (single cluster; peak T = 12.18). The hippocampal effect size was large (g = 1.68; 95% confidence interval (CI): 1.37–1.99; Cohen’s d = 1.69; partial r = 0.61), indicating a robust reduction in GM volume relative to controls (Figure 2(a), Supplementary Table 1). Importantly, in a 2 × 2 full-factorial VBM model (group × sex; covariates: age, TIV), no group × sex interactions survived FWE correction (for AD+MCI vs. HC: peak-level p-FWE = 0.797, cluster-level p-FWE = 0.866), indicating that these group differences are not moderated by sex. In addition, significant correlation were observed between GM atrophy and the spatial distribution of multiple neurotransmitters, including 5HT1a (ρ = −0.14, FDR-p = 0.006, p-exact < 0.001), 5HT1b (ρ = 0.12, FDR-p = 0.006, p-exact <0.001), DAT (ρ = −0.10, FDR-p = 0.03, p-exact =0.01), FDOPA (ρ = −0.10, FDR-p = 0.01, p-exact = 0.003), NAT (ρ = −0.08, FDR-p = 0.02, p-exact = 0.005), and SERT (ρ = −0.05, FDR-p = 0.002, p-exact = 0.006) (See Table 2 and Figure 3(a) for details).

Voxel-wise analysis of AD and MCI compared with HC. (a) AD+MCI vs. HC. (b) MCI vs. HC. (c) AD vs. HC and (d) AD vs. MCI. No clusters above the predefined statistical threshold are shown. Only clusters that persisted after correction for multiple comparisons (p < 0.05 FWE) are shown. Significant clusters are superimposed on a standardized MRI T1 3D template. MCI: mild cognitive impairment; AD: Alzheimer’s disease; HC: healthy controls; FWE: family-wise error; MRI: magnetic resonance imaging; 3D: three-dimensional.
Neurotransmitter activity map.

Values are Fisher’s z–transformed spatial correlation coefficients between each group-level contrast map (AD/MCI vs. HC, MCI vs. HC, AD vs. HC, AD vs. MCI) and normative PET/SPECT-derived neurotransmitter maps (computed with JuSpace; Spearman-based), together with Benjamini–Hochberg FDR-p across the 13 molecular maps within each contrast. Two-sided tests; statistical significance was defined at FDR p < 0.05.
5HT1a/5HT1b/5HT2a: serotonin 5-HT1a/1b/2a receptors; D1/D2: dopamine D1/D2 receptors; DAT: dopamine transporter; FDOPA: [18F]fluoro-DOPA uptake; GABAα: gamma-aminobutyric acid type-A receptor; MU: μ-opioid receptor; NAT: noradrenaline (norepinephrine) transporter; SERT: serotonin transporter; VAChT: vesicular acetylcholine transporter; mGluR5: metabotropic glutamate receptor 5; AD: Alzheimer’s disease; MCI: mild cognitive impairment; HC: healthy controls; FDR-p: false-discovery rate-adjusted p-value.

Spatial correlation between GM atrophy and neurotransmitter profiles. (a) AD+MCI vs. HC. (b) MCI vs. HC. (c) AD vs. HC and (d) AD vs. MCI. Dots indicate Fisher z-transformed correlation coefficients for each participant and contrast with the respective neurotransmitter map. *Indicates statistically significant spatial correlation. 5HT1a: serotonin receptor subtype 1a; 5HT1b: serotonin subtype 1b; 5HT2a: serotonin subtype 2a; D1: dopamine D1; D2: dopamine D2; DAT: dopamine transporter; FDOPA: fluoro-DOPA; GABAα: gamma-aminobutyric acid type a; MU: mu-opioid receptor; NAT: norepinephrine transporter; SERT: serotonin transporter; VAChT: vesicular acetylcholine transporter; mGluR5: metabotropic glutamate receptor 5; GM: gray matter; AD: Alzheimer’s disease; MCI: mild cognitive impairment; HC: healthy controls.
Stage-specific differences in GM atrophy and neurotransmitter correlations
After establishing common patterns of GM atrophy and neurotransmitter alterations across patient groups, we next examined how these features differ across disease stages.
MCI group and HC group
Compared with HC, patients with MCI showed focal GM atrophy in the right PHG and right MTG, with an additional cluster in the right cerebellar lobule VIII (Figure 2(b); Supplementary Table 1). The strongest effect was observed in the right PHG (peak T = 7.36; partial r = 0.562; Hedges’ g = 1.346, 95% CI: 0.947–1.745). No sex-by-group interaction survived FWE correction (peak-level p-FWE = 0.861, cluster-level p-FWE = 0.998). Atrophic regions were significantly correlated with the distribution of 5HT1b (ρ = 0.17, FDR-p = 0.003, p-exact <0.001), 5HT2a (ρ = 0.12, FDR-p = 0.005, p-exact = 0.002), DAT (ρ = −0.18, FDR-p = 0.003, p-exact < 0.001), FDOPA (ρ = −0.16, FDR-p = 0.003, p-exact < 0.001), GABAα (ρ = 0.11, FDR-p = 0.003, p-exact <0.001), MU (ρ = −0.14, FDR-p = 0.009, p-exact = 0.004), SERT (ρ = −0.14, FDR-p = 0.01, p-exact = 0.006), VAChT (ρ = −0.11, FDR-p = 0.02, p-exact = 0.01), and mGluR5 (ρ = 0.06, FDR-p = 0.04, p-exact = 0.03) (Table 2 and Figure 3(b)).
AD group and HC group
Patients with AD showed widespread GM atrophy, primarily involving the STG, MTG, PHG, and fusiform gyrus, with the left hippocampus being the most significantly atrophic area (peak T = 14.25; partial r = 0.701; Hedges’ g = 2.06; 95% CI: 1.714–2.406) (Figure 2(c), Supplementary Table 2). In the corresponding factorial model, the sex-by-group interaction was not significant after FWE correction (peak-level p-FWE = 0.214; cluster-level p-FWE = 0.178). Areas of GM atrophy were significantly correlated with the spatial distribution of 5HT1a (ρ = −0.17, FDR-p = 0.004, p-exact <0.001), 5HT1b (ρ = 0.11, FDR-p = 0.004, p-exact < 0.001), NAT (ρ = −0.11, FDR-p = 0.004, p-exact < 0.001), and SERT (ρ = −0.09, FDR-p = 0.05, p-exact = 0.01) (Table 2 and Figure 3(c)).
AD group and MCI group
Further comparison revealed AD-specific GM atrophy in regions including the right MTG, right PHG, and left mid-cingulate cortex (MCC), with the right PHG being the most significantly atrophic area (peak T = 6.37; partial r = 0.424; Hedges’ g = 1.045; 95% CI: 0.706–1.385) (Figure 2(d), Supplementary Table 3). In the corresponding factorial model, the sex-by-group interaction did not reach significance under FWE correction (peak-level p-FWE = 0.258; cluster-level p-FWE = 0.174). Areas of atrophy were significantly associated with the spatial distribution of 5HT1a (ρ = −0.10, FDR-p = 0.02, p-exact = 0.005), 5HT2a (ρ = −0.12, FDR-p = 0.004, p-exact < 0.001), D2 receptor (ρ = −0.08, FDR-p = 0.04, p-exact = 0.02), GABAα (ρ = −0.08, FDR-p = 0.004, p-exact < 0.001), MU (ρ = 0.12, FDR-p = 0.03, p-exact = 0.01), and NAT (ρ = −0.11, FDR-p = 0.004, p-exact < 0.001) (Table 2 and Figure 3(d)).
Neurotransmitter alterations in AD and MCI and clinical symptoms
With clear evidence of stage-specific neurotransmitter abnormalities, we investigated their associations with clinical symptoms. In the MCI subgroup, GM–mGluR5 (ρ = −0.44, p = 0.001) and GM–MU (ρ = −0.44, p = 0.001) co-localization intensities were both negatively associated with GDS scores, such that greater depression severity corresponded to lower co-localization (Supplementary Figure 1, Supplementary Table 2). Formal sex-interaction tests did not indicate effect modification in MCI (co-localization (Fisher-z) × sex: mGluR5 p = 0.36; MU p = 0.68). Notably, the study had 80% power to detect |ρ| ≥ 0.39 in MCI, confirming adequate sensitivity for the observed effects. In contrast, no significant associations emerged in the AD subgroup; the corresponding minimum detectable effect size (MDES) was |ρ| ≈ 0.23, and the observed correlations did not meet this threshold (Supplementary Table 3).
Performance of the model
To assess the biomarker potential of neurotransmitter signatures, we built classifiers using neurotransmitter-related correlation features. Feature selection combined univariate screening with LASSO on the training set, yielding a compact predictor panel: 5HT1a, 5HT1b, D2, DAT, FDOPA, and SERT (Supplementary Figures 2 and 3).
Across six algorithms evaluated with nested 10-fold CV, LightGBM achieved the highest CV discrimination on the training data (Figure 4(a) and (b)). However, LightGBM exhibited weaker performance on the fixed held-out test set (Supplementary Figure 4). In contrast, RF—ranked second under CV—demonstrated superior generalization and was therefore selected as the primary model for out-of-sample evaluation (Figure 4(c), Table 3). Model interpretability using Shapley additive explanations (SHAP) analysis corroborated the biological relevance of the selected neurotransmitters, quantifying both the direction and magnitude of their contributions to the RF decision function (Figure 5).

ROC performance of six classifiers with nested CV and held-out testing. (a,b) After an 80/20 stratified split, we performed 10-fold CV on the training/internal-validation data; ROC curves are shown for six algorithms: XGBoost, LightGBM, RF, SVM, KNN, and DT and (c) external test set ROC curve, illustrated with the best-performing model (RF). ROC: receiver operating characteristic; RF: Random Forest; XGBoost: Extreme Gradient Boosting; LightGBM: Light Gradient Boosting Machine; SVM: Support Vector Machine; KNN: K-Nearest Neighbors; DT: Decision Tree; CV: cross-validation.
Evaluation metrics of the models constructed by each method.
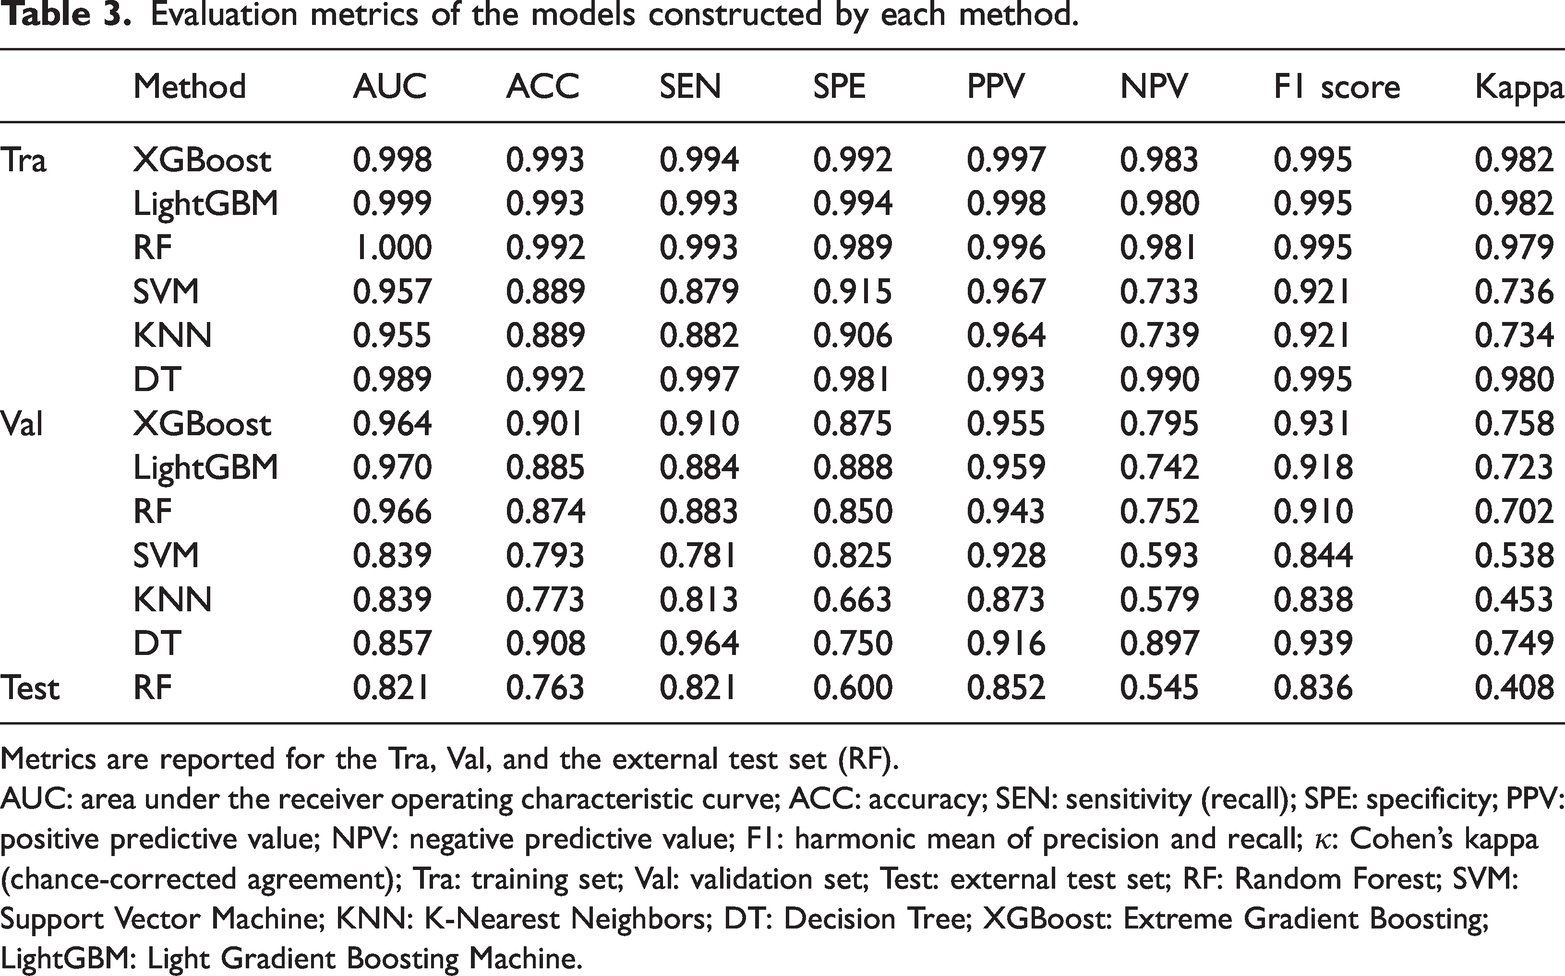
Metrics are reported for the Tra, Val, and the external test set (RF).
AUC: area under the receiver operating characteristic curve; ACC: accuracy; SEN: sensitivity (recall); SPE: specificity; PPV: positive predictive value; NPV: negative predictive value; F1: harmonic mean of precision and recall; κ: Cohen’s kappa (chance-corrected agreement); Tra: training set; Val: validation set; Test: external test set; RF: Random Forest; SVM: Support Vector Machine; KNN: K-Nearest Neighbors; DT: Decision Tree; XGBoost: Extreme Gradient Boosting; LightGBM: Light Gradient Boosting Machine.
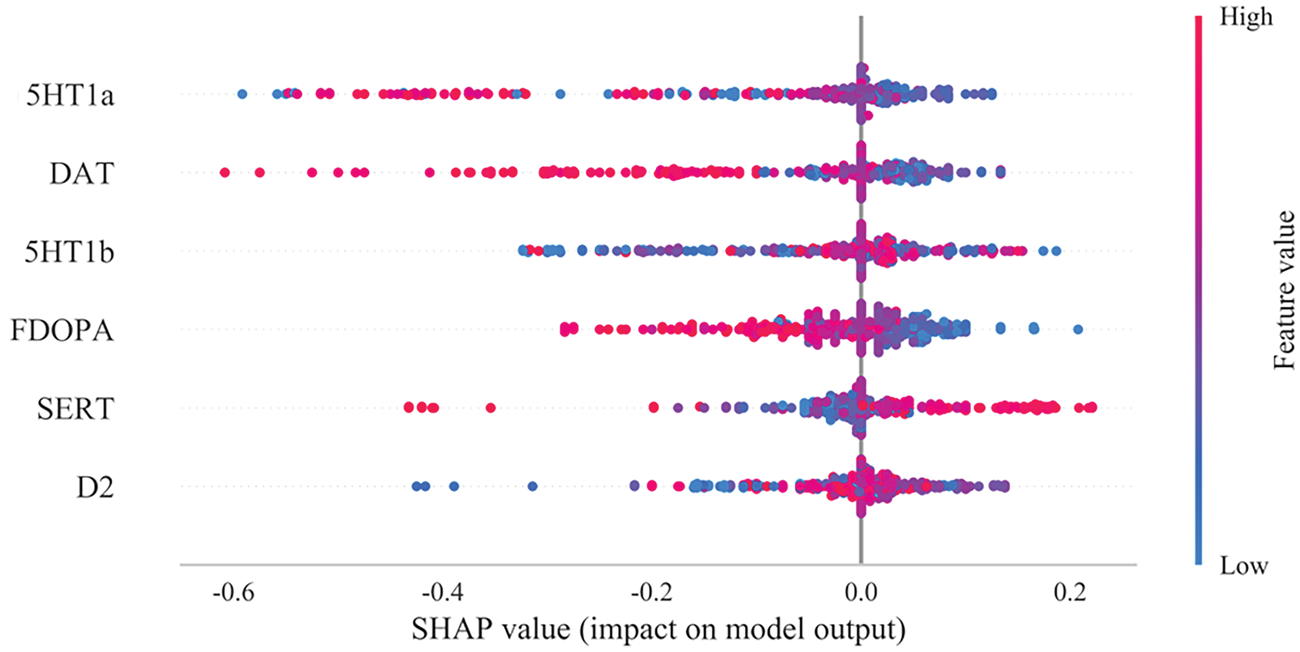
Summary plot of SHAP values for the model constructed via the RF algorithm. The horizontal position “SHAP value” indicates whether the impact of the value is associated with a higher or lower prediction, and the color of each SHAP value point indicates whether the observed value is higher (red) or lower (blue). The vertical coordinates show the importance of the features, sorted by the importance of the variables in a descending order, with the upper variables being more important to the model. SHAP: Shapley additive explanations; RF: Random Forest.
Discussion
This study systematically explored GM atrophy characteristics in AD and MCI patients, their relationship with the spatial distribution of neurotransmitters, and the potential utility of neurotransmitter features in disease classification. The results showed that both AD and MCI patients exhibited significant GM atrophy, which was more extensive in AD. Beyond these structural patterns, GM loss showed coherent spatial correspondence with transmitter architectures: atrophic regions preferentially mapped onto monoaminergic systems (5HT1a/1b/2a, DAT, FDOPA, SERT, NAT) and, to a lesser extent, inhibitory (GABAα), cholinergic (VAChT), dopaminergic (D2), and glutamatergic (mGluR5) topographies. Notably, within MCI, co-localization with mGluR5 and MU–related markers was associated with depressive burden, whereas such symptom coupling was absent in AD. The RF model constructed using neurotransmitter features performed well, demonstrating potential utility for classifying AD and MCI. In summary, this study highlights the association between brain structure and neurochemical alterations and proposes a novel strategy for disease classification.
This study systematically explored the structural changes between MCI and AD patients and cognitively HC using GM volume analysis. Consistent with previous studies, GM atrophy in MCI patients was mainly concentrated in the temporal lobe, particularly the PHG and MTG.26,27 The PHG plays a key role in episodic memory, visuospatial processing, and associative memory,28–34 while the MTG is involved in language processing and emotional memory.35,36 These characteristic atrophies suggest that temporal-lobe structure changes may underlie cognitive symptoms in MCI.
Compared with HC, GM atrophy in AD patients was more extensive and severe, involving the STG, MTG, PHG, and fusiform gyrus. These regions are closely associated with language comprehension, semantic memory, episodic memory, and high-level visual processing. Accordingly, language impairment, episodic memory deficits, and face recognition difficulties observed in AD patients may be linked to structural degeneration in the medial temporal lobe (PHG), lateral temporal cortex (STG and MTG), and fusiform gyrus.37–41
In the comparison between AD and MCI patients, we found that AD patients showed additional GM atrophy relative to MCI in the right MTG, right PHG, and left MCC. This difference reflects the gradual extension of structural damage as the disease progresses from MCI to AD, further reinforcing the central role of the medial temporal lobe and limbic system in AD pathology.42–44
We analyzed neurotransmitter distribution within atrophic regions based on the hypothesis that the neurochemical environment of a brain region may influence its spatial vulnerability to structural degeneration or, at minimum, reflect the spatial characteristics of its degenerative lesions.20,45 Previous studies have shown that neurotransmitters such as dopamine and serotonin are functionally diverse across brain regions and can influence memory, emotion, and executive function through different neural pathways. 46 Therefore, the same neurotransmitter may exhibit distinct functional effects in different regions, and presence of multiple neurotransmitter systems within the same atrophic region may reflect superimposed abnormalities of multiple signaling pathways.
In this study, GM atrophy showed a reproducible spatial correspondence with several transmitter architectures after autocorrelation-preserving permutations and FDR control—most prominently with serotonergic and catecholaminergic maps (5HT1a/5HT1b, SERT, DAT/FDOPA, and NAT). This pattern suggests that disease-related structural vulnerability tends to align with specific neuromodulatory terrains rather than being randomly distributed across the cortex. As with all JuSpace analyses, these spatial correspondences index topographic overlap rather than causality, providing a biologically grounded context for hypothesis-driven mechanistic and longitudinal studies.
In the MCI group, GM atrophy showed significant spatial correspondence with serotonergic (5HT1b/5HT2a/SERT), dopaminergic (DAT/FDOPA/D2), noradrenergic (NAT), GABAergic (GABAα), cholinergic (VAChT), and glutamatergic (mGluR5) architectures after autocorrelation-preserving permutations and FDR control. These findings indicate that early-stage vulnerability is shaped by multiple neuromodulatory terrains rather than a single pathway. Among the aligned systems, both mGluR5 and MU are noteworthy for their clinical relevance in MCI, where GM–mGluR5 and GM–MU co-localization intensities were inversely associated with depressive burden, suggesting symptom-relevant contributions of glutamatergic and opioid-modulated affective circuits at this stage.
Placing these results in context, our mGluR5 finding converges with preclinical evidence that downregulation or dysfunction of mGluR5 in AD-model circuitry is associated with depressive-like phenotypes and synaptic compromise 47 and with human imaging and clinical literature implicating glutamatergic dysregulation in mood symptoms during prodromal cognitive impairment. 48 The MU association extends this picture: the μ-opioid system is a core regulator of hedonic tone, stress responsivity, and affective salience,49,50 and emerging clinical and PET studies in mood disorders indicate altered μ-opioid receptor availability and function in depressive states,51,52 providing a plausible mechanistic link to our MCI-specific symptom associations . Notably, the absence of parallel couplings in AD suggests that, as neurodegeneration generalizes, broad neuromodulatory failure and structural noise may obscure these more selective transmitter–symptom relationships, consistent with stage-specific pathophysiology.
Future studies should combine molecular imaging methods, such as PET, to directly evaluate changes in the expression levels of mGluR5 and MU receptors at the individual level and further explore their dynamic association with emotional symptom changes through longitudinal follow-up, to confirm the potential of mGluR5 and MU as intervention targets in early AD.
This study further constructed and validated multiple machine-learning models based on neurotransmitter spatial distribution features to distinguish AD from MCI patients. Among the six models tested, the RF model demonstrated the best performance. Notably, SHAP analysis revealed that 5HT1a was the most significant feature contributing to the model’s predictions. Our results indicate that 5HT1a is a key discriminative feature, plausibly via dual pathways involving stress-axis regulation and synaptic plasticity. As a G-protein-coupled receptor, 5HT1a is expressed in the hippocampal CA1/CA3 regions and amygdala, where it buffers excitatory drive and stabilizes long-term potentiation/long-term depression,53–55 and, as a raphe autoreceptor, it sets baseline serotonin tone56,57 and tunes hypothalamic–pituitary–adrenal (HPA) axis responsivity. 58 Within the chronic stress and neuroinflammation milieu of AD, 59 downregulated 5HT1a signaling weakens glutamatergic inhibition, 60 accelerating dendritic spine loss and plasticity failure that drive networks from MCI toward AD. 61 In our SHAP analysis, 5HT1a exerted a stable, value-dependent influence on model outputs, implying that its spatial distribution aligned with GM atrophy provides discriminative information at a stage when symptoms are modest but circuits remain plastic. 62 This view converges with animal data showing that 5HT1a perturbation impairs hippocampal plasticity and learning63,64 and with human imaging studies reporting reduced 5HT1a binding in temporal–limbic regions alongside affective symptoms in prodromal and clinical AD,65,66 strengthening the case for 5HT1a as an early neuromodulatory biomarker and candidate therapeutic target. The superior performance of the RF model in our study further validates the utility of machine learning for analyzing complex neuroimaging and neurotransmitter data in AD diagnosis. SHAP analysis provides crucial insights into feature importance, highlighting the specific contribution of 5HT1a to the model’s predictions.
In recent years, significant advancements have been made in understanding the genetic underpinnings and pathogenesis of AD, particularly regarding neurotransmitter systems such as the serotonergic, dopaminergic, and glutamatergic systems. However, most studies have focused on individual neurotransmitters or single systems, and analyses integrating multiple neurotransmitters remain limited. JuSpace, a toolbox validated in conditions such as Parkinson’s disease, 20 multiple sclerosis, 67 frontotemporal dementia, 21 and Rasmussen’s encephalitis, 68 allows for cross-modal assessment of neuroimaging and neurotransmitter data. This tool can enhance our understanding of neurotransmitter alterations in AD and their relationship with neuropsychological states, potentially informing personalized treatment approaches. Repairing neurotransmitter dysfunction, whether through solo or combined therapies, may improve cognitive functions and quality of life in AD, enriching our comprehension of disease mechanisms. Predictive tools are widely used in medicine to forecast clinical diagnoses and outcomes. Some have been employed to anticipate AD progression,69,70 yet no existing tool uses correlations among multiple neurotransmitters to predict whether cognitive decline reflects AD or MCI. In this study, we developed an interpretable machine-learning model to improve transparency and reliability by facilitating user comprehension of the model’s decision-making process.
This research has several limitations. First, because JuSpace is based on neurochemical spectra derived from imaging in healthy individuals, our findings—suggesting a possible link with GM atrophy areas—may reflect neurotransmitter distributions that are physiologically higher or lower in healthy tissue. The causal relationship between GM atrophy and neurotransmitter distribution anomalies warrants further investigation. Second, due to the cross-sectional design, we cannot examine long-term trajectories of neurotransmitter changes and local GM atrophy, which remain crucial areas for future research. Longitudinal studies in newly diagnosed AD patients are needed. Third, although this study employed internal validation by dividing the dataset into training and validation sets, it lacks external cohort studies to verify the predictive tool’s performance. Fourth, while the sample size in this study is moderate and comparable to similar neuroimaging research using JuSpace and multimodal data, larger and more diverse cohorts are required to validate the generalizability of these findings. Finally, the feature extraction process is relatively complex, encompassing structural MR acquisition, VBM analysis under SPM, JuSpace co-localization processing, and significant transmitter screening, which entails substantial resource investment.
Although this multi-stage process is not yet widely used in routine clinical practice, its complexity is grounded in a clear scientific rationale. Rather than relying on generic imaging features or opaque data-driven embeddings, our method leverages spatial patterns of neurochemical organization that are biologically interpretable and pathophysiologically relevant to AD and MCI. This mechanism-driven feature construction approach not only enhances model interpretability but also helps improve clinicians’ trust in its predictions, aligning with the current trend in artificial intelligence in medicine toward shifting from performance-oriented to interpretability-oriented methods. Importantly, the complexity of this process is not insurmountable. Standardized processing tools such as CAT12 and SPM are widely used in neuroimaging and support batch scripting, and JuSpace is designed to integrate seamlessly with these tools. Consequently, the entire workflow has the potential for modular and automated processing, which may substantially lower the threshold for clinical and research applications in the future. In summary, although the current feature extraction process is technically complex, its theoretical basis, explanatory power, and future scalability collectively support its application value within a diagnostic modeling framework.
Conclusion
GM atrophy in AD and MCI demonstrates spatial correspondence with multiple neurotransmitter system maps, and neurotransmitter-based features provide discriminative information for distinguishing AD from MCI within the ADNI cohort. These findings underscore the role of neurotransmitter alterations in AD pathophysiology and suggest that related neuroimaging markers hold potential for improving early diagnosis and disease staging.
Footnotes
Acknowledgments
We gratefully acknowledge the Alzheimer’s Disease Neuroimaging Initiative (ADNI) for providing access to data via the ADNI database (![]() ). Data collection and sharing for ADNI are funded by the National Institute on Aging (NIH Grant U19AG024904); in prior phases, ADNI has also received support from the National Institute of Biomedical Imaging and Bioengineering, the Canadian Institutes of Health Research, and multiple industry and non-profit partners. The investigators within ADNI contributed to the design and implementation of ADNI and/or provided data but did not participate in the analysis or writing of this report. A complete listing of ADNI investigators is available on the ADNI website. The authors also thank Extreme Smart Analysis for statistical consultation, data processing support, and figure preparation.
). Data collection and sharing for ADNI are funded by the National Institute on Aging (NIH Grant U19AG024904); in prior phases, ADNI has also received support from the National Institute of Biomedical Imaging and Bioengineering, the Canadian Institutes of Health Research, and multiple industry and non-profit partners. The investigators within ADNI contributed to the design and implementation of ADNI and/or provided data but did not participate in the analysis or writing of this report. A complete listing of ADNI investigators is available on the ADNI website. The authors also thank Extreme Smart Analysis for statistical consultation, data processing support, and figure preparation.
Author contributions (CRediT)
Jiaxi Zhao (†): Conceptualization, Methodology, Formal analysis, Visualization, Writing–original draft, Writing–review & editing. Zhichuang Qu (†): Conceptualization, Methodology, Data curation, Software, Validation, Writing–original draft, Writing–review & editing. Zheng Li: Investigation, Resources, Data curation, Validation. Lanling Zhou: Investigation, Resources, Data curation, Visualization. Yue Hu: Investigation, Data curation. Sixun Yu (*): Supervision, Conceptualization, Methodology, Project administration, Funding acquisition. Xin Chen (*): Supervision, Methodology, Project administration, Funding acquisition, Writing–review & editing. Haifeng Shu (*) (Lead corresponding author): Supervision, Conceptualization, Project administration, Funding acquisition, Writing–review & editing.
All authors read and approved the final manuscript and agree to be accountable for all aspects of the work.
Consent to participate
Not applicable.
Consent for publication
Not applicable.
Clinical trial number
Not applicable.
Data availability
The data used in this study are publicly available from the Alzheimer’s Disease Neuroimaging Initiative (ADNI) repository (![]() ), subject to registration and the ADNI Data Use Agreement. Interested researchers may access the imaging, clinical, cognitive, and biomarker data by submitting a Data Use Application through the LONI Image and Data Archive (IDA).
), subject to registration and the ADNI Data Use Agreement. Interested researchers may access the imaging, clinical, cognitive, and biomarker data by submitting a Data Use Application through the LONI Image and Data Archive (IDA).
Declaration of conflicting interest
Not applicable.
Declaration of generative artificial intelligence and artificial intelligence-assisted technologies
During the preparation of this work, the authors used ChatGPT-4o to improve language. After using this tool, the authors reviewed and edited the content as needed and take full responsibility for the content of the publication.
Ethics statement
This study was conducted in accordance with the principles of the Declaration of Helsinki. The data used in this study were obtained from the Alzheimer’s Disease Neuroimaging Initiative (ADNI) database (![]() ). All ADNI participants or their authorized representatives provided written informed consent at the time of enrollment, and study protocols were approved by the Institutional Review Board (IRB) at each participating site.
). All ADNI participants or their authorized representatives provided written informed consent at the time of enrollment, and study protocols were approved by the Institutional Review Board (IRB) at each participating site.
The ADNI study was approved by the Ethics Committee of the University of Southern California and other participating centers. A full list of participating sites and their IRBs is available on the ADNI website.
Funding
This work was supported by the Joint Key Project of the General Hospital of the Western Theater Command of China (2019LH01), the Technology Innovation Talent Project of the Sichuan Provincial Department of Science and Technology (2022JDRC0041), the Medical Innovation Project (21WQ040), and the High-Level Scientific and Technological Innovation Talent Project (No number available).
Supplemental material
Supplemental material for this article is available online.
References
Supplementary Material
Please find the following supplemental material available below.
For Open Access articles published under a Creative Commons License, all supplemental material carries the same license as the article it is associated with.
For non-Open Access articles published, all supplemental material carries a non-exclusive license, and permission requests for re-use of supplemental material or any part of supplemental material shall be sent directly to the copyright owner as specified in the copyright notice associated with the article.