
Abstract
Sleep disturbances may promote the development and advancement of Alzheimer’s disease. Our purpose was to determine if sleep disturbances were associated with earlier mortality while accounting for cognition. The National Alzheimer’s Coordinating Center database was used to evaluate mortality risk conferred by sleep, and the Montreal Cognitive Assessment score determined cognitive status. Demographics, sleep disturbances, cognitive status, and comorbid/other neuropsychiatric conditions were examined as predictors of survival time via Cox regression. The sample (N = 31,110) had a median age [interquartile range] of 72 [66, 79] years, MoCA score of 23 [16, 26], and survival time of 106.0 months [104.0,108.0]; 10,278 (33%) died during follow-up; 21% (n = 6461) experienced sleep disturbances. Sleep disturbances impacted survival time depending on cognition, with the greatest effect in transition from normal to cognitive impairment (P < .001). Findings support that sleep disturbances negatively impact survival time, and the impact of sleep disturbances on survival time is interrelated with cognition.
Significance Statement
• Sleep disturbances differentially impacted survival time depending on cognitive status. • Findings support that sleep disturbances may be a critical target for interventions to delay cognitive impairment and death.
Introduction
Insomnia and poor sleep quality are associated with the development and progression of Alzheimer’s disease (AD) and related dementias in older adults, and, in turn, dementia affects aspects of sleep.1-5 Proposed mechanisms include reduced clearance of beta-amyloid peptide levels in the brain6-9 and circadian rhythm disturbances that accelerate neurodegeneration.6,8,11 In addition to known mechanistic considerations, poor sleep is associated with earlier conversion to dementia in at-risk adults 10 and worse disease prognosis in older adults diagnosed with dementia. 11 This is concerning as insomnia symptom prevalence in older adults with cognitive disorders is as high as 50% 12 compared to 25%–35% of the general older adult population.13,14
While poor sleep and cognitive decline appear to be bilateral risk factors for each other, the potential influence of disturbed sleep on the trajectory of cognitive decline and mortality is unclear and may depend on the definition and detection of “disturbed sleep.” In an earlier, related study, we found that insomnia, particularly, is unreliably recognized in participants with cognitive impairment. Sleep disturbances, which comprise elements of insomnia, fragmented sleep, and daytime sleepiness, were more likely to be correlated with cognitive measures such as the Montreal Cognitive Assessment (MoCA) and biomarkers of hippocampal volumetry and cerebral spinal fluid phosphorylated tau:beta amyloid ratios. 15
The present study builds on earlier work with the prospective National Alzheimer’s Coordinating Center (NACC) Uniform Data Set (UDS), which showed that the cross-sectional prevalence of sleep disturbances increased with worsening cognition. 16 Previous literature also supports the negative correlation between sleep and mortality, wherein short sleep duration,17,18 long sleep duration, 17 and the presence of sleep disturbances 19 are associated with a greater risk of death. Considering sleep disturbances as a symptomatic risk for cognitive decline and the known relationship between sleep and mortality, we sought to understand the complex relationship between sleep disturbances, cognition, and mortality. The purpose of this study was to determine if sleep disturbances were associated with earlier mortality while accounting for cognitive status and other factors associated with dementia.
Methods
Study Setting and Participants
De-identified data from the NACC UDS were included in these analyses.20-23 Thirty-seven Alzheimer’s Disease Center (ADC) sites contribute data to the NACC UDS. Each ADC is independently funded through the National Institutes of Health, National Institute of Aging, and enrolls participants based on site-specific eligibility criteria and protocols. Institutional Review Board approvals are maintained, and written informed consent is obtained at individual ADCs. At voluntary annual visits, clinicians and ADC staff collect data from participants and co-participants (e.g., family members). As of September 2023, the UDS sample was comprised of slightly more women (>52%) between 65–84 years of age (>62%) and 13-16 years of education (>39%). The majority of the sample identified as White (>75%) and non-Hispanic (>86%) adults who attended at least two ADC visits (>60%). 24 Data from annual visits included in this analysis were conducted between September 2005 and December 2021.
Measures
The primary variable, sleep disturbances, was based on co-participants’ responses during the ADC visit #1 interview by a clinician asking, “Does the participant awaken you during the night, rise too early in the morning, or take excessive naps during the day?” This measure is part of the Neuropsychiatric Inventory- Questionnaire (NPI-Q) and has been validated previously in cross-sectional analyses, demonstrating a significant association between the severity of cognitive impairment and biomarkers associated with AD in the cross-sectional analysis. 25
The Montreal Cognitive Assessment (MoCA score) 26 indicated the severity of cognitive impairment at participant’s ADC visit #1. Conversion across cognitive test scoring systems used in this database have been described earlier [15,22]. MoCA cut-off scores provided stratification levels for the statistical models (dementia <20, 20 ≤ MCI ≤25, and normal >25). 27 To account for the variety of neuropsychiatric symptoms that may accompany sleep disturbances, we defined NPI weight as the adjusted sum of other symptoms of the NPI-Q excluding sleep disturbances. 15 Other variables, all determined at visit #1, included age, sex, race (dichotomized to white and non-white), education (total years), hypertension (absent or present), and diabetes mellitus (DM, absent or present).[15]. The time variable, duration, was the time in months between visit #1 and date of death (last visit = survivor censor value). The specific date coding procedure was specified in earlier work. 15
Statistical Analyses
Univariate survival analyses
As descriptive analyses, stratified Kaplan Meier survival curves were generated for each predictor variable, i.e., sleep disturbances, MoCA score, NPIweight, age, sex, race, education, hypertension, and DM. Chi-square log-rank tests were conducted per predictor variable to test if the survival curve was stratum independent, thus indicating lack of predictor variable vs survival time association. Rejection of the null hypothesis (i.e., no predictor variable vs survival time association) was based on the conventional .05 significance level. Participants with incomplete data were excluded from the univariate survival analysis so that the results from the univariate and multivariate survival analyses correspond to the same set of participants.
Multivariate survival analyses
Cox multiple proportional hazard piecewise regression was conducted to identify among an a priori selected set of predictor variables: sleep disturbances (yes, no), MoCA score, NPIweight, age at visit #1 (decade of life defined categories), sex (female, male), race (white, non-white), education at visit #1 (years), hypertension at visit #1 (yes, no), and DM at visit #1 (yes, no). In an effort to discern at a more granular level the interaction between sleep disturbances and participant cognition with respect to the instantaneous risk for death, a piecewise regression approach was undertaken, in which the impact of sleep disturbances on trajectory of the instantaneous death rate was free to change depending on MoCA score interval, where the MoCA score intervals were [0, 19], [20, 25], and [26, 30], represent MoCA scores falling in the “dementia,” “MCI,” and cognitively “normal” range of cognition, respectively. It should be noted that treating the MoCA score as a continuous scaled piecewise predictor variable aligned more favorably with the Cox proportional hazard assumption than treating the MoCA score as an interval scaled categorical variable. Additionally, it should be noted that a regression model term for sex by education interaction was required in order for to satisfy the Cox proportional hazard assumption with respect to the variable “sex.” Hypothesis testing was undertaken using the Wald Chi-square statistic as the null hypothesis test pivotal quantity. An α = .05 significance level used as the criterion to identify unique associations between the instantaneous death rate and the predictor variables. As a goodness of model fit test, the Therneau and Grambsh proportional hazards chi-square test 15 was conducted per Cox regression model term (including piecewise terms and interaction terms) to test the Cox model proportional hazards assumption. Participants with incomplete data were excluded from the multivariate survival analysis. A detailed Cox multiple proportional hazard piecewise regression model specification is provided in Supplement equation (1).
Missing data
Among the 34,236 participants in the NACC UDS who had non-missing survival time/follow-up time data and non-missing death status/censoring information, 3136 (9.2%) participants were excluded from the univariate and multivariate survival analyses due to incomplete predictor variable information (see Supplement Table S1). NPIweight was the predictor variable with the most missing data entries (n = 1,844, 5.4%), followed by MoCA score (n = 1,343, 3.9%).
Sensitivity analysis
The potential impact of missing-data-induced sample selection bias was examined by conducting a set of descriptive sensitivity analyses in which for each predictor variable, the predictor variable empirical distribution derived from the predictor data of all participants with complete predictor variable information (n = 31,100) was compared to the predictor variable empirical distribution derived from the predictor data of all participants with available predictor variable information.
Results
Baseline Characteristics
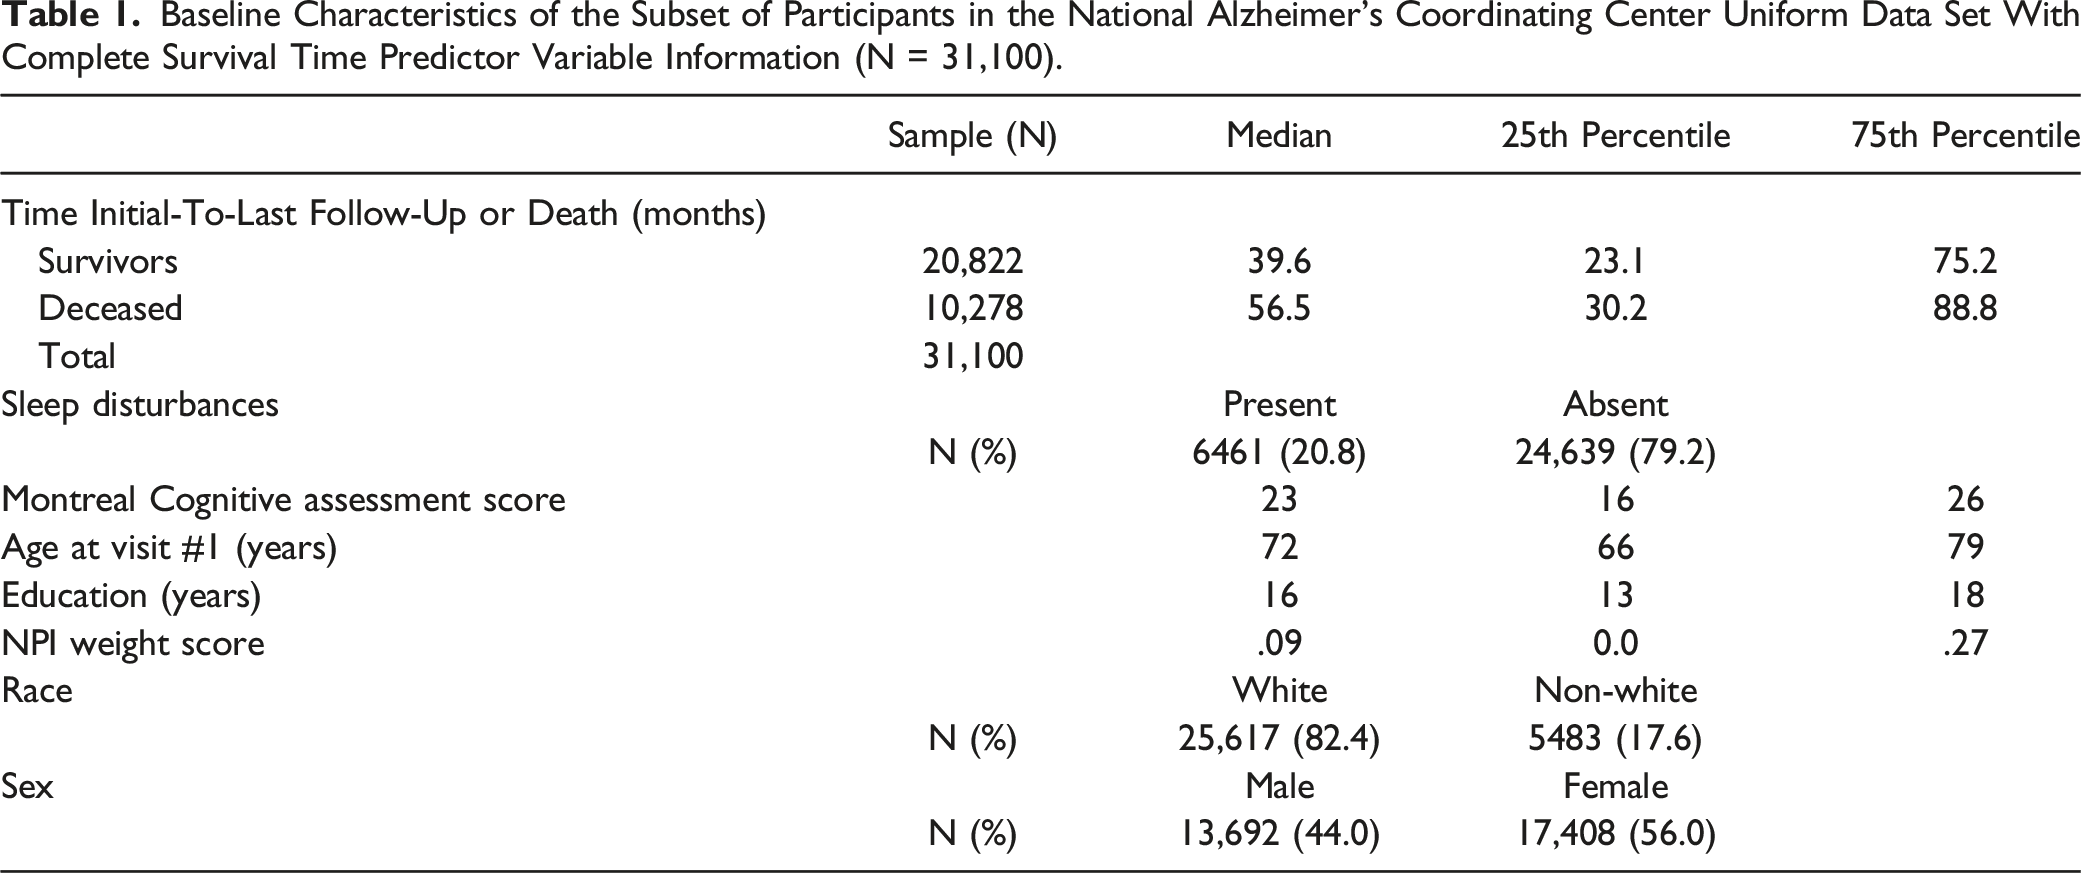
Baseline Characteristics of the Subset of Participants in the National Alzheimer’s Coordinating Center Uniform Data Set With Complete Survival Time Predictor Variable Information (N = 31,100).
Survival Analysis
Univariate survival analyses
Figure 1 displays the stratified Kaplan Meier survival curves related to sleep disturbances (A), MoCA score (B), NPIweight (C), age at visit #1(D), sex (E), race (F), education (G), hypertension (H), and DM (I). In the univariate setting, sleep disturbances stratification (P < .001), MoCA score stratification (P < .001), NPIweight stratification (P < .001), age stratification (P < .001), sex stratification (P < .001), race stratification (P < .001), education stratification (P < .001), hypertension stratification (P < .001), and DM stratification (P < .001) was associated with survival time. Kaplan-Meier curves for the predictors of survival time. Black lines indicate the reference stratification category.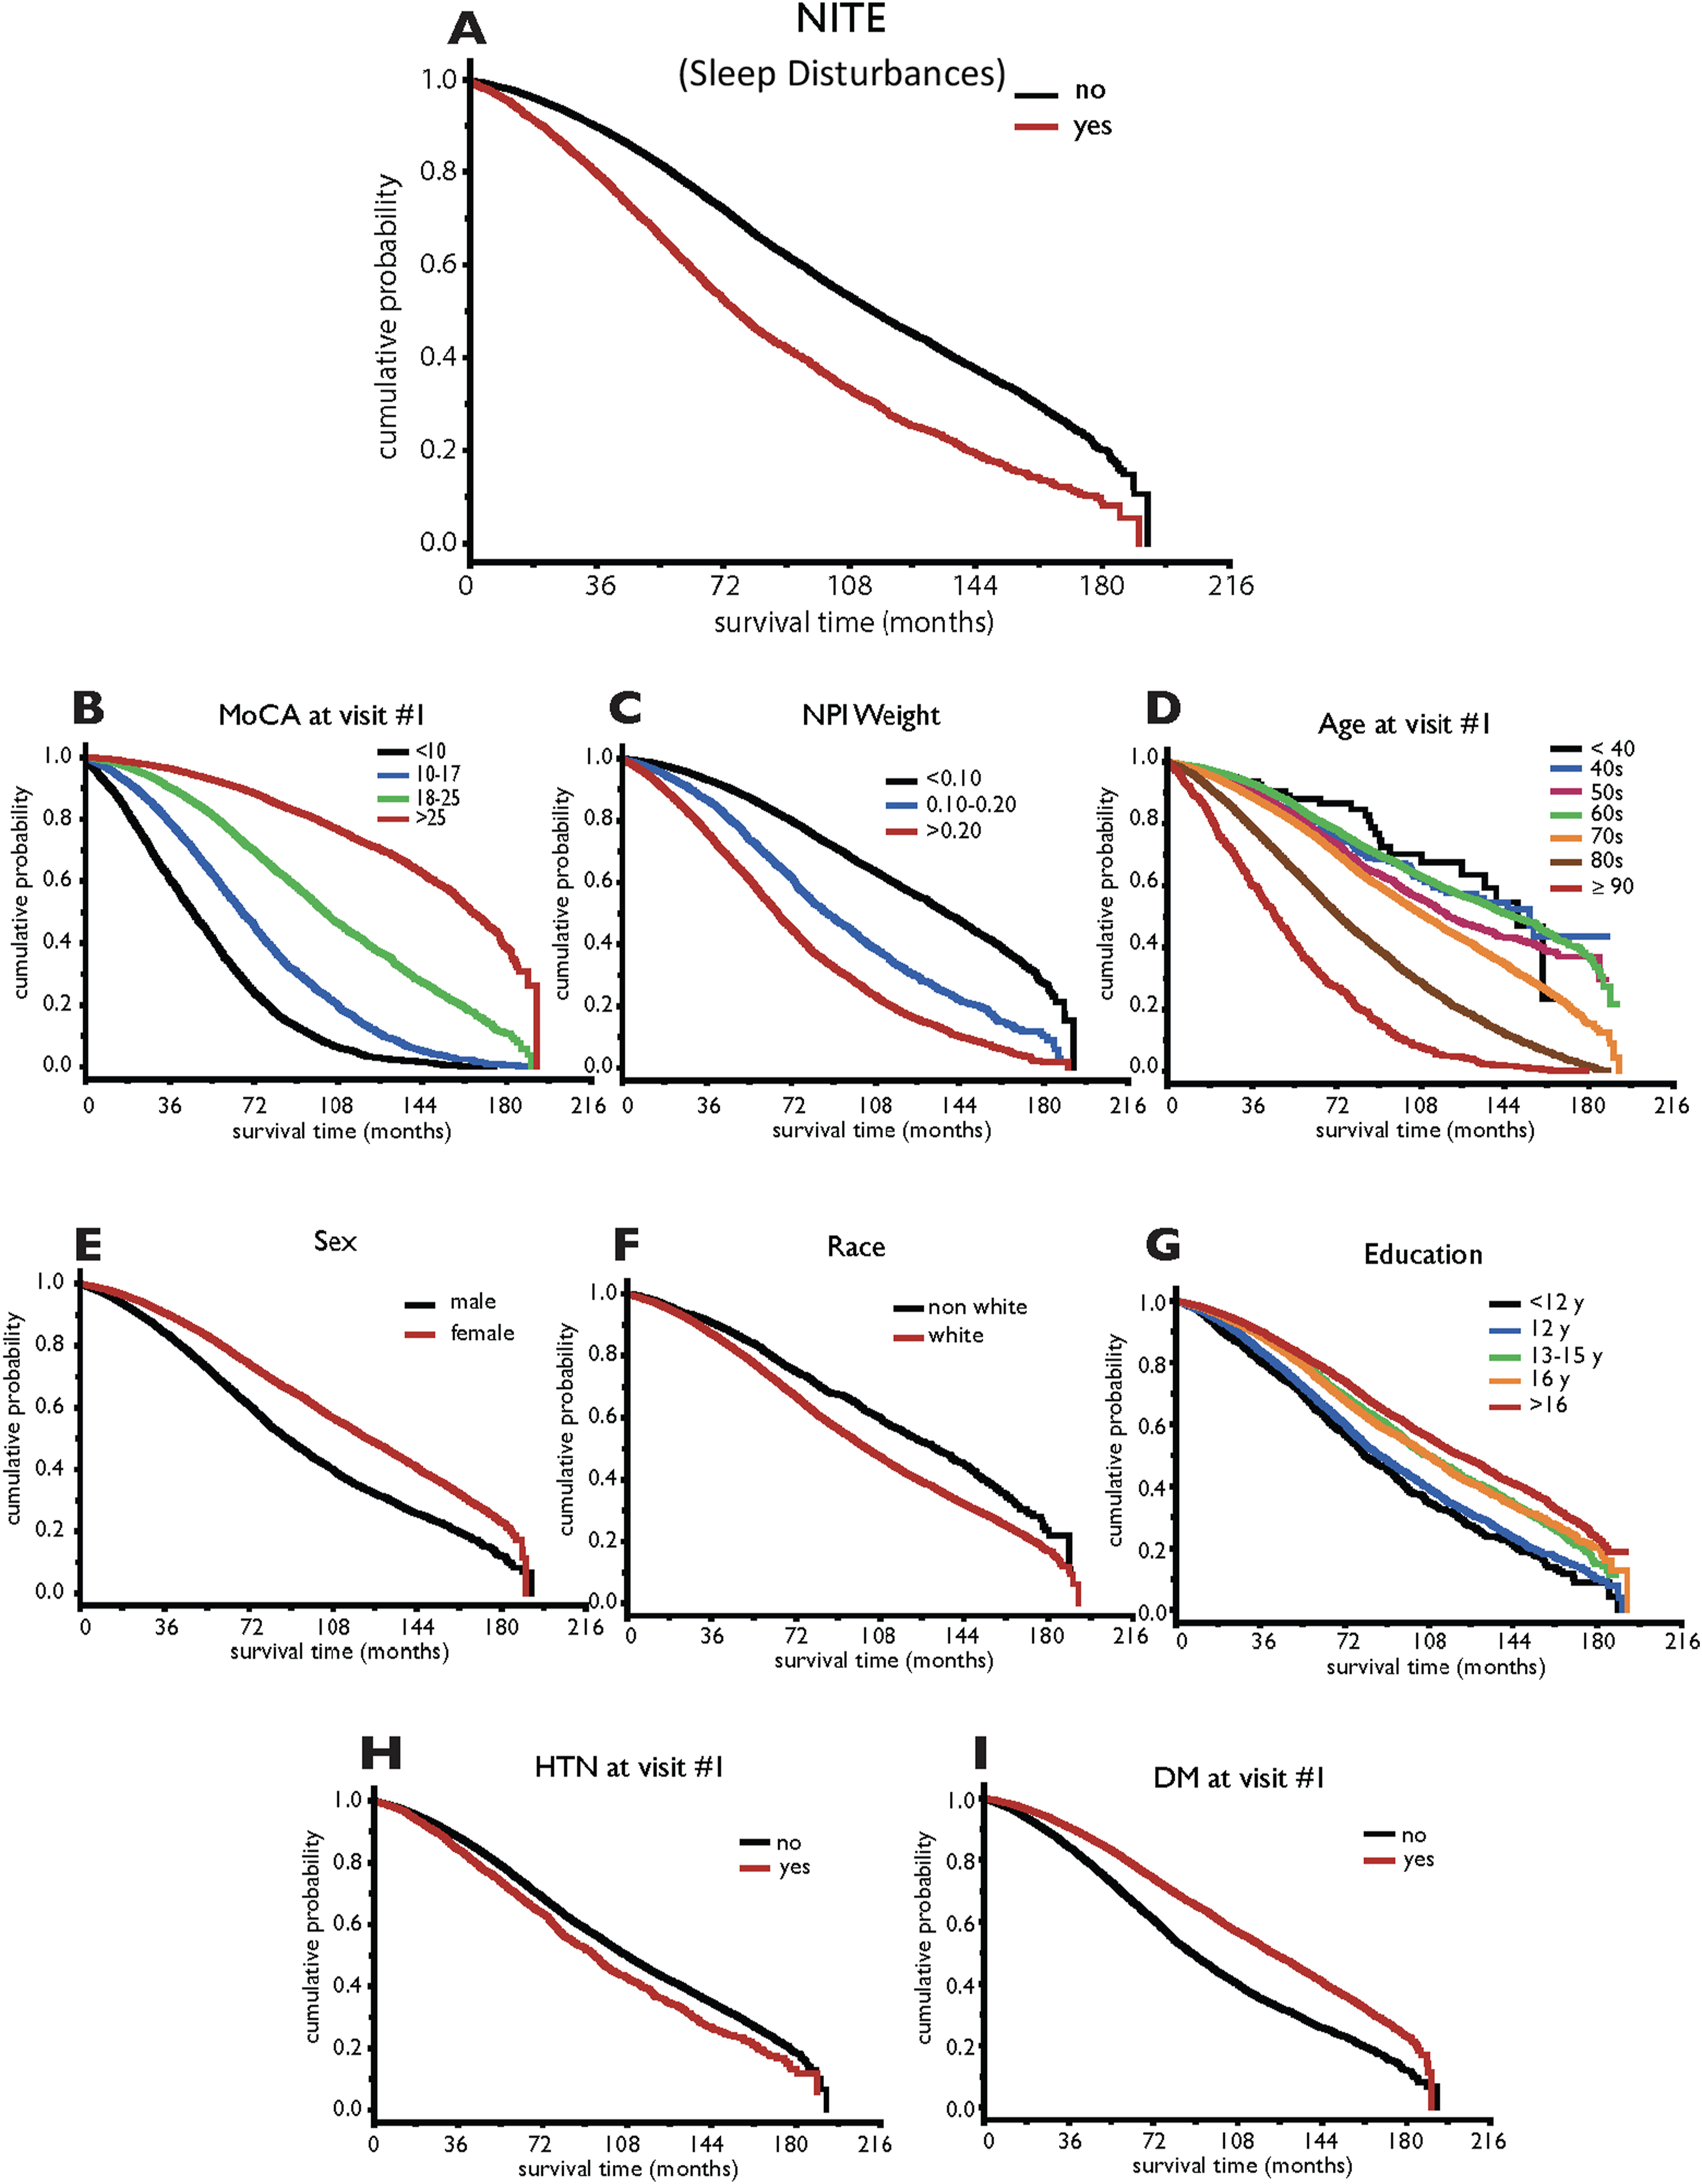
Multivariate survival analysis
Cox Multiple Piecewise Regression Model Type III Wald Chi-Square Statistics for Testing Predictor Main Effect and Predictor Interaction.
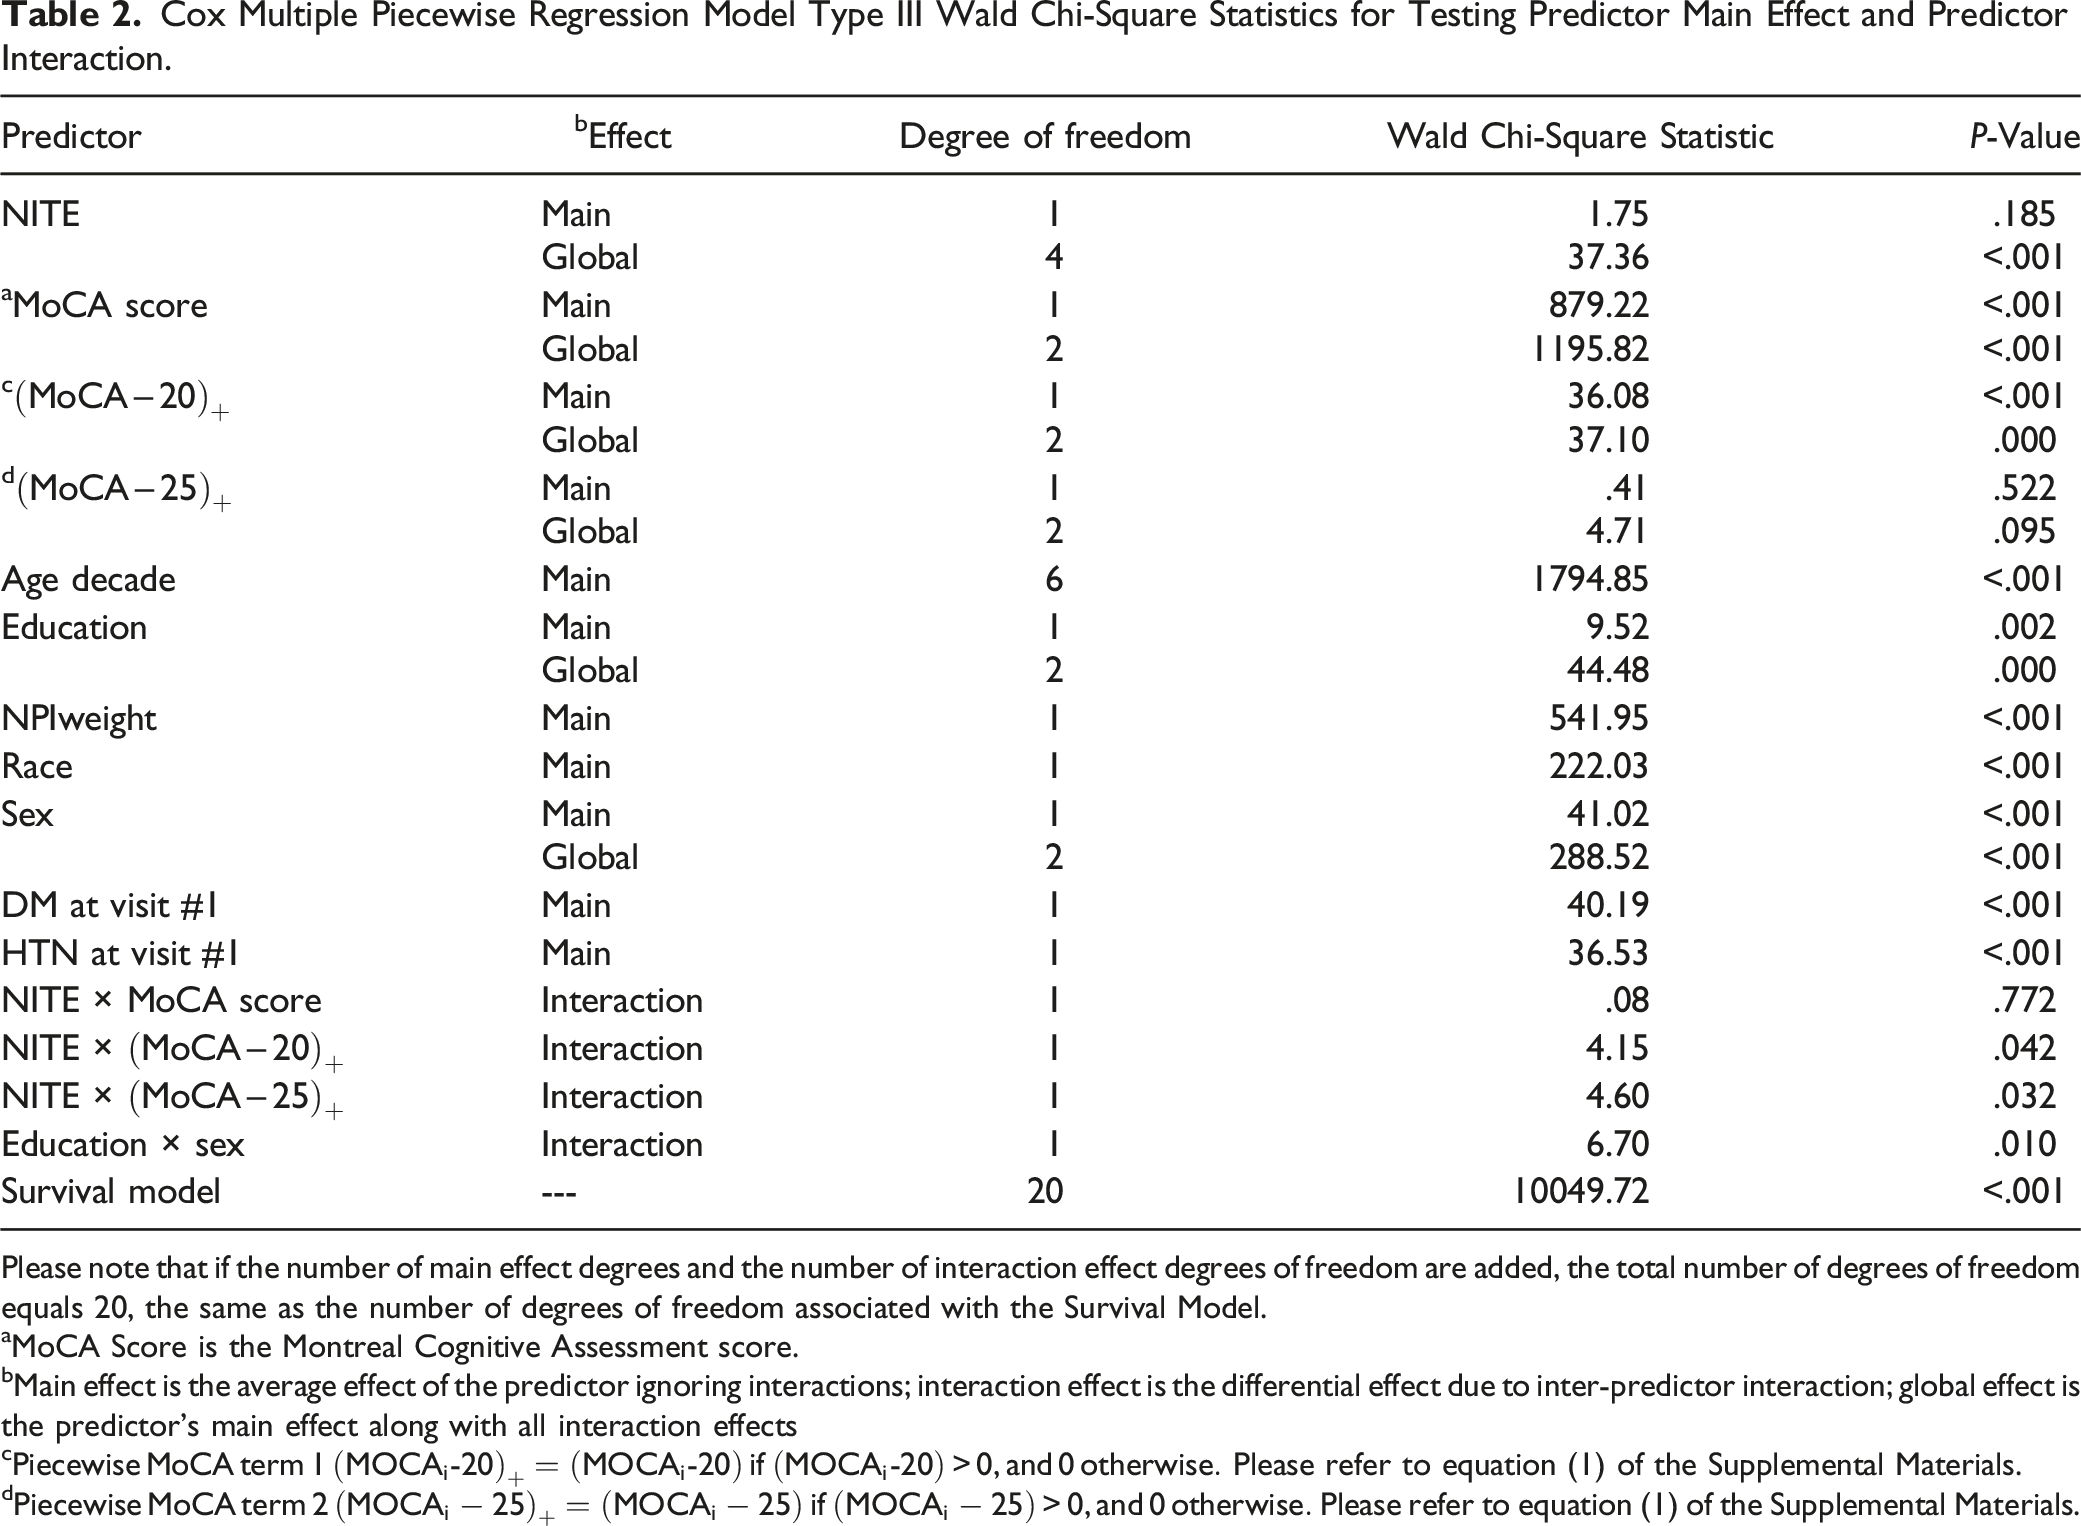
Please note that if the number of main effect degrees and the number of interaction effect degrees of freedom are added, the total number of degrees of freedom equals 20, the same as the number of degrees of freedom associated with the Survival Model.
aMoCA Score is the Montreal Cognitive Assessment score.
bMain effect is the average effect of the predictor ignoring interactions; interaction effect is the differential effect due to inter-predictor interaction; global effect is the predictor’s main effect along with all interaction effects
c
d
Sleep disturbances differentially impacted the instantaneous death rate (i.e., adjusted hazard ratio [AHR]) depending on participant cognition. Among participants with normal cognition (i.e., MoCA score: [26, 30]), the average sleep-disturbances impact (i.e., Sleep disturbances impact on the instantaneous death rate function of MoCA visit #1 score, when quantified by the Cox piecewise multiple regression model predicted adjusted hazard ratio (AHR) in MoCA score cognitive category intervals: normal cognition: [26, 30], mild impaired cognition (MCI): [20, 25], and dementia: [0, 19]. Solid back circles identify the AHR, and solid vertical lines identify the AHR 95% confidence interval, and the red horizonal solid line identifies the point on the y-axis where the AHR is equal to 1. Note that each null hypothesis assumes an underlying AHR equal to 1, and therefore if the AHR lower 95% confidence limit is located below or on the red solid line, the null hypothesis fails be rejected at the α = .05 significance level.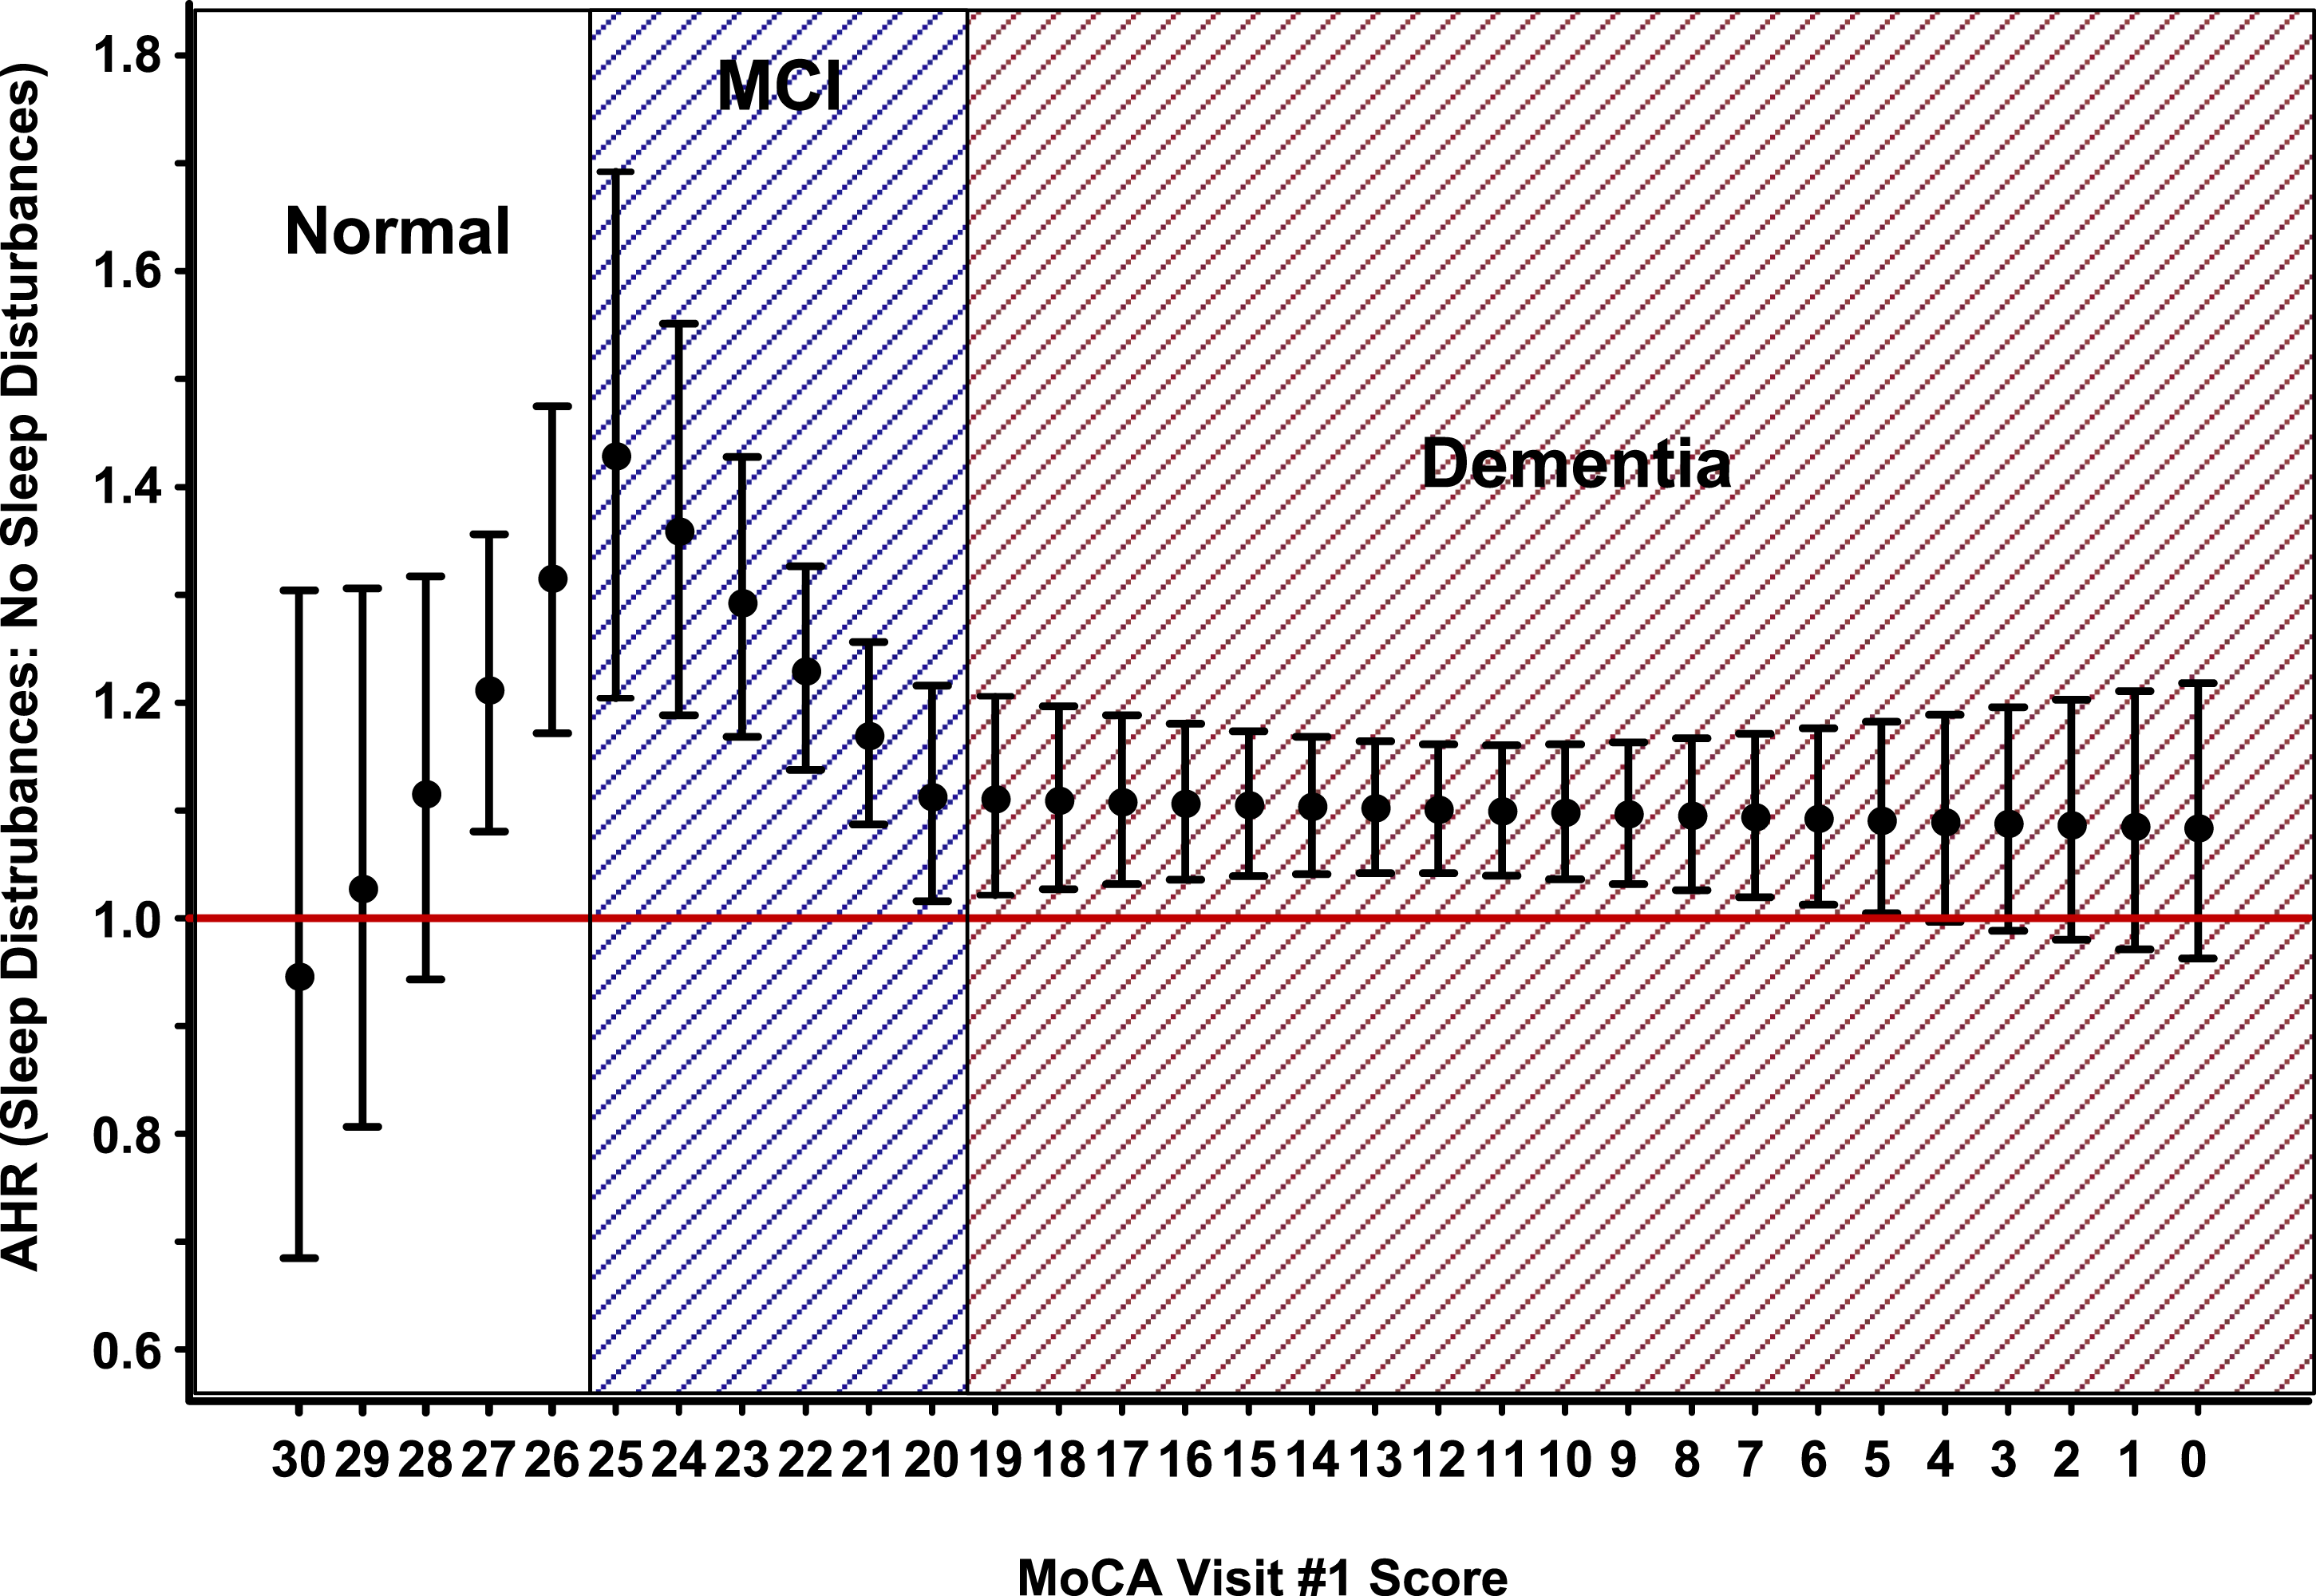
Cox Multiple Piecewise Regression Adjusted Hazard Ratio (AHR) for the Instantaneous Death Rate.
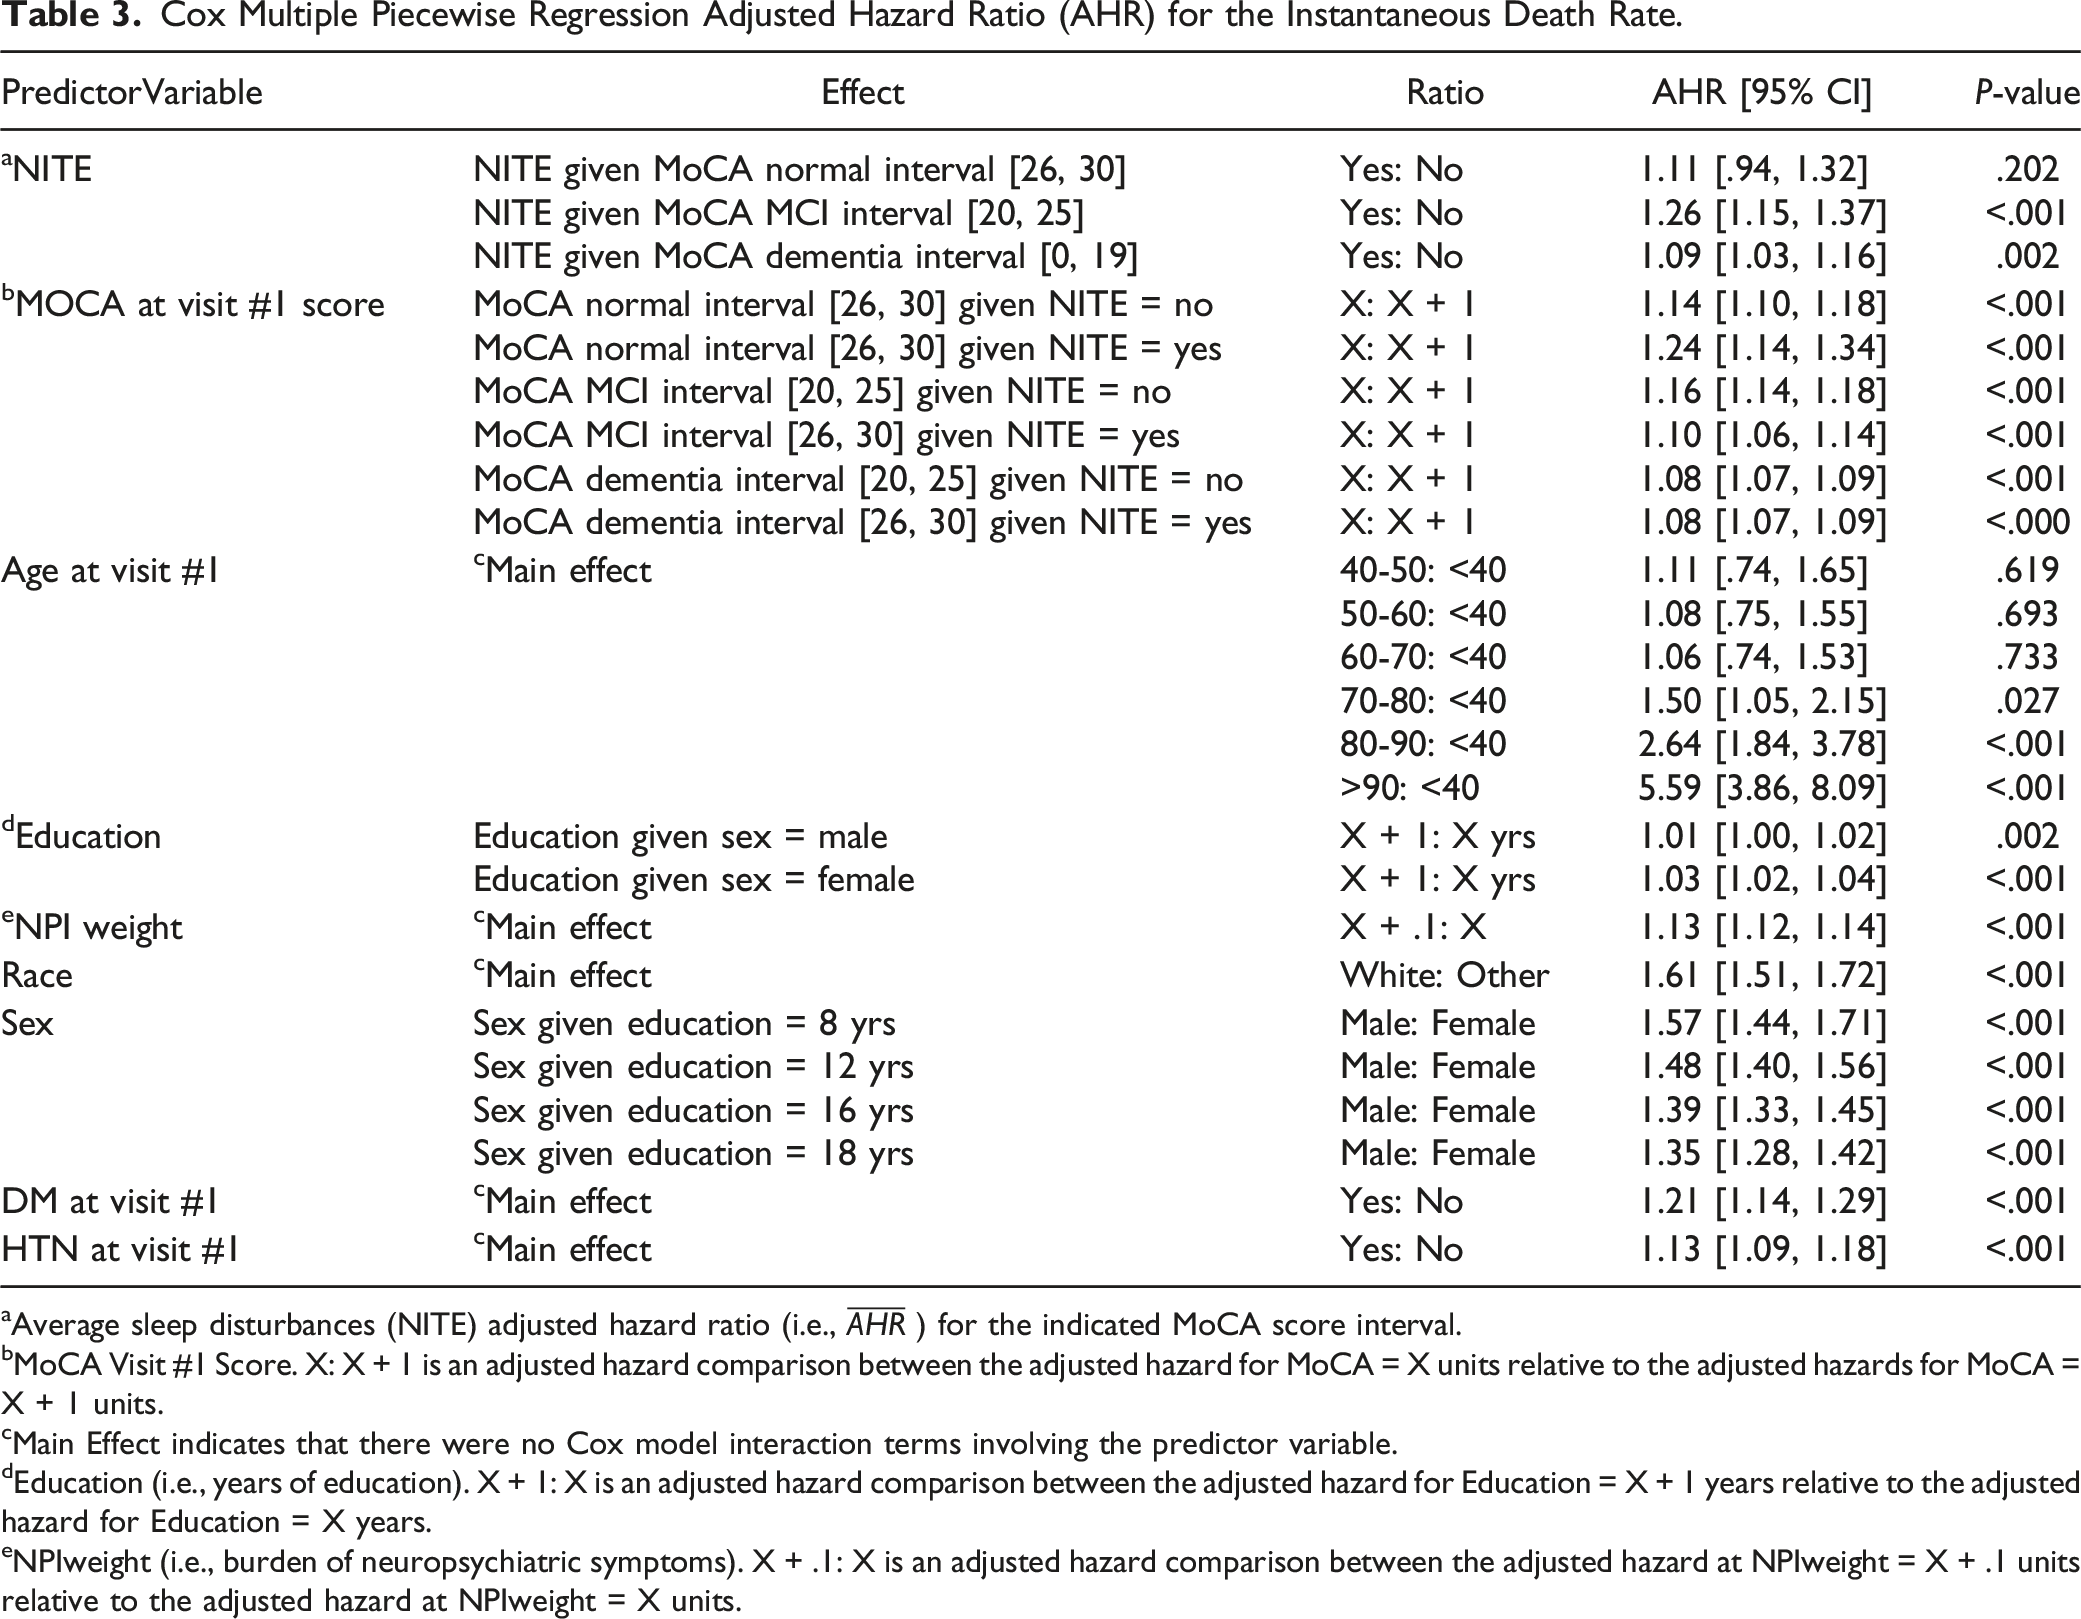
aAverage sleep disturbances (NITE) adjusted hazard ratio (i.e.,
bMoCA Visit #1 Score. X: X + 1 is an adjusted hazard comparison between the adjusted hazard for MoCA = X units relative to the adjusted hazards for MoCA = X + 1 units.
cMain Effect indicates that there were no Cox model interaction terms involving the predictor variable.
dEducation (i.e., years of education). X + 1: X is an adjusted hazard comparison between the adjusted hazard for Education = X + 1 years relative to the adjusted hazard for Education = X years.
eNPIweight (i.e., burden of neuropsychiatric symptoms). X + .1: X is an adjusted hazard comparison between the adjusted hazard at NPIweight = X + .1 units relative to the adjusted hazard at NPIweight = X units.
Relative to participants who were less than 40 year of age, the AHR for the instantaneous risk death for participants 70 years of age and older was progressive per decade of life (70-80 years, AHR: 1.50; 95% CI: [1.05, 2.15], P = .027, 80-90 years, AHR: 2.64; 95% CI: [1.84, 3.78], P < .001, >90 years, AHR: 5.59; 95% CI: [3.86, 8.09], P < .001). More education increased the instantaneous risk of death, but the deleterious impact of an additional year of education was more pronounce (P = .010) for female participants (AHR: 1.03, 95% CI: [1.02, 1.04], P < .001) than for male participants (AHR: 1.01, 95% CI: [1.00, 1.02], P = .002). The deleterious impact of male sex on the instantaneous death rate was most pronounced (P = .009) for participants with fewer years of education (8 year, AHR: 1.57; 95% CI: [1.44, 1.71], P < .001; 12 years, AHR: 1.48; 95% CI [1.40, 1.56], P < .001; 16 years, 1.39; 95% CI: [1.33, 1.45], P < .001; and 18 year, AHR: 1.35; 95% CI: [1.28, 1.42], P < .001). Greater NPIweight (AHR: 1.13; 95% CI: [1.12, 1.14], P < .001), white race (AHR: 1.61; 95% CI: [1.51, 1.72], P < 0001), DM at visit #1 (AHR: 1.21; 95% CI: [1.14, 1.29], P < .001) and hypertension at visit #1 (AHR: 1.13; 95% CI: [1.09, 1.18], P < .001) were all risk factors for the instantaneous death rate (Table 3).
The proportional hazards goodness of fit chi-square tests indicate that the Cox model proportional hazards assumption failed to hold for the MoCA score piecewise slope parameter estimate for MoCA scores in the interval [0, 19] and also failed to hold for the MoCA score piecewise slope deviation at MoCA score 20 (P = .007). All remaining terms (n = 18) of the Cox proportional hazards piecewise regression model adhered to the Cox model proportional hazards assumption at the α = .05 significance level (Table S2).
Missing data
Among the 34,236 participants in the NACC UDS database who had non-missing survival time/follow-up time data and non-missing death status/censoring information, 3136 (9.2%) were excluded from the multivariate survival analyses due to incomplete predictor variable information (Supplemental Table S1). The potential impact of missing-data-induced sample selection bias was examined by conducting a set of descriptive sensitivity analyses in which for each predictor variable, the predictor variable empirical distribution derived from the predictor data on all participants with complete predictor variable information (n = 31,100) was compared to the predictor variable empirical distribution derived from the predictor data of all participants with available predictor variable information. The descriptive sensitivity analyses are provided in Supplement Tables S3.1 – S3.10. Clearly, the empirical distributions of the predictor variable data from the participants with complete predictor variable information align well with the empirical distributions of the predictor variable data from all participants with available predictor variable information. Due to the small percentage of missing data (9.2%), as well as the lack of evidence of missing-data-induced sample selection bias, multiple imputation analytical techniques were not undertaken to impute missing data.
Discussion
Our findings demonstrate that the presence of sleep disturbances, defined in the NACC database as nighttime behaviors (insomnia, frequent awakening during the night, early awakening, and daytime sleepiness), were associated with a higher risk of mortality while controlling for other variables such as other neuropsychiatric symptoms, demographic factors, and a limited set of medical comorbidities. Sleep disturbances, as measured in various ways, in other disorders are associated with higher risks of earlier mortality; some examples are heightened cardiovascular deaths in older adults,28-30 excessive mortality with untreated sleep apnea, 31 and shift work. 32 The current study demonstrates that a higher risk of early mortality occurs across the range of severity of cognitive impairment.
Sleep disturbances differentially impacted survival time depending on cognitive status, wherein there was a greater negative impact among participants with MoCA scores between 24-27, a range that captures normal cognition and the cusp of mild cognitive impairment. Previous research has found that the presence of insomnia symptoms at baseline (similar to our study’s “visit #1”) predicted conversion from cognitively normal to cognitively impaired, not demented (CIND, 33 and MCIover time, but not from MCI to dementia. While these previous studies did not examine the impact of sleep disturbances on mortality, there are interesting parallels with worse outcomes associated with higher cognitive status (normal cognition or MCI). Based on these findings, it seems reasonable to explore differences in additional risk factors for mortality that were not collected in this dataset and amyloid-β status in older adults endorsing sleep disturbances before symptoms or signs of cognitive decline compared to later stages of cognitive decline.
Worse cognitive status was associated with earlier death among all participants, regardless of the presence or absence of sleep disturbances. This extends earlier findings that the presence of sleep disturbances is associated with worsening cognitive status over time, 15 and mortality. 19 Our study also supports the findings of other studies that evaluated mortality risks as functions of accumulated symptoms determined through the NPQ-I using dementia registries. 34 In one study, participants were gathered into NPQ-I score groups, and mortality risk increased stepwise by the increasing severity of the group. Similarly, our findings demonstrated increasing mortality risks with the NPIweight. This highlights our unique contribution as we examined the risk of sleep disturbances independently from the other symptoms accounted for in the NPI-Q. Another important recent study that specifically evaluated sleep and mortality in dementia was an evaluation of the National Health and Aging Trends cohort. 35 In this study, participants were asked if difficulties initiating or falling asleep occurred on “most nights” or “every night.” Similar to our findings, sleep disturbances were associated with early mortality. Although that study controlled for demographic factors and “chronic conditions,” we explicitly controlled for other neuropsychiatric symptoms, demographic factors, and chronic conditions. High NPI-Q scores and more severe NPS have been shown to increase mortality risk in both MCI and dementia. 36 Although previous studies have focused on NPS symptoms or conditions, such as depression, we chose to focus on the NPI-Q “sleep behaviors” as we found that it is closely associated with biomarkers of dementia such as biomarkers of hippocampal volumetry and cerebral spinal fluid phosphorylated tau:beta amyloid ratios. 10 Our study is unique in that the effect of sleep disturbances is examined in isolation from and with other known NPS in dementia and across multiple levels of cognitive status. Considering the known relationship between sleep and cognitive health, our findings were not surprising; however, results that showed a greater deleterious impact of sleep disturbances at better levels of cognitive status should be explored further, especially in the context of precision medicine and early intervention for at-risk individuals.
Previous work has also focused on neuropsychiatric symptom (NPS) clusters using the NPI-Q at different stages of the disease process. 37 In a recent systematic review, greater severity of NPS overall predicted both cognitive decline and mortality, but when symptoms were considered individually, only isolation, agitation/aggression, hallucinations, and depression predicted mortality across 42 prospective cohorts of 24,711 participants. 38 Only one study in the review considered sleep disturbances as an independent NPS predictor of cognitive decline. 39 NPI-Q scores are known to predict cognitive decline 40 and mortality in adults living with cognitive impairment; 36 however, there are few studies examining the impact of the NACC UDS-“sleep disturbances” on cognitive decline and mortality.41,42 Previous work demonstrated that in an initial visit presentation with “an NPI-Q score greater than zero (endorsement of any symptom[s]), there was a 1.37 times greater risk of conversion to dementia than those with no symptoms of the NPI-Q. 43 ” This study demonstrates that sleep disturbances significantly affect the mortality of cognitively normal older adults independently from the complex dementia-specific symptoms assessed by the NPI-Q score. This is significant as sleep disturbances can be modified, possibly attenuating mortality risk.
Limitations include that our measure of sleep disturbances, the “nighttime behaviors” variable from the NPI-Q, although it correlates with the severity of cognitive impairment and biomarkers of AD, 25 it is not a clinical index such as the Insomnia Severity Index 44 or Pittsburgh Sleep Quality Index,45,46 which are common surveys by which to measure problems with the initiation or maintenance of sleep clinically. Although the NACC UDS provided a large sample size to examine the association between sleep and mortality, the sample’s older age and risk factors may have contributed to a relatively short follow-up period to examine mortality. We acknowledge that MoCA was not created as a diagnostic tool and only approximates a clinical diagnosis; in the present study, we used it as a longitudinal variable to control for cognitive level, which had the advantage of consistency through the database. Although the NACC UDS includes queries on comorbid medical conditions and medications known to impact mortality, we found a significant amount of missing data across some, but not all, known confounders of either death or Alzheimer’s disease (e.g., obesity, sedative-hypnotic medications). Therefore, these variables were excluded from the analysis. Although the NACC UDS is a robust, longitudinal database, participants do not comprise a nationally representative sample due to differing recruitment methods and ADC areas of focus by individual sites. For example, the NACC UDS participants are more likely to be white and highly educated. We collapsed ethnic and racial categories into binomial variables, which may have overlooked nuances among demographic groups. All NPI-Q questions were provided by the co-participant, which may be impacted by whether or not the co-participant is a full-time caregiver, bed partner, or poor sleeper. Additionally, for participants who were not included through death, there is the potential that this lack of data introduced bias that may have impacted our findings. Analyses described that “survivors” had about a year shorter duration of observation than the deceased, and it is possible that those we labeled as “survivors” lacked ADC follow-ups rather than the perceived increased survival rate at a non-deceased last ADC visit. Lastly, the hazard ratios for normal and dementia were very similar, which may suggest that observed group differences were due to the difference between sample sizes.
The present study results extend earlier findings that sleep disturbances, as measured by the NPI-Q variable, are associated with conversion from normal cognition to MCI. Early identification of sleep disturbances through routine screening in primary or specialty care settings is critical to identifying and improving sleep, which may provide a method to decelerate the deterioration of cognitive functioning, improve quality of life, and forestall mortality. Although evidence supports relationships between sleep disturbances, cognition, and mortality individually, there is still a lack of knowledge regarding their interrelationships and mechanisms. Findings support that sleep disturbances negatively impact survival time, and the deleterious impact of sleep disturbances on survival time is interrelated with participant cognition, with the most pronounced deleterious impact among participants in the transition from normal cognition to mild cognitive impairment.
Supplemental Material
Supplemental Material - Interrelationship of Sleep Disturbances and Cognitive Status on Mortality
Supplemental Material for Interrelationship of Sleep Disturbances and Cognitive Status on Mortality by Meghan K. Mattos, PhD, Ifrah Zawar, MD, Carol Manning, PhD, James Patrie, MS, and Mark Quigg in American Journal of Alzheimer's Disease & Other Dementias®.
Footnotes
Acknowledgments
NACC data are contributed by the NIA-funded ADCs: P50 AG005131 (PI James Brewer, MD, PhD), P50 AG005133 (PI Oscar Lopez, MD), P50 AG005134 (PI Bradley Hyman, MD, PhD), P50 AG005136 (PI Thomas Grabowski, MD), P50 AG005138 (PI Mary Sano, PhD), P50 AG005142 (PI Helena Chui, MD), P50 AG005146 (PI Marilyn Albert, PhD), P50 AG005681 (PI John Morris, MD), P30 AG008017 (PI Jeffrey Kaye, MD), P30 AG008051 (PI Thomas Wisniewski, MD), P50 AG008702 (PI Scott Small, MD), P30 AG010124 (PI John Trojanowski, MD, PhD), P30 AG010129 (PI Charles DeCarli, MD), P30 AG010133 (PI Andrew Saykin, PsyD), P30 AG010161 (PI David Bennett, MD), P30 AG012300 (PI Roger Rosenberg, MD), P30 AG013846 (PI Neil Kowall, MD), P30 AG013854 (PI Robert Vassar, PhD), P50 AG016573 (PI Frank LaFerla, PhD), P50 AG016574 (PI Ronald Petersen, MD, PhD), P30 AG019610 (PI Eric Reiman, MD), P50 AG023501 (PI Bruce Miller, MD), P50 AG025688 (PI Allan Levey, MD, PhD), P30 AG028383 (PI Linda Van Eldik, PhD), P50 AG033514 (PI Sanjay Asthana, MD, FRCP), P30 AG035982 (PI Russell Swerdlow, MD), P50 AG047266 (PI Todd Golde, MD, PhD), P50 AG047270 (PI Stephen Strittmatter, MD, PhD), P50 AG047366 (PI Victor Henderson, MD, MS), P30 AG049638 (PI Suzanne Craft, PhD), P30 AG053760 (PI Henry Paulson, MD, PhD), P30 AG066546 (PI Sudha Seshadri, MD), P20 AG068024 (PI Erik Roberson, MD, PhD), P20 AG068053 (PI Marwan Sabbagh, MD), P20 AG068077 (PI Gary Rosenberg, MD), P20 AG068082 (PI Angela Jefferson, PhD), P30 AG072958 (PI Heather Whitson, MD), P30 AG072959 (PI James Leverenz, MD).
Declaration of Conflicting Interests
The author(s) declared no potential conflicts of interest with respect to the research, authorship, and/or publication of this article.
Funding
The author(s) disclosed receipt of the following financial support for the research, authorship, and/or publication of this article: Dr. Mattos acknowledges funding from the National Institute on Aging of the National Institutes of Health under Award Number K76AG074942. Drs. Zawar and Quigg acknowledge funding from NIH-NINDS (NeuroNEXT U24NS107182). Dr Quigg acknowledges funding from the University of Virginia Brain Institute. Dr Zawar acknowledges funding from the Alzheimer’s Association. Dr Manning acknowledges funding from the DoD (W81XWH2010448), NIH (SB1AG037357-04A1, R01AG068128), and HRSA (4 U1QHP287440400). The content is solely the responsibility of the authors and does not necessarily represent the official views of the National Institutes of Health. The NACC database is funded by NIA/NIH Grant U24 AG072122.
Data Availability Statement
Supplemental Material
Supplemental material for this article is available online.
Appendix
References
Supplementary Material
Please find the following supplemental material available below.
For Open Access articles published under a Creative Commons License, all supplemental material carries the same license as the article it is associated with.
For non-Open Access articles published, all supplemental material carries a non-exclusive license, and permission requests for re-use of supplemental material or any part of supplemental material shall be sent directly to the copyright owner as specified in the copyright notice associated with the article.