
Abstract
Background
Determining a non-invasive, serum-based diagnostic panel for early diagnosis of AD will play a significant role in the prevention and treatment of the disease.
Methods
We performed standardized clinical assessments and neuroimaging measurements in 45 patients with AD and an equal number of sex - and age-matched controls. 48 target peptides of 14 identified target proteins were quantitatively analyzed by PRM.
Results
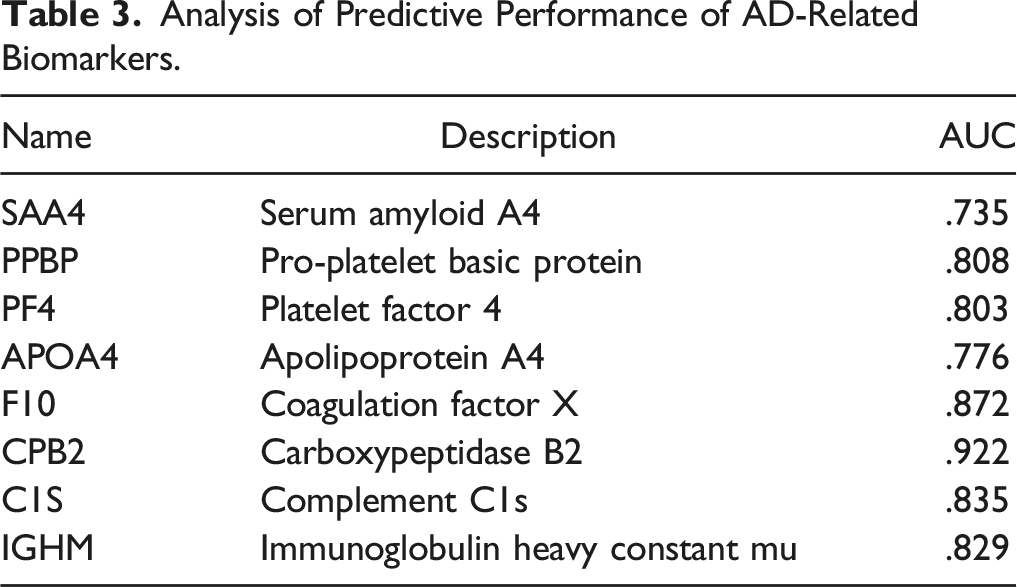
8 protein markers were screened, including SAA4, PPBP, PF4, APOA4, F10, CPB2, C1S and IGHM. An diagnosis panel including 8 proteins and demographic characteristics markers respectively was found to be the robust with a AUC of 92.3%.
Conclusions
Our study developed a new panel including protein and demographic characteristics that could be used to distinguish AD from control candidates.
Introduction
Alzheimer’s disease (AD) is a chronic degenerative disease of the central nervous system with insidious onset, characterized by progressive memory impairment and cognitive function decline accompanied with decreased ability of daily living and behavioral changes. AD is the most common type of dementia, of which the prevalence and incidence elevate with the increase of age. 1 According to the 2020 Alzheimer’s Facts and Figures report, there are approximately 50 million people worldwide with AD or other types of dementia, and this number will reach 152 million by 2050. 2 With the aging population of China, there were 180 million people over the age of 65 in 2020, accounting for 13% of the population. In addition, as the acceleration of the aging process, the number of AD patients is still rising, leading to a huge economic burden to the country. 3 The development of AD has become an important public health problem, and curbing the continuous high incidence of AD effectively will bring a great challenge facing the aging society.
The neuropathological changes of AD mostly occur 10 to 20 years before the appearance of dementia, and are only diagnosed after autopsy pathology verification. Previous studies have confirmed that the a misdiagnosis rate of AD ranged from 10% to 15% in routine clinical diagnosis. 4 In recent years, the usage of biomarkers for early diagnosis and prediction of AD has attracted increasing attention. AD biomarkers were mainly derived from imaging and cerebrospinal fluid. However, detection methods based on cerebrospinal fluid and imaging biomarkers were expensive and invasive, and more importantly they were limited to the coverage of detection equipment. As a result, these methods were difficult to implement in clinical practice and primary health care system. Therefore, the screen of potential diagnostic markers and establishment of early diagnostic models for AD based on non-invasive/minimally invasive samples (mainly blood) are important for the primary and secondary care of AD.
With small-scale clinical specimens being the core and entry point, this study aims to screen protein biomarkers related to early AD, and establish early AD diagnosis strategies, which has important scientific significance and clinical value for personalized intervention in early AD and reduction of incidence and long-term mortality.
Methods
Study Sample
Serum samples were obtained from 90 individuals with an average age of 71 years, including 45 AD subjects (ADs) and 45 normal controls (NCs) which were recruited from a cohort in Zhejiang Province between March to July of 2020. A diagnostic criterion of AD was based on the Chinese Geriatric Health Association (2021) Chinese guideline for the diagnosis and treatment of Alzheimer’s dementia. 5 The exclusion criteria of AD cases were: patients with chronic infection, cancer, vitamin B12 deficiency, acute severe disease, and any other neurologic disorders affecting cognitive function.
Meanwhile, age and gender-matched controls were enrolled from various patients who were free of AD. Mental and cognitive assessments were performed according to standardized clinical assessments, including the Mini-Mental State Examination (MMSE), Montreal Cognitive Assessment scale (MoCA), and Hospital Anxiety and Depression Scale (HAD). In the MMSE test, scores less than 17 in participants who were illiterate (less than 1 year of education), less than 20 in participants with a primary school education level (1 to 6 years of education), and less than 24 among those with a junior high school degree or higher (more than 7 years of education) were considered as positive.
6
MoCA defined the threshold for dementia as ≤18 points.
5
The HAD scale test consisted two subscales of anxiety (A) and depression (D), with seven questions of each syndrome. A score of more than 8 on the anxiety and depression subscale was considered as positive. Doctors are all clinicians with attending qualifications or more in grade-A tertiary hospitals. Additionally, all participants, including AD and NC groups, were further evaluated via positron emission tomography (PET), brain computed tomography (CT), or magnetic resonance imaging (MRI) scan. Flow chart was showed in Figure 1. Study design overview (LR, likelihood ratio; RF, random forest).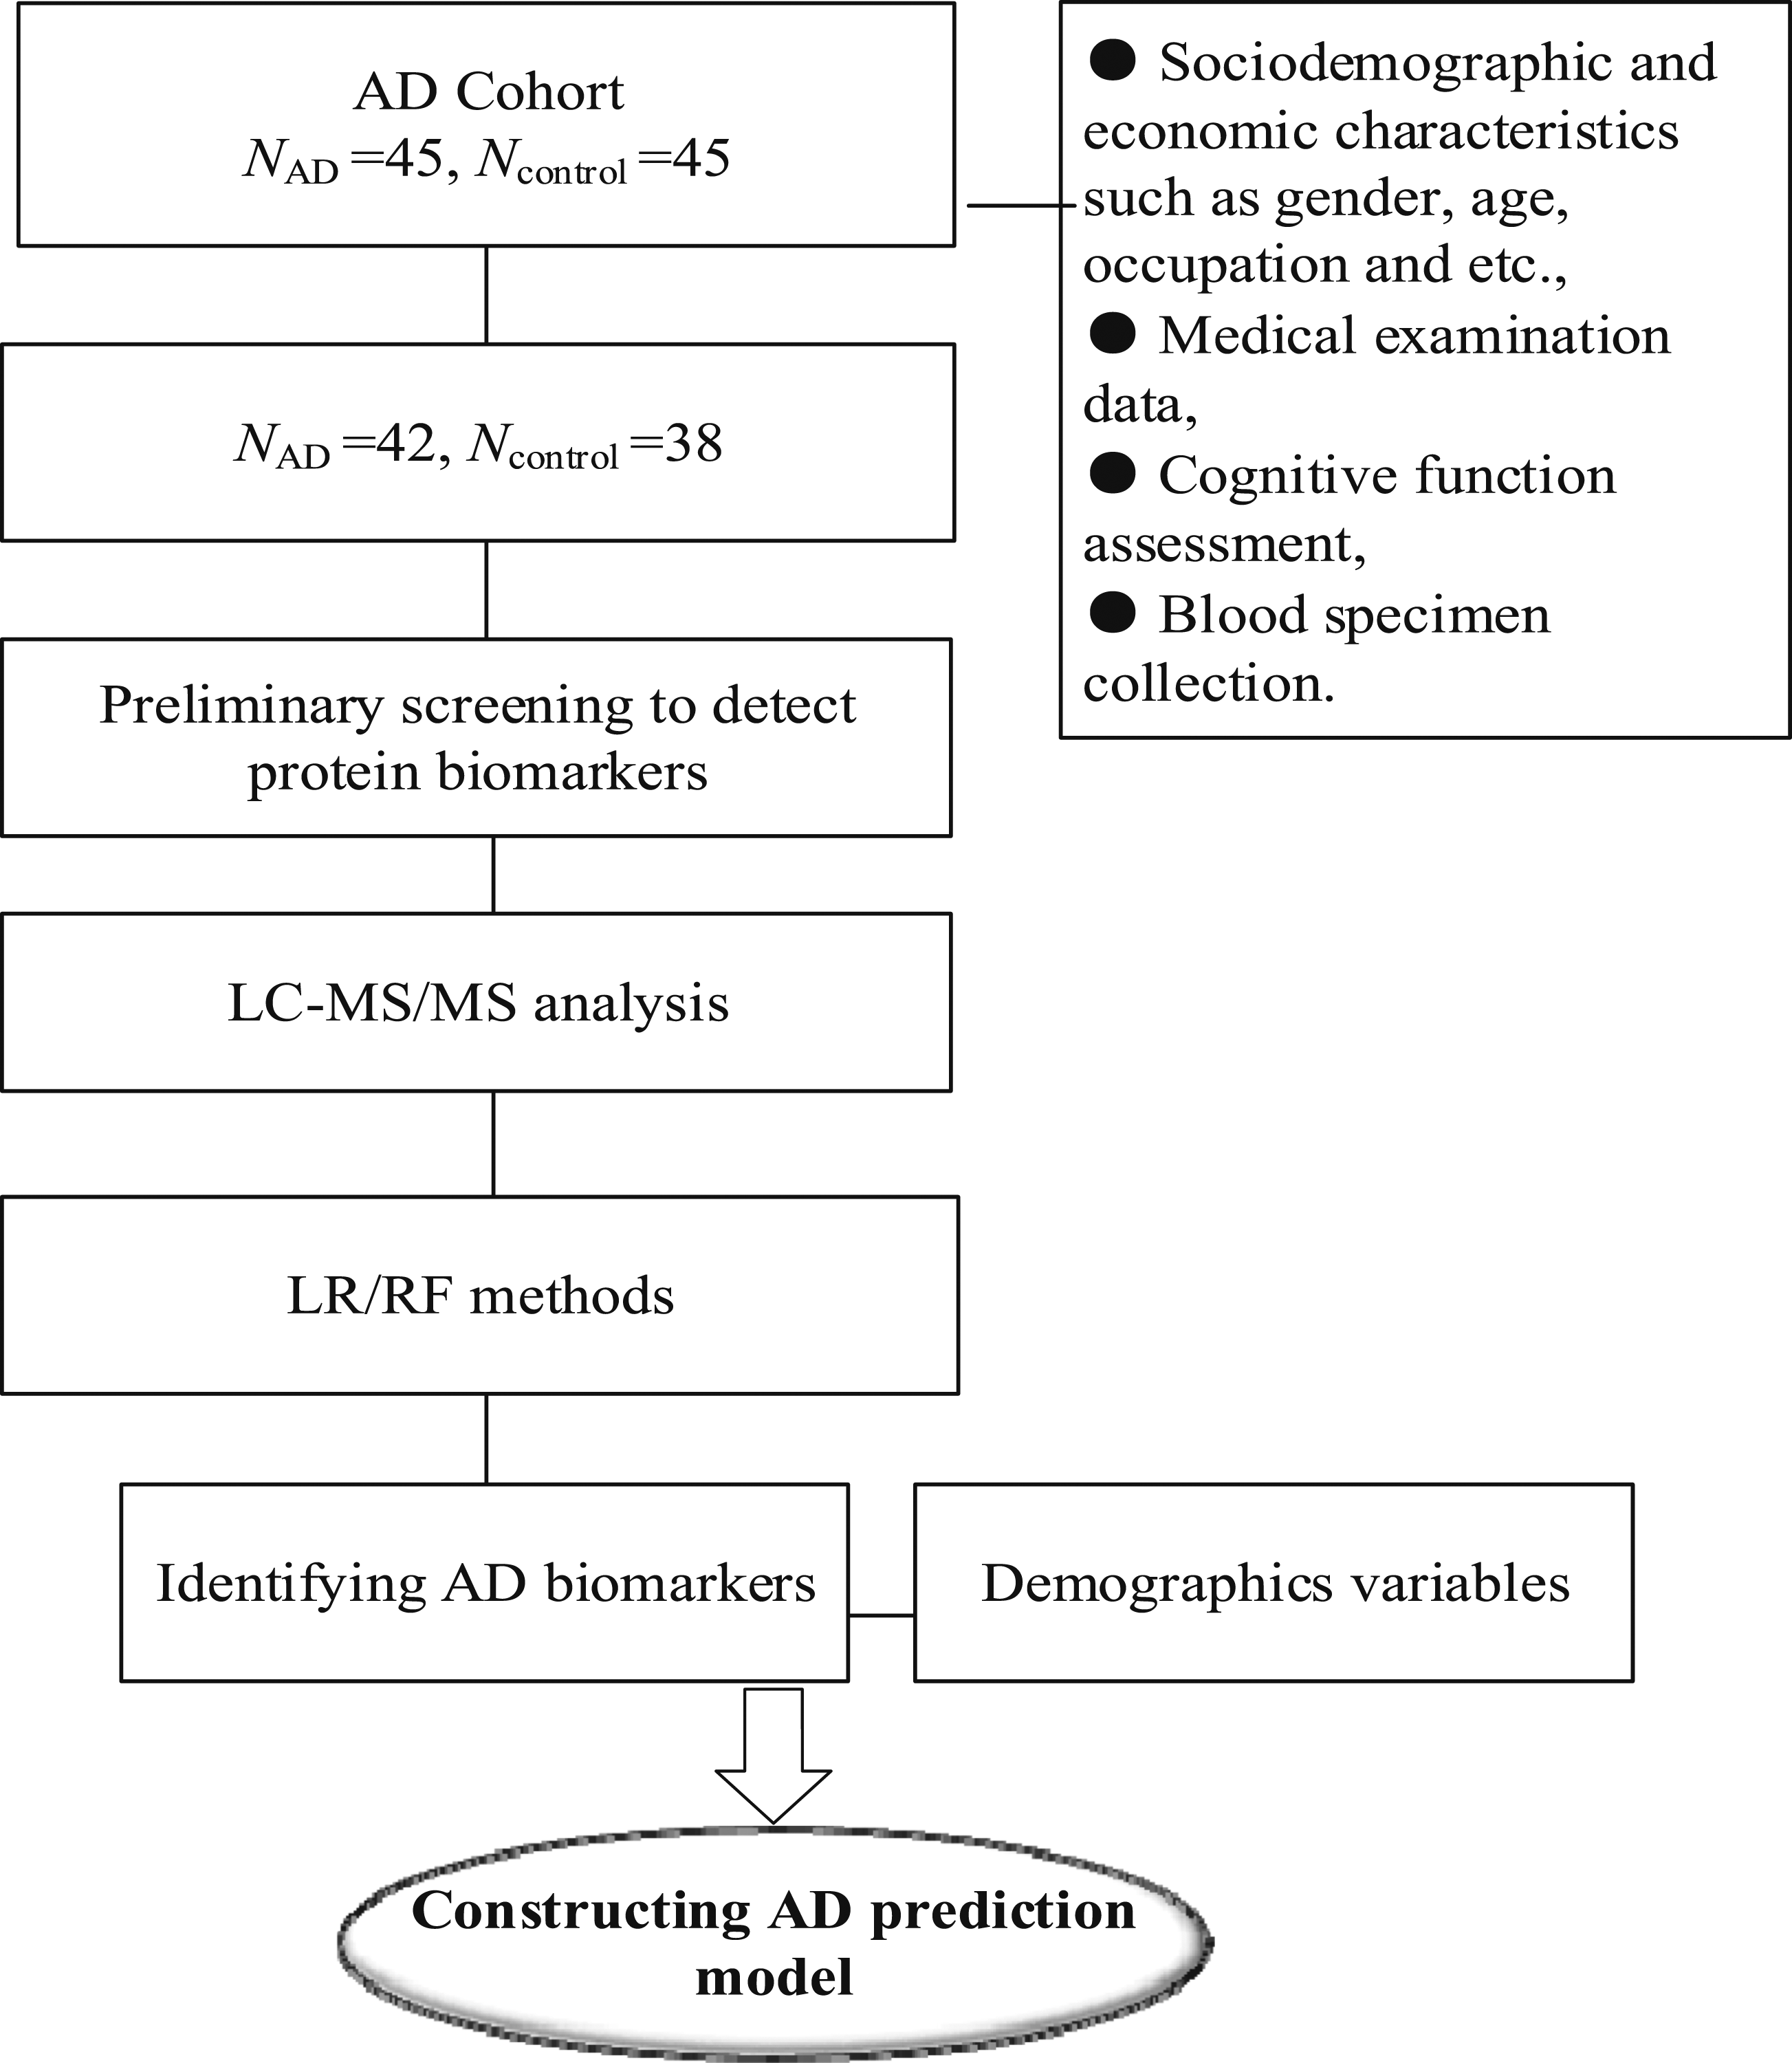
Collection of Plasma
We collected serum samples from each participant in a tube containing anticoagulant. The collected whole blood was left at room temperature for two hours, avoiding violent shaking to hemolysis, and the blood samples were centrifuged at 4°C at 3000 r/min for 15 min. After the centrifugation step, 1 mL supernatant from each sample were collected, and the upper layer of serum samples was placed in an Eppendorf (EP) tube, frozen in liquid nitrogen and stored at −80°C until measurement. We counted the red and white blood cells number to assure they are normal.
Ethics
Informed consent was obtained from all participants or their caregivers, and this study was approved by the Medical Ethics Committee of Zhejiang Hospital.
Preliminary Screening
AD related proteins were selected for targeted proteomic analysis. Candidates were included if they were identified by searching the PIR database using “Alzheimer’s disease” as the key phrase. In order to increase the likelihood of these proteins being related to AD, we also required that they be identified as AD related in the Polyphen database with a correlation coefficient of 2 or greater. A total of 41 target proteins may be detected in the serum samples through the methods explained above of this study. Therefore, these 41 proteins were determined as the core proteins for detection in this study. Targeted PRM mode was used to monitor the peptide sequences of candidate proteins in mixed samples. The results of mass spectrometry showed that 14 target proteins could be accurately identified, and 48 target peptides of 14 target proteins were quantitatively analyzed by PRM. Then 14 target proteins were verified by PRM. First, the parent ion information of the target peptide was selectively detected in primary mass spectrometry using the selective detection ability of the four-stage bar mass analyzer. Then, the parent ion is broken in the collision cell. Finally, the information of all fragments in the selected parent ion window is detected by a high resolution, high quality and precision analyzer in the secondary mass spectrometry, so that the target protein/peptide segment in the complex sample can be accurately analyzed and the target protein can be obtained.
Sample Processing and LC-MS/MS Analysis
Protein in the supernatant was assayed with a BCA Protein Assay Kit (Bio-Rad, USA). The protein (20 μg) from each sample was mixed with 5X loading buffer and separated on a 12.5% SDS-PAGE gel and visualized by Coomassie Blue R-250 staining. A filter-aided sample preparation (FASP) was used to remove the detergent, DTT, and other low molecular weight components and digest the proteins. The protein was extracted by SDT (4% (w/v) SDS, 100 mM Tris/HCl pH7.6, 0.1 M DTT) cracking method, and then the protein was quantified by BCA method. According to the quantitative results, the loading volume of the sample was calculated (the maximum loading volume was 15 μl). According to the loading volume, the sample to be tested was added into a loading buffer centrifugal tube containing 4.0 μl. After heating, the tube cap appeared water beads, and then centrifuge for 30 s. Remove the seal with SDS prefabricated glue, install it in the electrophoresis tank, and fill it with SDS electrophoresis solution. Add samples to the prefabricated strip in turn, add 5.0 μl Maker before each item, and add 4.0 μl Loading buffer for empty lanes. Plug in the power supply, 200 v electrophoresis for 55 min, move the Loading buffer to the bottom of the prefabricated glue, then turn off the power, and unload the glue into the glue box. Put it into the protein staining machine for dyeing and decolorizing. After dyeing, put it into the plastic box. Let it stand for 90 min. After that, appropriate amount of protein was taken from each sample for tryptic enzymolysis by Filter aided proteome preparation (FASP).”
14 target proteins were verified by PRM. Trypsin CHLS TRY001C (item number: 020 201 308), configured at the appropriate concentration (−80°C storage for a period of 3 months), was used according to the ratio of protein: enzyme = 50:1. First, the parent ion information of the target peptide was selectively detected in primary mass spectrometry using the selective detection ability of the four-stage bar mass analyzer. Then, the parent ion was broken in the collision cell. The gas is nitrogen, and the impact energy is 27 ev. Finally, the information of all fragments in the selected parent ion window was detected by a high resolution, high quality and precision analyzer in the secondary mass spectrometry, so that the target protein/peptide segment in the complex sample could be accurately analyzed and the target protein could be verified.
Skyline software was used to analyze 48 target peptide segments of 14 target proteins. The Skyline analysis results of target peptide segments were shown in supplementary table 1, which included the chromatographic peak of peptide segment, the original peak area and the correlation histogram of the original peak area. Three sub-ions with high abundance of peptide segments and as continuous as possible were selected for quantitative analysis. The peak area results of each target peptide segment after Skyline analysis were derived. The results were shown in supplementary table 1, which included the name of target protein, sequence of target peptide segment, charged charge number of parent ion, selected daughter ion, charged charge number of daughter ion and original peak of each daughter ion used for quantitative analysis area.
According to the preliminary experimental results, 48 target peptides of 14 identified target proteins were quantitatively analyzed by PRM. The peptide information suitable for PRM analysis was imported into the software Xcalibur for PRM method setting. About 1 μg peptide segment was taken from each sample, and 20 Fmol standard peptide (PRTC: DIPVPKPK) was added for detection. HPLC system was used for chromatographic separation. Buffer: Solution A is .1% formic acid aqueous solution, and solution B is .1% formic acid acetonitrile aqueous solution (acetonitrile is 84%). The column was equilibrated with 95% liquid A. The samples were injected into the chromatographic column for gradient separation at a flow rate of 300 NL/min.
The samples separated by HPLC were analyzed by Q-EXactive HF mass spectrometer (Thermo Scientific) PRM mass spectrometry. The analysis time was 60 min, and the detection mode was positive ion. The scan range of primary mass spectrometry was 300-1800 m/z, the resolution was 60 000 (m/z 200), the AGC target was 3 × 10⁶, and the Maximum IT was 200 ms. Twenty PRM scans (MS2 SCANS) were obtained according to the Inclusion list after each full MS scan, with a Isolation window of 1.6th and a mass spectrometry resolution of 30 000 (m/z 200) and AGC Target was 3 × 10⁶, Maximum IT was 120 ms, MS2 Activation Type was HCD, and Normalized Collision Energy was 27. Eighty serum sample were processed and analyzed by MS proteomic analysis employing PRM. Skyline 3.5.0 was used for data analysis of PRM original files.
The quantitative information was normalized by using isotopically re-labeled peptide segment, and then the relative quantitative analysis of target peptide segment and target protein was performed. The liquid phase separation elution gradient was as follows: 0-2 minutes, linear gradient of liquid B from 5% to 10%, 2-45 minutes, linear gradient of liquid B from 10% to 30%; 45-55 minutes, liquid B linear gradient from 30% to 100%; for 55 minutes to 60 minutes, the linear gradient of liquid B was maintained at 100%. Liquid A is .1% formic acid aqueous solution, and liquid B was .1% formic acid acetonitrile aqueous solution (84% acetonitrile).
Statistical Analyses
Frequency (percentage) was used to describe categorized data, while mean and standard deviation were used to describe continuous data. A Student’s t-test was used to compare parameters for both groups to identify those with a P-value of .05 or less. Logistic regression models including crude and adjusted models were used to screen clinical demographics factors of AD. T test was used to analyze all material data to screen out substances with significant differences in the comparison group. Machine learning models including logistic regression model and random forest model were used for the model construction. ROC curve analysis was used to determine the performance of the models. Correctness of the model was assessed using a calibration curve, and clinical net benefit was assessed using a decision curve.
All data management and statistical analysis were performed by SAS 9.4 and R 4.2.2. All analyses were conducted by bilateral significance test, and the hypothesis tests’ significance level was set as P < .05.
Results
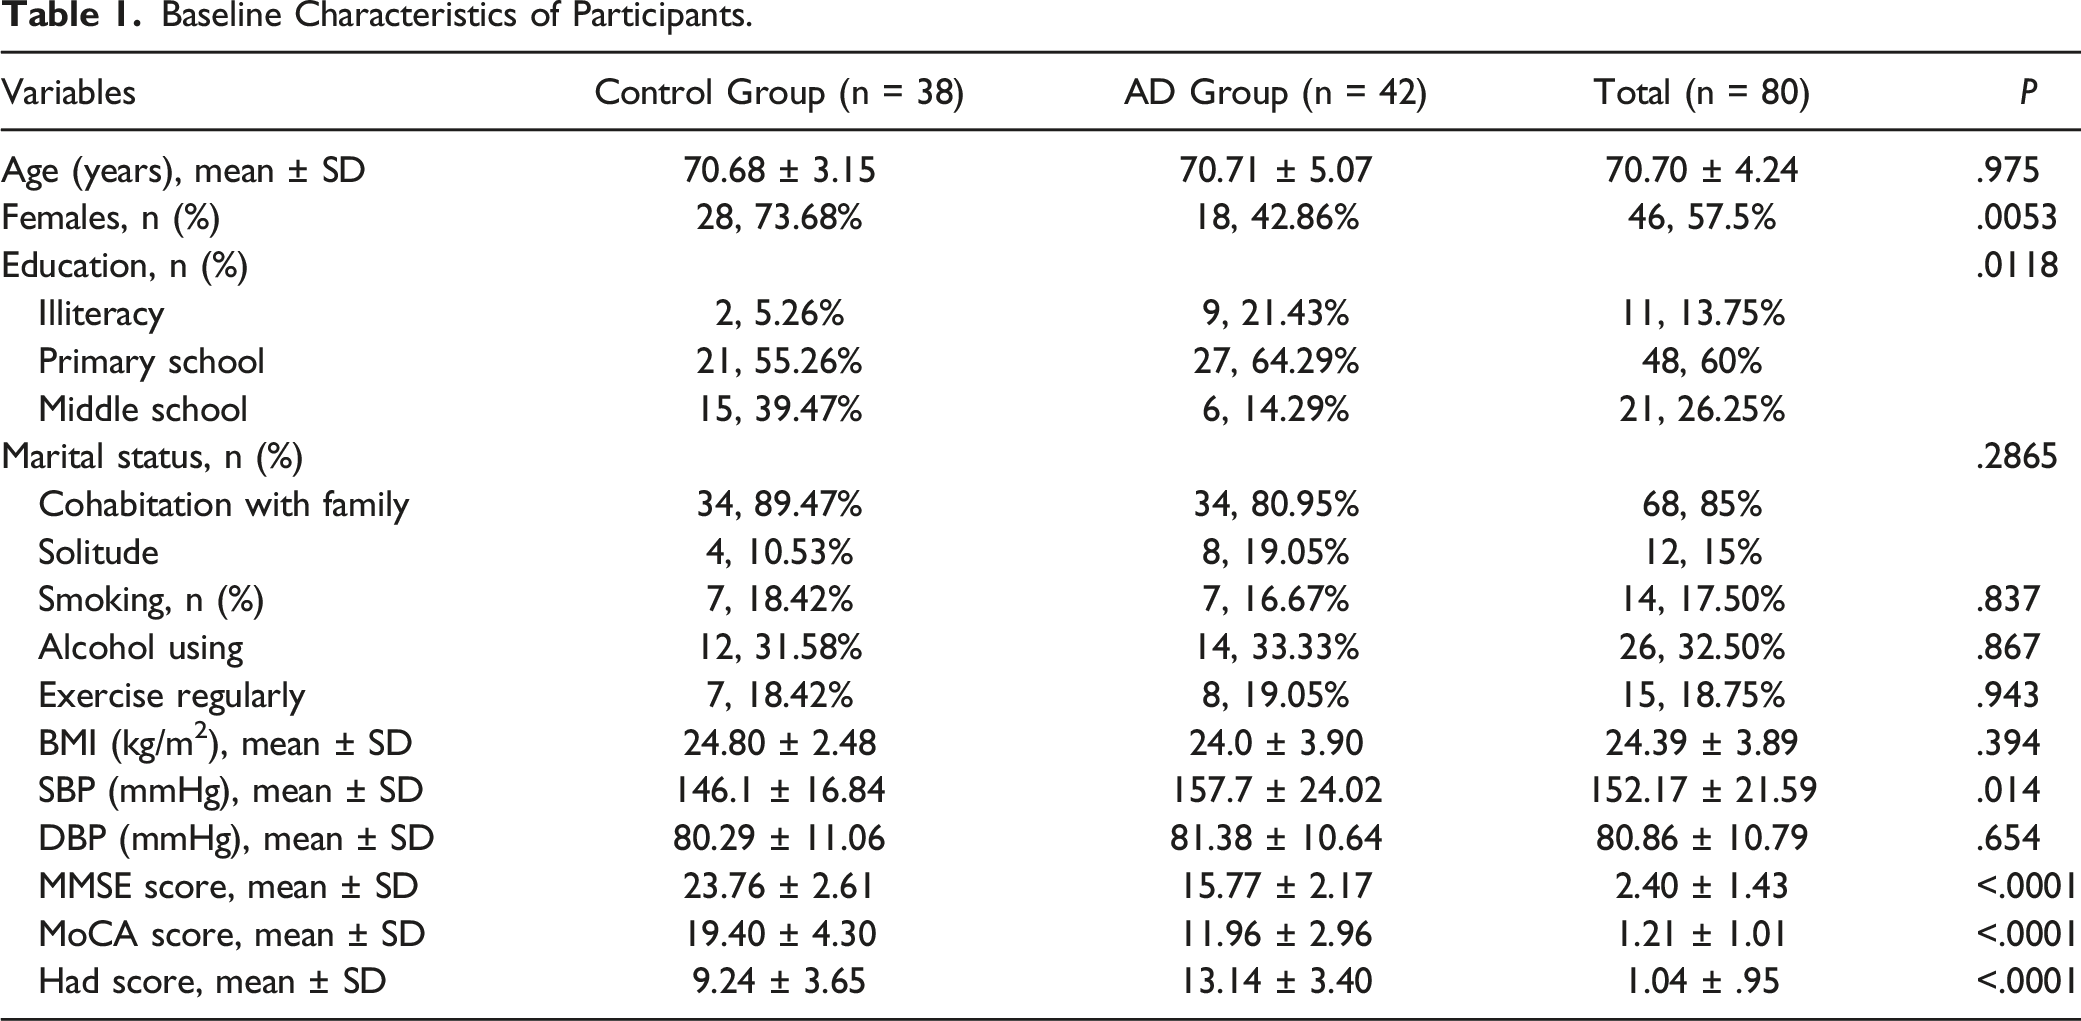
Basic Characteristics of Participants
Baseline Characteristics of Participants.
Predictors of AD
Analysis Results of Target Protein Expression.

Analysis of Predictive Performance of AD-Related Biomarkers.
Construction and Evaluation of AD Risk Diagnostic Model
Demographic characteristics including age, gender, education level, smoking, drinking, depression, BMI, marital status were screened by logistic model as risk factors (Supplementary Table 2). Logistic regression model and random forest model were used to evaluate the diagnosis efficiency of proteins (biomarker model), demographics and lifestyles (lifestyle model), and the combination of proteins and demographics variables (combination model). The diagnostic models constructed was evaluated through ROC analysis, which was shown in Figure 2. The combination model showed a high diagnostic effectiveness, and the logistic regression model was superior to random forest model. The results showed that the model with protein had a high efficiency. According to the internal validation of the model, the curve shows that the diagnosis model has a good fit to the real scenario (Figure 3). The decision curve was used to evaluate the clinical net benefit, patients would acquire more benefit from the multiple markers models than from a lifestyle model (Figure 4). ROC plots for diagnostic models using both logistic regression analysis (left panel) and random forest (right panel). Comparison of the prediction of AD using the best diagnostic model vs actual disease status. Decision curve of the clinical diagnosis model.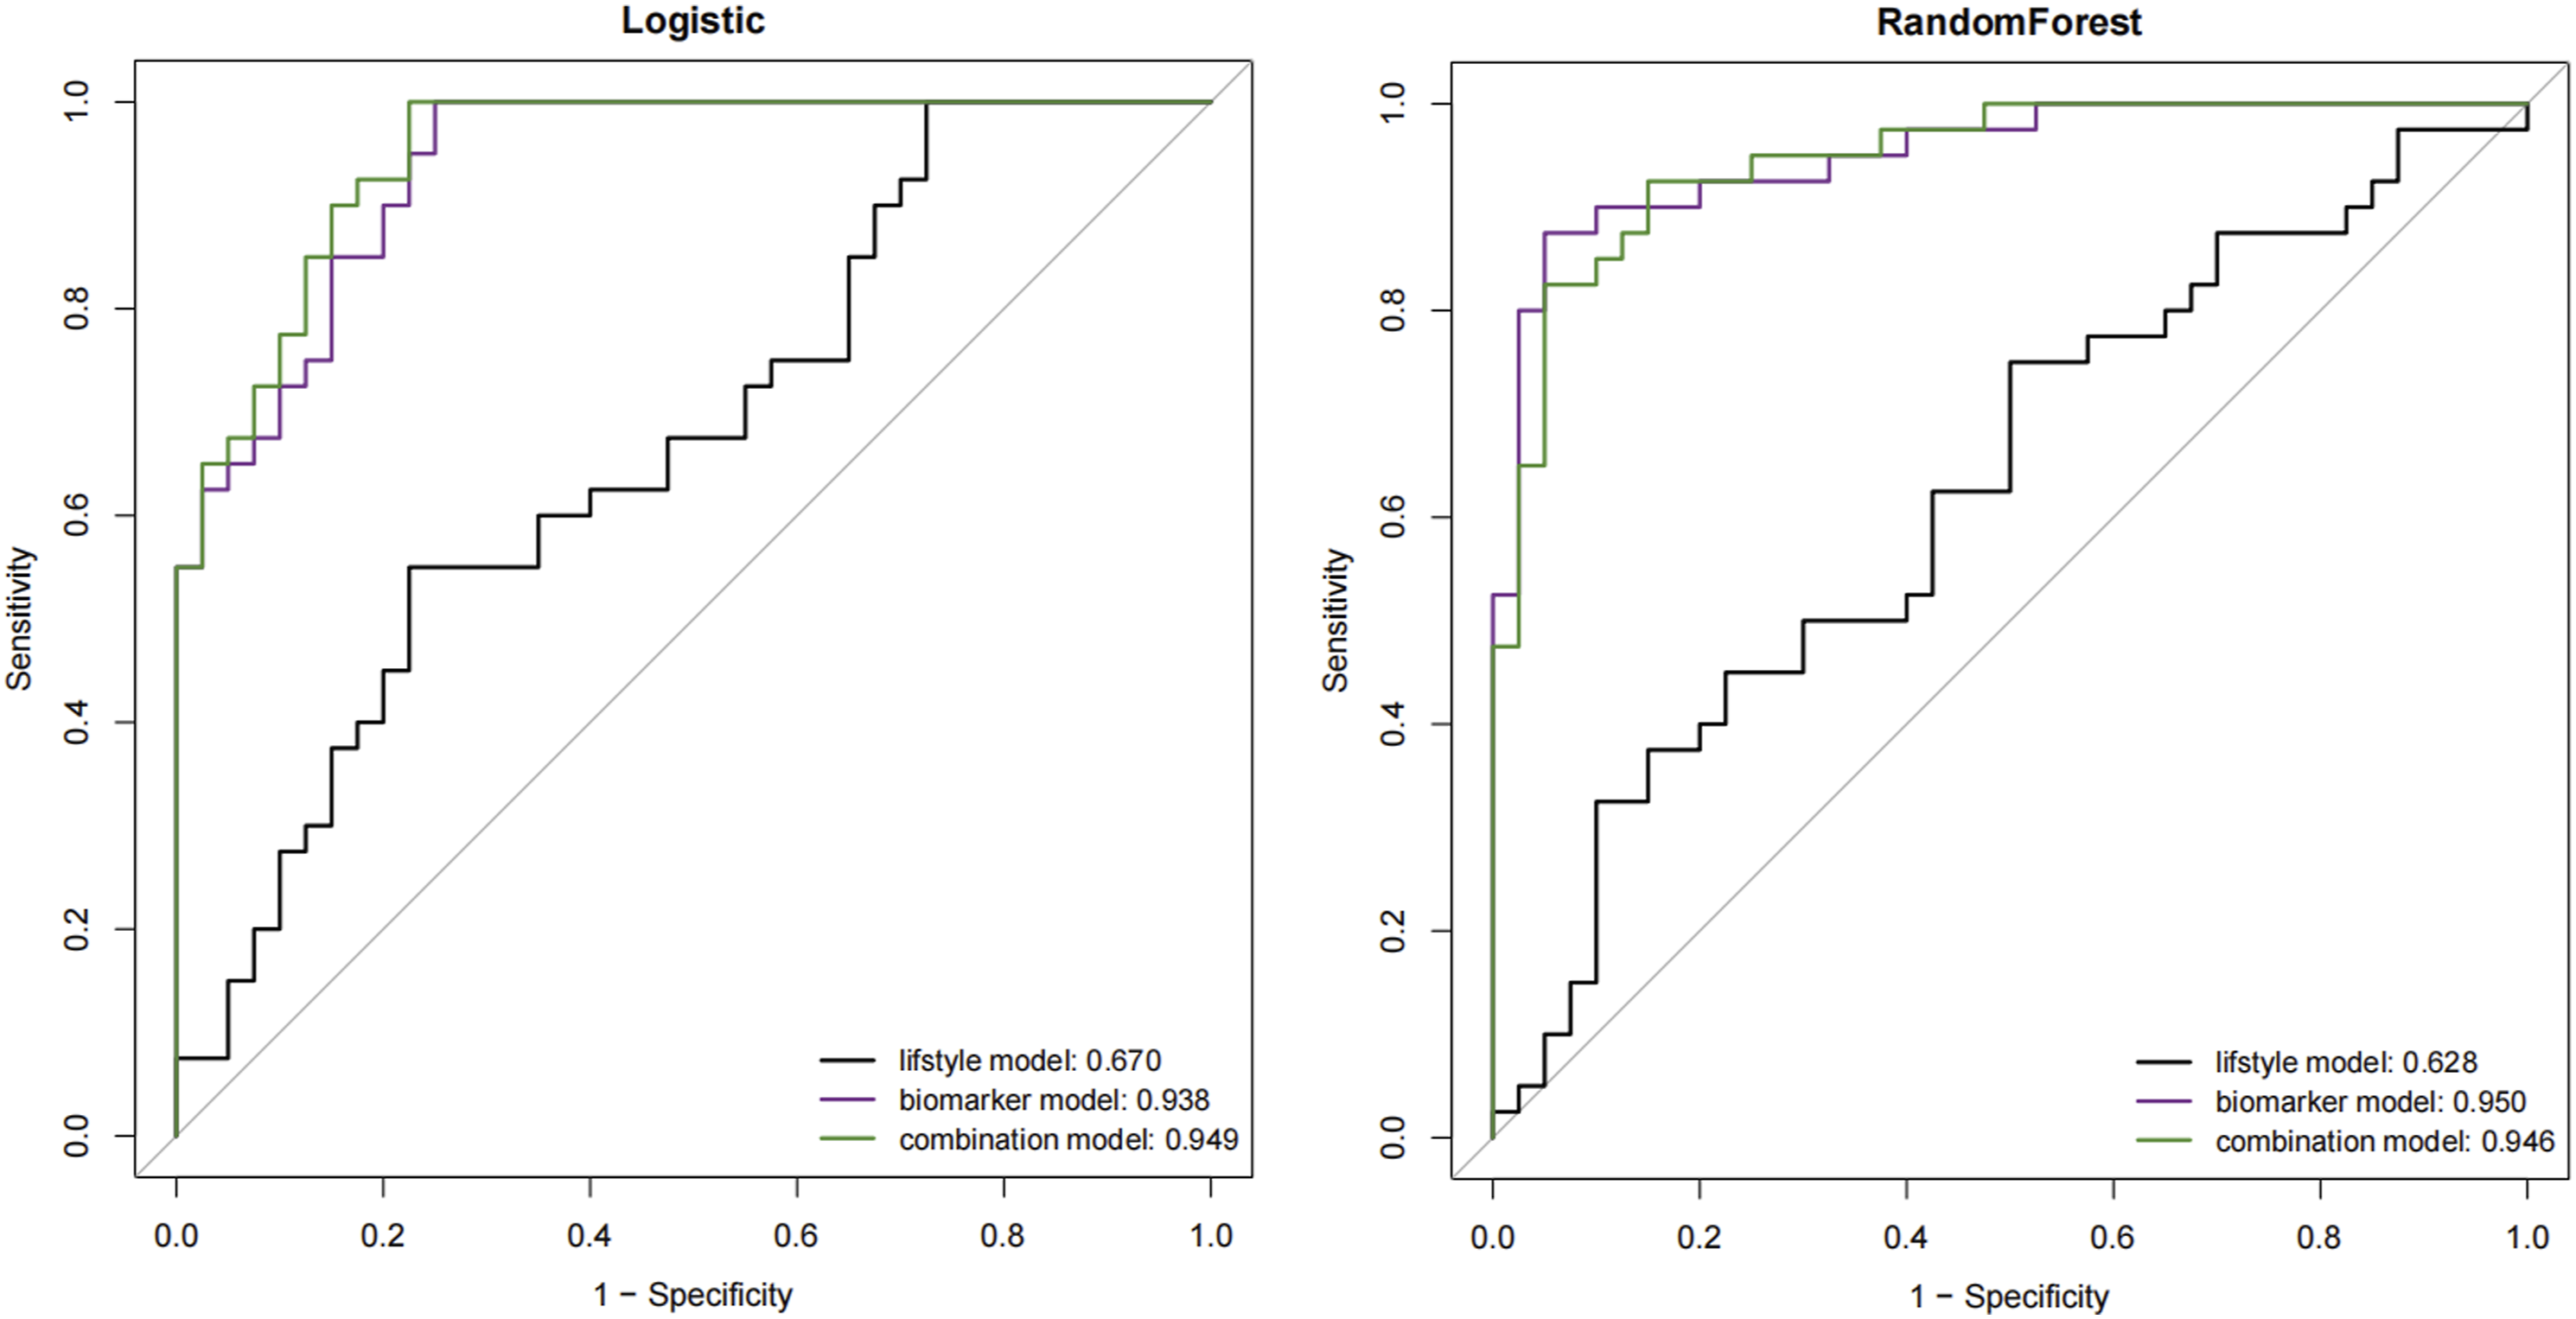


Discussion
AD is a multi-stage disease, and it is hoped that low-cost, fast execution and easy to repeat detection methods can be established to replace neuroimaging, cerebrospinal fluid analysis or neurophysiological detection, which will have more clinical practical significance.7,8 In the past decade, there have been great advances in omics compounding techniques, making it possible to screen biomarkers.9,10 In addition, more advanced estimation methods, including machine learning algorithms, contributed to the study of this minimally invasive screening method. Based on previous epidemiological and bioinformatics studies and PRM targeted proteome detection techniques, this study studied serum-based AD biomarkers in an attempt to determine an economical, rapid and reliable method for early diagnosis of AD.
In this study, eight protein markers were screened, including SAA4, PPBP, PF4, APOA4, F10, CPB2, C1S and IGHM. Demographic characteristics markers including age, gender, education level, smoking, drinking, depression, BMI, marital status were screened as risk factors, which were consistent with other research findings.
SAA4 (Serum Amyloid A4), Wendy E et al studied unlabeled protein profile analysis of cerebrospinal fluid in non-neurodegenerative controls and patients with dementia, and found several potential new markers of neurodegenerative diseases, including SAA4. 11 PF4 (PF4 Factor 4) is associated with the risk of vascular events such as stroke, infarct size and other clinical course, and concentrations of PF4 are associated with an increased risk of SVD progression at any level of radioactivity and with progression of white matter damage.12–14 APOA4 (Apolipoprotein A4) is genetically associated with the risk of AD. APOA1, APOC3 and APOA4 genes are closely linked and located on human chromosome 11, which is associated with AD. 15 C1s (Complement C1s) is a polymorphic gene complement protein associated with AD, CR1 deficiency has been confirmed in AD brains. 16 IGHM is Immunoglobulin Heavy Constant Mu (IGHm), the upregulation of AD and MCI inflammation has been confirmed in both the central nervous system and plasma. 17 One study used bioinformatics tools to study the function and interaction of dysproteins to identify candidate proteins of MCI and AD. Isobaric labeling results showed that IGHM in patients with MCI and AD was significantly higher than that in normal plasma, which may be an excellent target for multiple biomarker analysis.
To achieve a better diagnostic effectiveness, we also add some clinical demographic characteristics into the model, including the age, gender, education level, smoking, drinking, depression, BMI, marital status. The developed panel that combined eight protein biomarkers with demographics markers showed high sensitivity and specificity, suggesting its applicability as an AD diagnostic strategy. While previous studies have also examined blood-based biomarkers as a method of detecting AD, identifying a panel of biomarkers that is highly effective is still challenging. A previous study identified 18 plasma proteins to identify AD cases with high specificity, 18 while another identified 22 serum proteins utilizing the random forest method. 7
Petra et al established a prediction model based on CSF biomarker-like protein β42, cerebrospinal fluid phosphorylate protein tau181, and gender to predict the probability of AD in a memory clinical population with suspected dementia (AUC = .85). 19 Yuan et al discussed the diagnostic value of multi-visual scoring scale based on structural MRI for AD in Chinese population, and the accuracy rate of distinguishing AD cases from healthy controls was .68∼.80 (mild AD) and .77∼.90 (moderate AD ∼ severe AD), respectively. 20 Kuang et al used different methods to model the MCI development of ad. The first five important predictors of the artificial neural network (ANN) model were ADL score, age, urinary AD-related neural filament protein, alcohol consumption and smoking. decision tree (DT) models were age, daily living ability score, family history of dementia, urinary AD-related neurofilament protein and alcohol consumption. The predictors determined by logistic regression model were age, gender, score of daily living activities, alcohol consumption and smoking status. 21
The study had several limitations. First of all, this study did not include cases of Mild cognitive impairment (MCI), and the sample size was relatively small. Secondly, our study was a cross-sectional survey, which made it difficult to establish cause-and-effect relationships, and there was no external validation of the model in this study, validation and optimization of the prediction model need to be carried out in future studies. And also, we didn’t include the information of medications use and how many years of AD has been diagnosed, it was possible that differences in protein levels in the blood might simply be due to another disease process or the drugs used to treat it. Finally, post-translational modifications of targeted proteins could determine whether the target protein was modified or not, compared with conventional PRM, and the work would be carried out in the future.
Conclusion
Our study developed a novel approach including of protein and demographic characteristics, that could be used to distinguish AD from control candidates, thus providing an additional approach that can be used to complement classical neuroimaging. It is hoped that these results will provide further insights into the applicability of serum-based screening methods in future studies, and aid in the development of low-cost, less invasive methods to diagnose and monitor the progress of AD. This study can provide reference for the early screening and diagnosis of AD.
Supplemental Material
Supplemental Material - Serum Protein-Based Profiles for the Diagnostic Model of Alzheimer’s Disease
Supplemental Material for Serum Protein-Based Profiles for the Diagnostic Model of Alzheimer’s Disease by Li Yang, Liang He, Zhibin Bu, Cheng Xuan, Caiyan Yu, and Jiong Wu in American Journal of Alzheimer’s Disease & Other Dementias®.
Footnotes
Author Contributions
Jiong Wu conceived the project, designed the experiments, and Li Yang wrote the manuscript. Liang He, Zhibin Bu performed all the experiments. Liang He analyzed the data and prepared the figures. Cheng Xuan, Caiyan Yu investigated subjects and collected data. All authors reviewed the manuscript.
Declaration of Conflicting Interests
The authors declared no potential conflicts of interest with respect to the research, authorship, and publication of this article.
Funding
The author(s) disclosed receipt of the following financial support for the research, authorship, and/or publication of this article: This project was funded by the Medical Science and Technology Project in Zhejiang Province (2022RC005, 2023KY443), Key Project of TCM Science and Technology Plan in Zhejiang Province (GZYZJKJ23042), Zhejiang Basic Public Welfare Research Project (TGY23H020012, LGF22H090017), Zhejiang Province Health Key Science and Technology Plan Project (WKJ-ZJ-2413).
Data Availability Statement
Data sharing not applicable to this article as no datasets were generated or analyzed during the current study.
Supplemental Material
Supplemental material for this article is available online.
References
Supplementary Material
Please find the following supplemental material available below.
For Open Access articles published under a Creative Commons License, all supplemental material carries the same license as the article it is associated with.
For non-Open Access articles published, all supplemental material carries a non-exclusive license, and permission requests for re-use of supplemental material or any part of supplemental material shall be sent directly to the copyright owner as specified in the copyright notice associated with the article.