
Abstract
Cerebrospinal fluid (CSF) biomarkers of Alzheimer’s disease (AD), especially Aβ42/t-tau and Aβ42/p-tau, showed high diagnostic sensitivities and specificities. But significant interassay and interlaboratory variabilities hinder the widespread clinical applications of CSF biomarkers. The objective of this study was to validate the diagnostic accuracy of AD-CSF-Index in our local Chinese patients with AD compared to nondemented controls. A total of 36 patients, which included 24 patients with AD and 12 nondemented controls, were recruited. Chinese patients with AD showed higher mean AD-CSF-Indices than nondemented controls (AD = 1.25-1.3, normal = 0.62-0.63; P < .001). The AD-CSF-indices have a high sensitivity and specificity of 86.4% to 90.9% and 83.3%, respectively, in differentiating patients with AD from nondemented controls. After selecting the patients with “pure AD” and “pure normal” controls, the AD-CSF-indices have a high sensitivity and specificity of 94.1% and 90%, respectively, in differentiating patients with AD from nondemented controls. Most importantly, our AD-CSF-indices cutoff was highly similar to that reported in Western studies.
Introduction
Alzheimer’s disease (AD), which is the most common type of dementia, is characterized pathologically by the presence of amyloid plaques and neurofibrillary tangles. 1 Cerebrospinal fluid (CSF), which directly interacts with the extracellular space in the brain, is the most ideal source of identifying clinically useful biomarkers. The CSF amyloid-β 42 (Aβ42), total tau (t-tau), and phosphorylated tau (p-tau) are well-reported and useful biomarkers in diagnosis of AD. 2 Patients with AD have low Aβ42 and high t-tau and p-tau levels in CSF (typical AD signature). 2 Combined ratios of Aβ42–t-tau and Aβ42–p-tau yield a higher diagnostic accuracy when compared to individual biomarkers. Duits et al reported a sensitivity of 91% to 93% and a specificity of 81% to 84% when using Aβ42/t-tau and Aβ42/ p-tau to diagnose AD in a multicenter study. 3
Unfortunately, the application of these CSF biomarkers is hindered by significant interassay and interlaboratory variabilities. 4,5 It has been found that such interassay and interlaboratory variabilities were as high as 20% to 35%. 4,5 As a result, each laboratory must establish its own reference ranges using locally collected samples from well-characterized patients. Direct transference of cutoff values and reference ranges from 1 laboratory leads to variations in diagnostic accuracy. We have recently determined our own local cutoff of CSF biomarkers in Chinese patients with AD. 6 Great efforts have been done to standardize the process of analysis of CSF biomarkers internationally. The Alzheimer’s Association has established an international quality control (QC) program since 2009 in order to identify the source of variations and implement actions. 4
The AD-CSF-Index, which has a value between 0 and 2, is a novel approach in combining normalized CSF-determined Aβ42, t-tau, and p-tau values for diagnosis of AD. 7 A higher AD-CSF-Index suggests a diagnosis of AD. 7 It has the advantage of discarding the lowest and highest values for which they are less reliable, as they lie near the limits of the linear segment of the calibration curves of the biomarker quantification techniques. 7 There has been a few studies on AD-CSF-Index in Western centers showing very close cutoff and hence cast light of using such an index in harmonizing the interpretation of AD CSF biomarkers in the future. 7,8 In this study, we first determined the AD-CSF-Index in local Chinese populations and validate diagnostic accuracy of AD-CSF-Index in clinically diagnosed patients with AD as compared to nondemented controls. In the second part of this study, we utilize our locally determined CSF biomarker cutoffs with or without the help of Pittsburgh Compound B (PIB)–Positron Emission Tomography (PET) to identify patients with “pure AD” and “pure normal” controls and redetermined AD-CSF-Index cutoffs, as we do not have autopsy confirmations in our Chinese populations.
Materials and Methods
Study Population
In summary, our study population consisted of 24 CSF samples from patients with dementia having clinically probable AD and 12 CSF samples from nondemented controls (without pathological confirmation). The study populations were recruited from Memory Clinic, Queen Mary Hospital, the University of Hong Kong. A detailed description of the study population has been published previously. 6
Clinical Diagnostic Criteria
Dementia was diagnosed based on the Diagnostic and Statistical Manual of Mental Diseases (Fourth Edition) criteria. 9 Probable AD was diagnosed by the National Institute of Neurological Communicative Disorders and Stroke-Alzheimer Disease and Related Disorders Association criteria. 10 The nondemented controls were recruited based on the absence of cognitive impairment on full cognitive assessments including detailed interview of close relatives regarding the patient’s premorbid cognitive status, through clinical examination, Mini-Mental State Examination (Cantonese Version), 11 and Alzheimer’s Diseases Assessment Scale Cognitive Subscale. 12
Criteria for Pure AD and Pure Normal
We have recently determined our local cutoff of CSF t-tau, p-tau, Aβ42, Aβ42/t-tau, and Aβ42/ p-tau in differentiating patients with AD from nondemented controls. 6 Because of the absence of pathological studies in our study populations, we mimicked “pathological confirmation” using our locally determined CSF biomarkers of t-tau, p-tau, Aβ42, Aβ42/t-tau, and Aβ42/p-tau with or without the pathological and functional imaging based on the PiB–PET imaging. 13 Patients with pure AD must fulfill all the local AD CSF biomarkers cutoffs or show significant amyloid loading on the PiB–PET imaging. Pure normal patients must not fulfill all the local AD CSF biomarkers cutoffs. Consequently, we identified 17 patients with pure AD and 10 pure normal patients. In all, 2 pure normal patients had normal PiB–PET imaging; the remaining 8 patients did not undergo PiB–PET brain imaging.
Analyses of CSF
The CSF samples were obtained by lumbar punctures (LP) and collected in polypropylene tubes. The collected CSF samples were then centrifuged for 10 minutes at 2500 rpm at 4°C. All CSF samples were then stored (in aliquots) in polypropylene vials at −80°C until analyses. The CSF tau, p-tau, and Aβ42 were determined by commercial enzyme-linked immunosorbent assay kits (INNOTEST; Innogenetics NV, Belgium). A complete description of the CSF analysis has been described previously. 6
Calculation of AD-CSF-Index
The AD-CSF-Index was calculated as reported previously.
7,8
The index was calculated from each patients’ Aβ42, t-tau, and p-tau values using the following formulae:
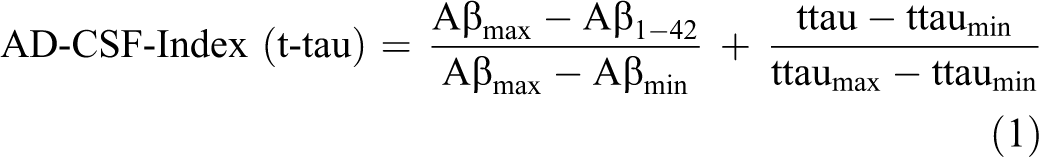
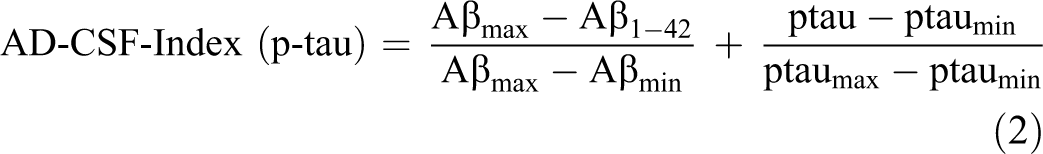
Aβmax, ttaumax, and ptaumax represent the 95th percentile of the respective values, and Aβmin, ttaumin, and ptaumin represent the 5th percentile of the respective values. The 5th and 95th percentiles were calculated using each of the studied populations.
Statistical Analyses
Demographic variables were compared using independent sample t test or Mann-Whitney U test as appropriate. To compare the gender distribution between the 2 groups, a chi-square test was performed. Receiver–operating characteristic (ROC) curve analysis was used to define optimal cutoff values to discriminate between patients with AD and controls. The cutoff values were defined as the maximal sum of sensitivity and specificity. We used the SPSS software (version 17.0; SPSS Inc, Chicago, Illinois) for all data analyses and the MedCal program (version 9.4.2; Schoonjans, Belgium) for the ROC curve analyses.
Results
Table 1 shows the demographic characteristics of our cohort as well as the median values of CSF t-tau, p-tau, Aβ42, Aβ42/t-tau, and Aβ42/ p-tau. We have also listed the 5th and 95th percentiles of CSF t-tau, p-tau, and Aβ42 for the determination of AD-CSF-Indices. There were significant differences in CSF t-tau, p-tau, Aβ42, Aβ42/t-tau, Aβ42/ p-tau, AD-CSF-Index t-tau, and AD-CSF-Index p-tau between patients with AD and nondemented controls (all P < .001 except P = .022 for CSF Aβ42). The diagnostic power of the CSF t-tau, p-tau, Aβ42, Aβ42/t-tau, Aβ42/p-tau, AD-CSF-Index t-tau, and AD-CSF-Index p-tau was calculated using ROC analyses and is summarized in Table 2. The Aβ42/t-tau, Aβ42/p-tau, and AD-CSF-Index p-tau showed better combination of sensitivities and specificities as compared with the individual biomarkers.
Demographic and Biomarkers’ Data of our Cohort.
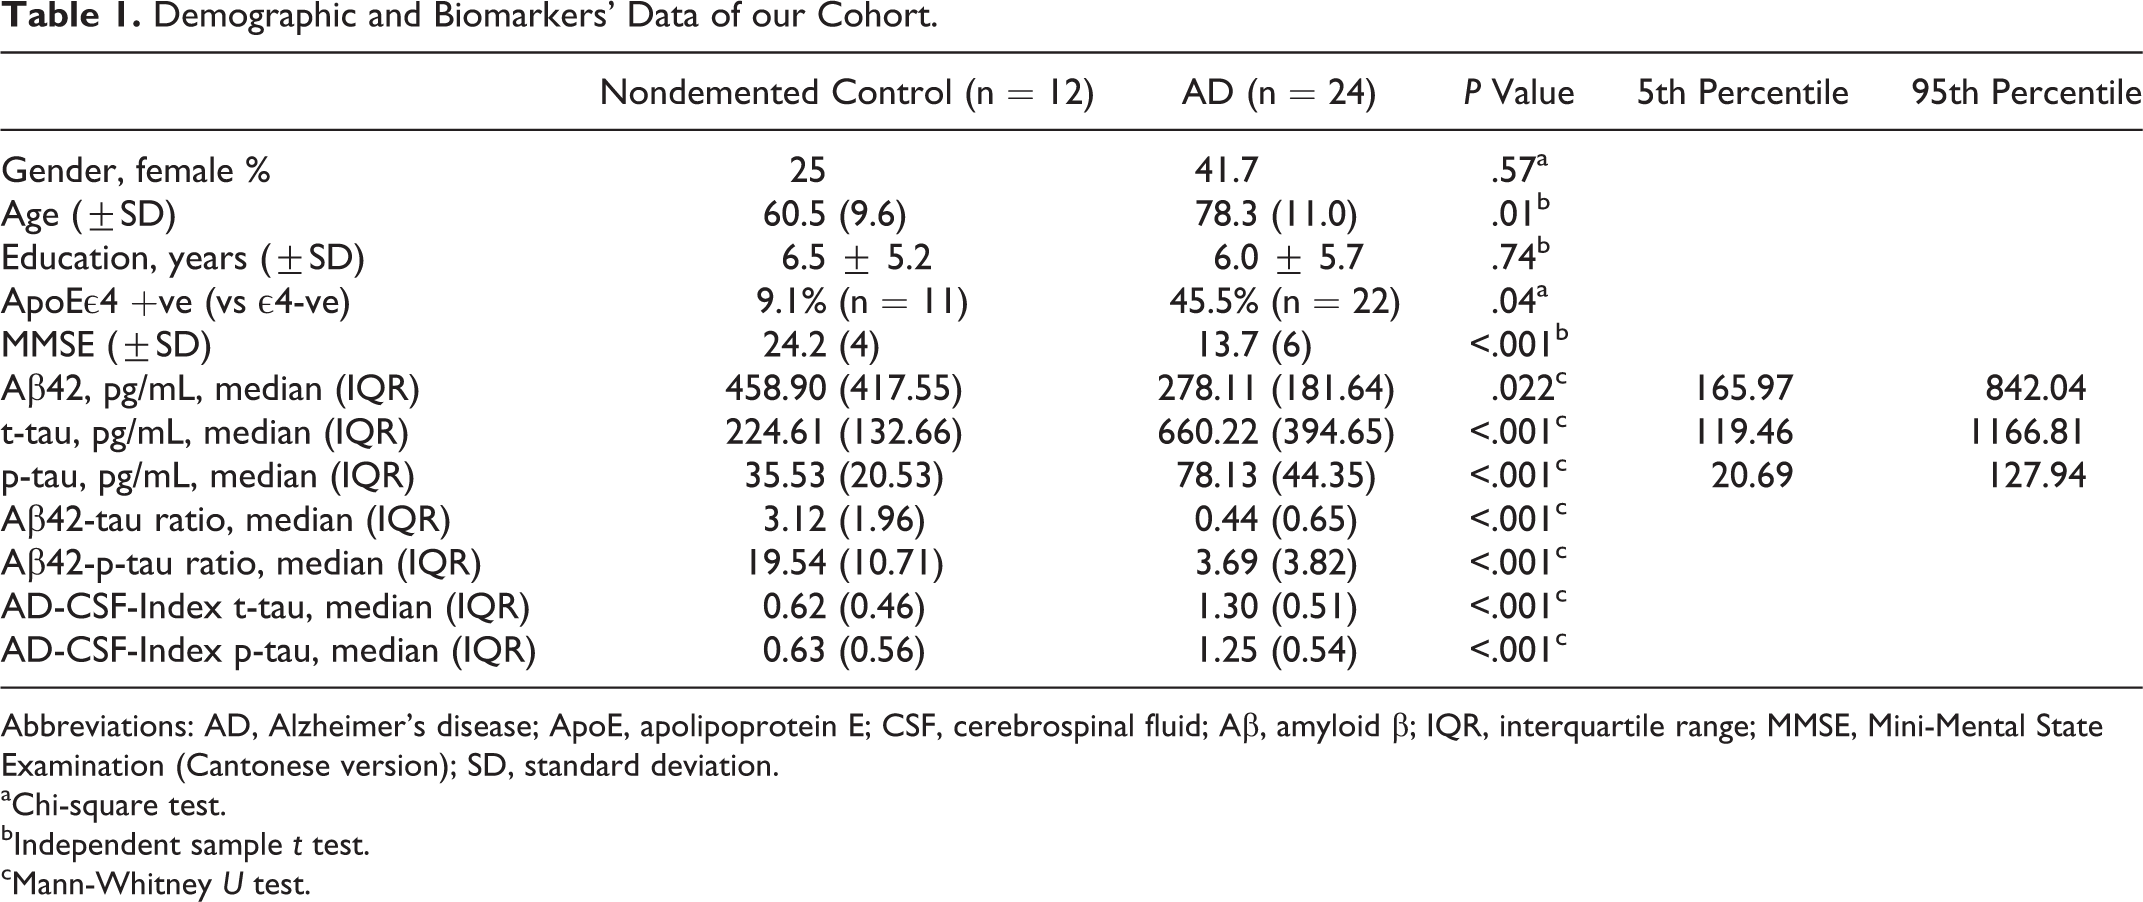
Abbreviations: AD, Alzheimer’s disease; ApoE, apolipoprotein E; CSF, cerebrospinal fluid; Aβ, amyloid β; IQR, interquartile range; MMSE, Mini-Mental State Examination (Cantonese version); SD, standard deviation.
aChi-square test.
bIndependent sample t test.
cMann-Whitney U test.
Diagnostic Power of the AD-CSF-Indices When Compared to Existing Models by Means of ROC analysis.
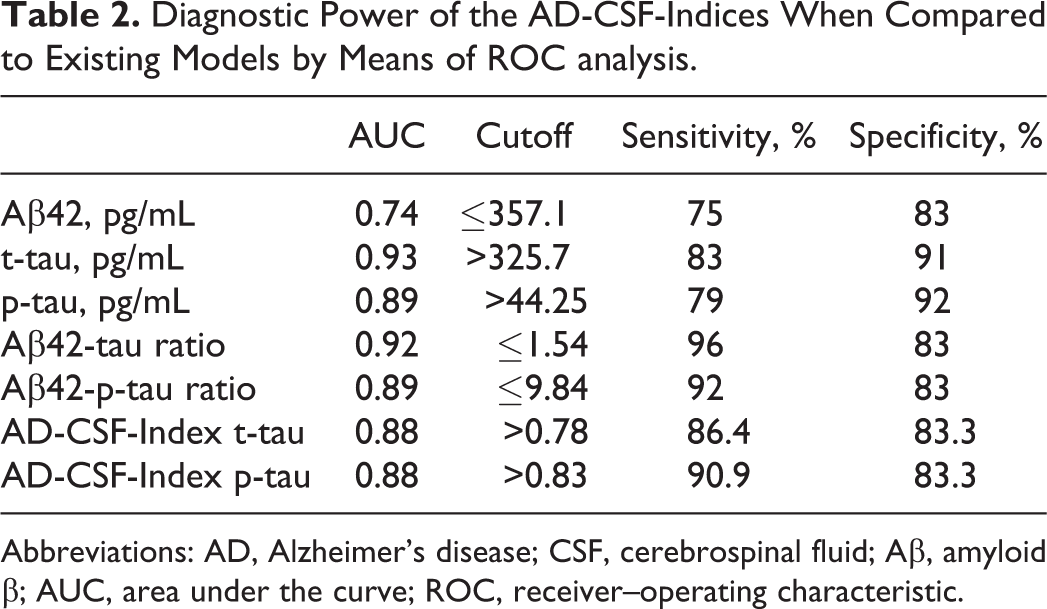
Abbreviations: AD, Alzheimer’s disease; CSF, cerebrospinal fluid; Aβ, amyloid β; AUC, area under the curve; ROC, receiver–operating characteristic.
Table 3 shows the demographic characteristics of the patients with pure AD and pure normal patients as well as the median values of CSF t-tau, p-tau, Aβ42, Aβ42/t-tau, and Aβ42/p-tau. Two patients in the initial nondemented group were discarded because of elevated p-tau and low Aβ42, respectively. Seven patients in the initial AD group were discarded as 5 had normal Aβ42, 1 had normal Aβ42 and p-tau, and 1 had normal Aβ42, t-tau, and p-tau. We have also listed the 5th and 95th percentiles of CSF t-tau, p-tau, and Aβ42 for the determination of AD-CSF-Indices. There were significant differences in CSF t-tau, p-tau, Aβ42, Aβ42/t-tau, Aβ42/ p-tau, AD-CSF-Index t-tau, and AD-CSF-Index p-tau between patients with pure AD and pure normal patients (all P < .001, except P = .001 for Aβ42). The diagnostic power of the CSF t-tau, p-tau, Aβ42, Aβ42/t-tau, Aβ42/p-tau, AD-CSF-Index t-tau, and AD-CSF-Index p-tau was calculated using ROC analyses and is summarized in Table 4. The Aβ42/t-tau, Aβ42/ p-tau, AD-CSF-Index t-tau, and AD-CSF-Index p-tau showed better combination of sensitivities and specificities as compared with the individual biomarkers.
Demographic and Biomarkers’ Data of “Pure AD” and “Pure Normal” Patients.
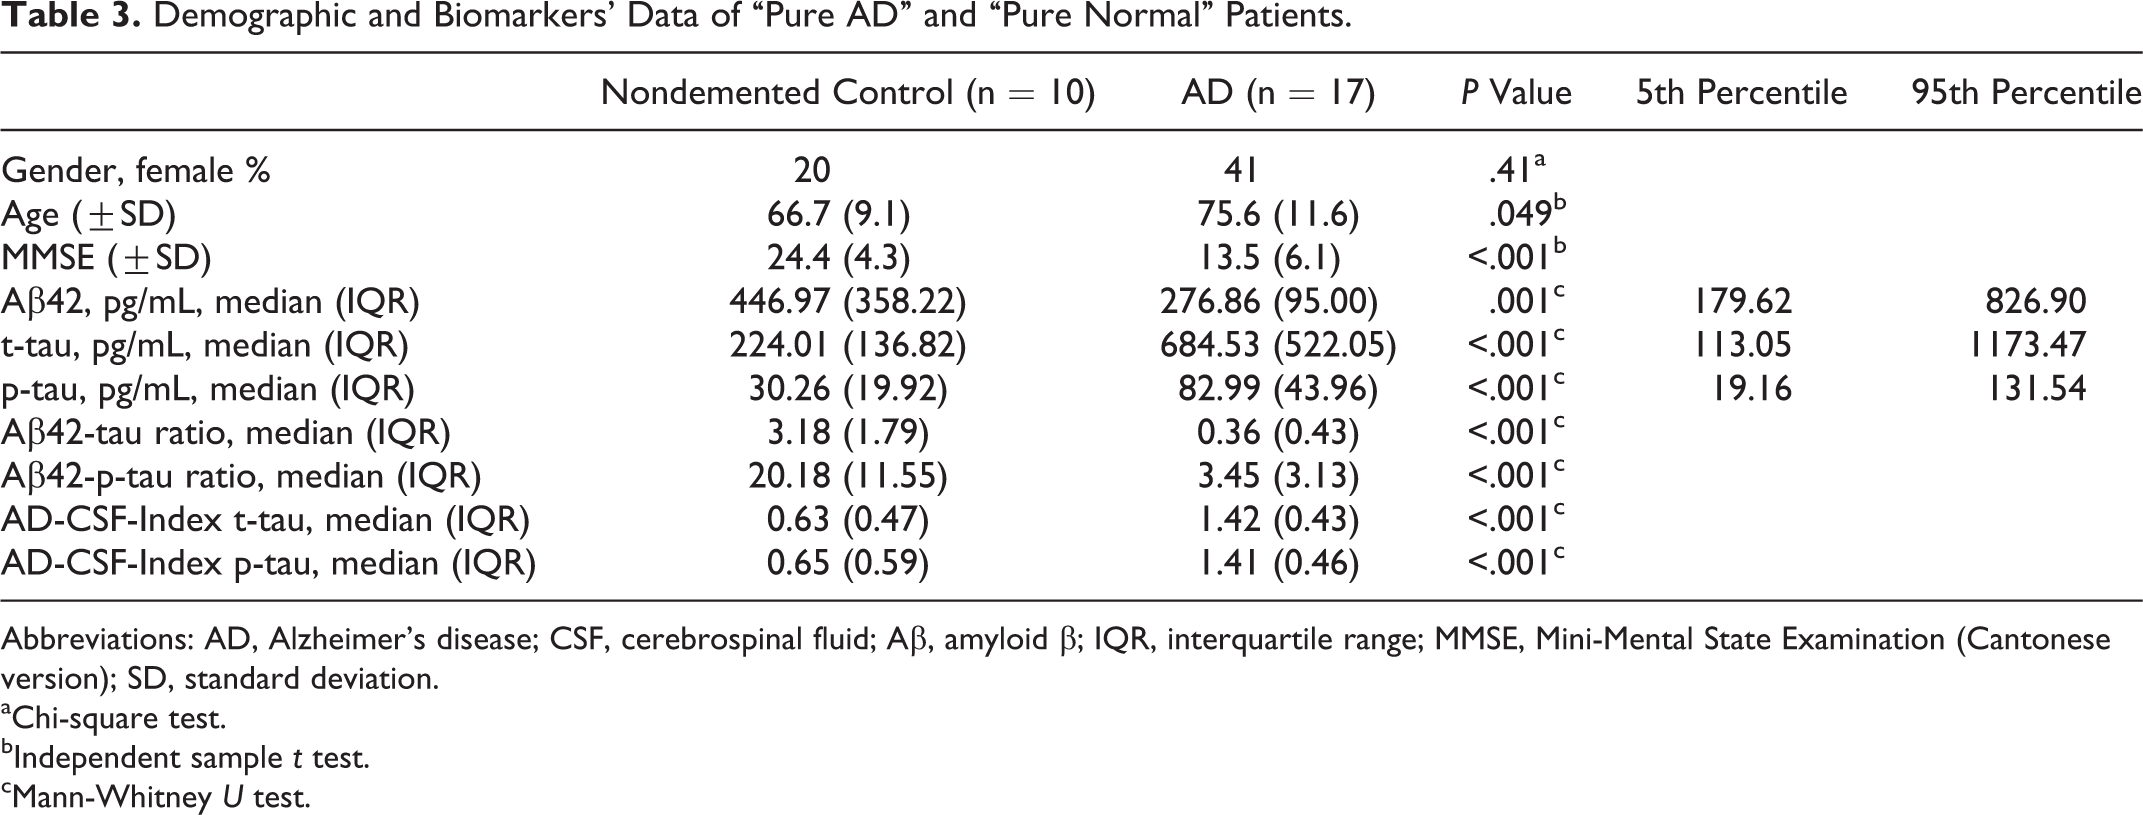
Abbreviations: AD, Alzheimer’s disease; CSF, cerebrospinal fluid; Aβ, amyloid β; IQR, interquartile range; MMSE, Mini-Mental State Examination (Cantonese version); SD, standard deviation.
aChi-square test.
bIndependent sample t test.
cMann-Whitney U test.
Diagnostic Power of the AD-CSF-Indices When Compared to Existing Models by Means of ROC Analysis With “Pure AD” and “Pure Normal” Patients.
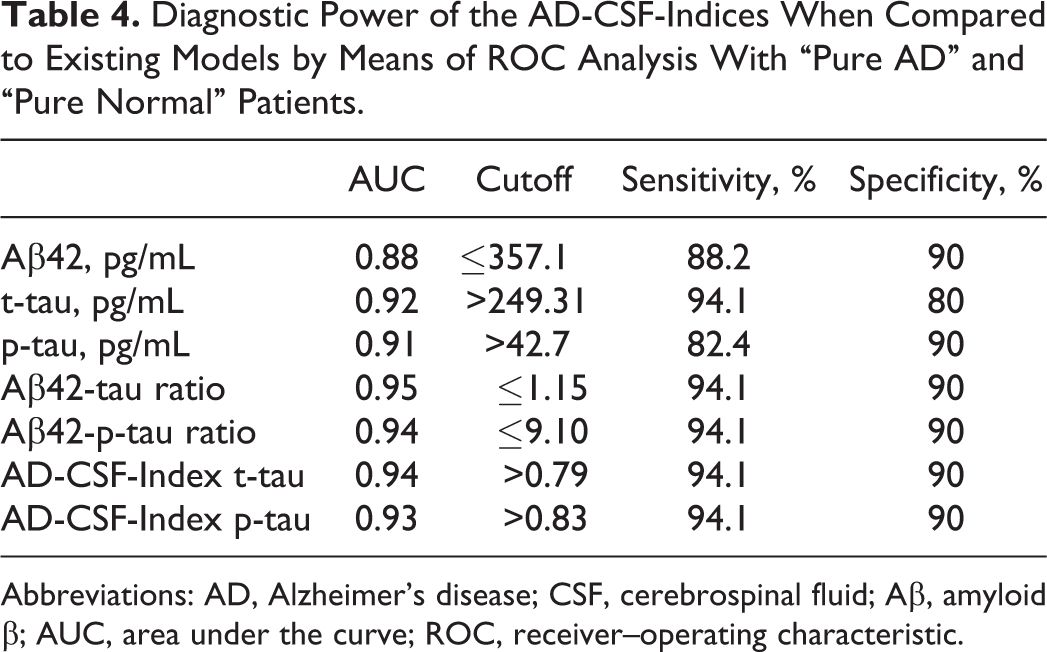
Abbreviations: AD, Alzheimer’s disease; CSF, cerebrospinal fluid; Aβ, amyloid β; AUC, area under the curve; ROC, receiver–operating characteristic.
Discussion
Our results confirmed that local Chinese patients with AD have a significantly higher AD-CSF-Index than nondemented controls, a finding that was shown previously by other studies. 7,8 The AD-CSF-Indices showed a high sensitivities and specificities with satisfactory area under the curve values for discriminating patients with AD from nondemented controls. We have summarized our cutoffs of AD-CSF-Indices and compared them with those of the Western studies in Table 5. Despite the great variations in the range of cutoffs for CSF t-tau, p-tau, Aβ42, Aβ42/t-tau, and Aβ42/ p-tau, CSF-AD Indices showed a very narrow range between 0.74 and 0.83. Our results add more evidences that the AD-CSF-Index is potentially useful in harmonizing the interpretation of AD CSF biomarkers. To our understanding, this is also the first study in validating AD-CSF-Index in the Chinese population.
A Comparison of Previously Reported t-tau, p-tau, Aβ42, Aβ42/t-tau, Aβ42/ p-tau, AD-CSF-Index t-tau, and AD-CSF-Index p-tau Cutoffs Between Current Study and Previous Studies.
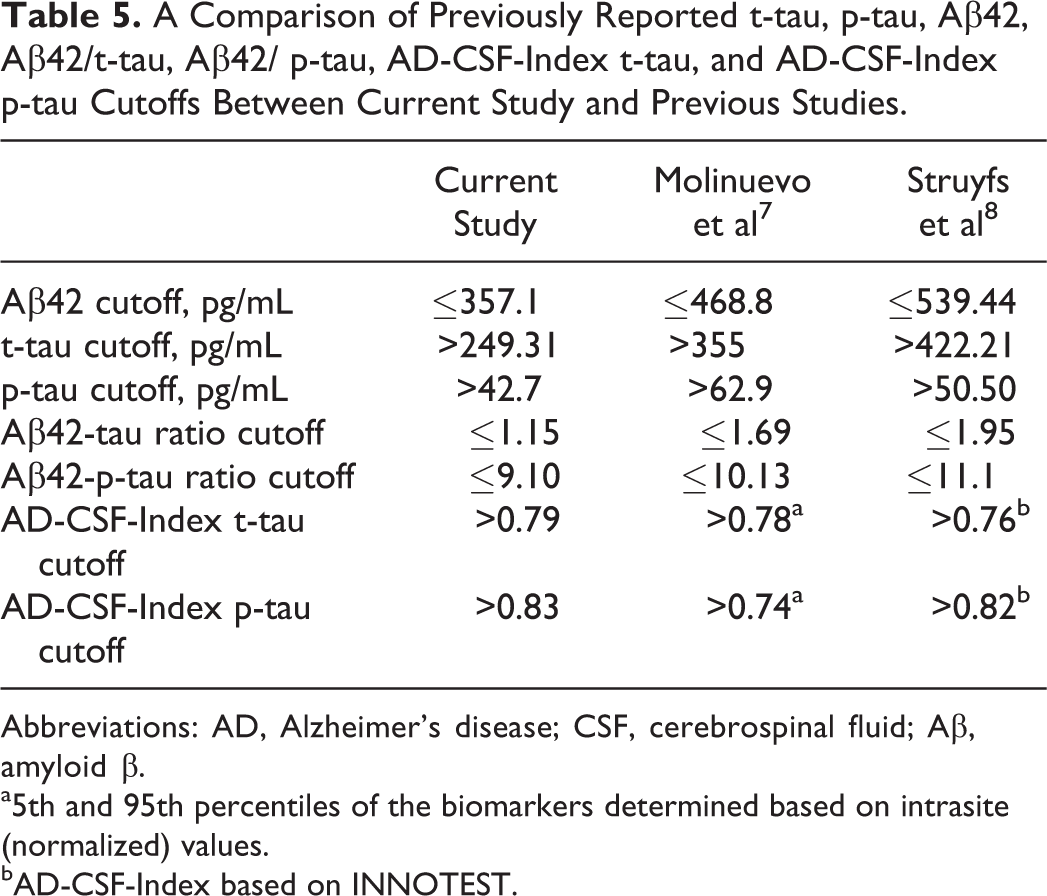
Abbreviations: AD, Alzheimer’s disease; CSF, cerebrospinal fluid; Aβ, amyloid β.
a5th and 95th percentiles of the biomarkers determined based on intrasite (normalized) values.
bAD-CSF-Index based on INNOTEST.
Our study was unable to show AD-CSF-Indices having the best combination of sensitivity and specificity as compared with Aβ42/t-tau and Aβ42/p-tau. There are several possible reasons. Our patients were diagnosed based on clinical criteria but without pathological confirmation. We have attempted to solve this problem by using our own locally determined cutoffs to select patients with pure AD and pure normal patients with/without the support of PIB–PET in some of the patients. In addition, our cohort has a small number of patients, as Chinese patients or their relatives were very reluctant to undergo LP for CSF biomarkers’ measurement. It is most likely because of misconception of having high risks of complications for LP. 5 Previous studies have reported post-LP headache of less than 2% which is similar to a risk of headache of 1.8% with amyloid PET. 5 Other commonly reported complications include vasovagal symptoms of 0.9% and local back soreness of 3%. 14 Perhaps better education of our patients with time will increase the acceptance of LP in the future. Our study was cross sectional in design, and the predictive capacity of AD-CSF-Index in predicting deterioration to dementia could not be addressed. In future, a study with a larger sample size of Chinese patients with AD and normal patients with amyloid imaging support helps to confirm or improve the current local cutoff of AD-CSF-Index. In addition to the potential usefulness of AD-CSF-Index, international effort in standardizing the preanalytical factors, analytical factors, and reference materials should be continued in order to allow harmonization of analytical methods and plateforms. 7
In conclusion, the AD-CSF-Indices showed high sensitivity and specificity in discriminating Chinese patients with AD from nondemented controls. Our AD-CSF-Indices cutoffs were very similar to other reported Western studies cutoffs, suggesting their potential usefulness in harmonizing interpretation of CSF biomarkers between centers.
Footnotes
Declaration of Conflicting Interests
The authors declared no potential conflicts of interest with respect to the research, authorship, and/or publication of this article.
Funding
The authors disclosed receipt of the following financial support for the research, authorship and/or publication of this article: The project was funded by the Alzheimer’s disease Research Network of SRT on Healthy Aging, The University of Hong Kong.