
Abstract
Introduction
We examined the associations of baseline telomere length (TL) and TL change with cognitive function over time in older US adults, as well as differences by sex and race.
Methods
A total of 1820 cognitively healthy individuals (median baseline age: 63 years) were included. Telomere length was measured using qPCR-based method at baseline and among 614 participants in the follow-up examination 10 years later. Cognitive function was assessed by a four-test battery every 2 years.
Results
In multivariable-adjusted linear mixed models, longer baseline TL and smaller attrition/lengthening of TL over time were associated with better Animal Fluency Test score. Longer baseline TL was also linearly associated with better Letter Fluency Test score. The observed associations were consistently more pronounced in women than men and in Black compared to White participants.
Discussion
Telomere length may be a biomarker that predicts long-term verbal fluency and executive function, particularly in women and Black Americans.
Introduction
Cognitive impairment is common in elderly populations. According to the US Centers for Disease Control and Prevention (CDC), the prevalence of subjective cognitive decline was about 11% among adults aged ≥45 years in 2015-2017; the prevalence was higher in Black (12.8%) compared to White Americans (10.9%), and was higher among men (11.3%) than women (10.6%). 1 As a growing public health issue, cognitive impairment causes healthcare and economic burdens on individuals, families and society. Detection of mild impairment or early changes in cognitive function is critical because early intervention, such as lifestyle modifications, 2 may help slow the process of cognitive decline and its potential progression to severe impairment and dementia. 3 Therefore, identifying biomarkers that can predict cognitive function changes is of great public health significance.
Telomeres are the DNA structures at the end of each chromosome that help protect the chromosome’s stability; with each cell division, the length of telomeres shortens. 4 Emerging evidence has suggested a potential association between telomere length (TL) and cognitive function,5-10 but controversy remains.11-13 The null association reported in some studies may be because only general cognitive ability was assessed, or only 1 measure of cognitive ability was used, while cognitive measurement in different domains may contribute to disparate findings.11,13 We are not aware of any population study that has investigated the association of TL change with cognitive decline in older adults. In addition, to the best of our knowledge, no study has examined sex or race differences in the associations of TL and TL change with cognitive decline, 7 which may partially explain the sex or racial disparities in the rates of cognitive decline.
Therefore, using data from the REasons for Geographic and Racial Differences in Stroke (REGARDS) study – a population-based cohort of Black and White US men and women, we examined the associations of baseline TL and TL change with repeatedly measured cognitive function across different domains. We also examined the differences in associations by sex and race.
Methods
Study Design and Population
REasons for Geographic and Racial Differences in Stroke is an ongoing, population-based, prospective cohort designed to investigate the reasons for racial and geographic disparities in stroke and cognitive impairment in the US. Details of the REGARDS study design have been described previously. 14 Briefly, during 2003-2007, a total of 30 239 Black and White Americans aged ≥45 years were enrolled at baseline. Information on demographic, socioeconomic, and lifestyle factors were collected through telephone interviews. Within a month after the initial telephone interview, an in-home physical examination was performed to collect data on blood pressure, height, weight, and electrocardiogram features. During the examination, blood and urine samples were also collected. Additional information including medical histories and dietary intake at baseline was assessed through self-administered questionnaires and the Block 98 Food Frequency Questionnaire. 14 Participants are followed via phone every 6 months with a primary goal of ascertaining stroke events; cognitive assessments are administered every 2 years also via phone. A second in-home physical examination was conducted in late 2016 with the same protocols. This study was approved by institutional review boards of all REGARDS participating institutions and Columbia University Irving Medical Center (IRB AAAS9507).
To analyze baseline levels of biomarkers including TL, a sub-cohort (n = 2666) of REGARDS participants was randomly selected independent of any disease outcomes at baseline. A fixed sampling probability of 9% was used in each stratum jointly classified by race (Black and White Americans), age (<55, 55-64, 65-74, 75-84, and ≥85 years), sex (women and men), and region of residence (Stroke Buckle, the rest of Stroke Belt, and non-Stroke-Belt region).15,16 In the current analysis, we excluded participants with a history of cognitive impairment, stroke, transient ischemic attack, or cancer prior to baseline or without baseline TL measurement. After these exclusions, a total of 1820 participants were included in the main analyses (Figure 1). Among the 1820 participants, 614 participated in the second in-home physical examination approximately 10 years later and had TL measurement available for us to calculate TL change. Flow chart of study sampling.
Measurement of TL
Fasting blood samples were collected at baseline and at the second in-home physical examination, shipped overnight with ice packs to a central laboratory, and stored at −80°C for reprocessing and analysis. 17 DNA was extracted from the buffy coats of peripheral leukocytes using the Qiagen® QiAamp® Blood Kit in the REGARDS coordinating lab after each blood collection. Genomic DNA quality was assessed by 260/280 optical density ratio. DNA samples with OD 260/280 and 260/230 greater than 1.8 will be used for measuring TL. DNA was stored at −80 refrigerator until measurement of TL. Telomere length was measured using a relative quantitative polymerase chain reaction (qPCR) method. 18 In brief, a delta-delta CT method was used to compare the ratio of telomere repeats and a single-copy gene (β-globin) from each sample to the ratio of a reference genomic DNA sample (Promega, MI, USA). All qPCR assays were performed using a QuantStudio3® system with PowerUp™ SYBR® Green Master Mix (Applied Biosystems, Foster City, CA). The qPCR experiments were performed in a 20 ul reaction system. Each sample was run in triplicate, using 20 ng of DNA. Amplification of telomeres and the single-copy gene (β-globin) were performed in separate runs, using the same well positions. A standard curve was included twice a week using a 5-point series with reference DNA (Human genomic DNA, Sigma, St. Louis, MO, USA). Calculation results showed a PCR efficiency of 100% (±10%) based on the following formula: E = 10^(-1/slope)–1. 19 Laboratory personnel were blinded to study outcomes and participant characteristics. The raw baseline TL has mean 1.026, standard deviation .338, in the range of .189-3.234. Telomere length was further log-transformed and the z-score was calculated and used in the analyses. Telomere length change was calculated as TL at baseline (log-transformed) minus TL in the second in-home physical examination (log-transformed).
Assessment of Cognitive Function
Cognitive function of participants, including global cognitive function and specific domains, was assessed by trained interviewers at baseline as well as during follow-ups. To assess global cognitive function, the Six-Item Screener (SIS) was administered annually starting in December 2003. 20 The SIS measures the recall of a 3-item word list and temporal orientation of year, month, and day of the week, with scores ranging from 0 to 6. To assess learning, memory and executive function, the Consortium to Establish a Registry for Alzheimer’s Disease (CERAD) battery (since 2006), Animal Fluency Test (AFT, since 2006), and Letter Fluency Test (LFT, since 2008) were administered every 2 years during follow-up. CERAD battery includes the Word List Learning (WLL) test and the Word List Delayed Recall (WLD) test, which measure new learning and verbal memory of a 10-item list, respectively; scores range from 0-30 for WLL and 0-10 for WLD. 21 The scores of AFT and LFT are calculated as the number of animals and the number of words beginning with the letter “F” that a participant can name in 60 seconds, respectively; AFT measures semantic fluency while LFT is an indicator of phonemic fluency.22,23 In all tests, lower scores indicate poorer cognitive function (i.e., greater impairment). These measures are included in the vascular cognitive impairment harmonization standards and have been widely used in epidemiological and clinical studies of cognitive aging and impairment. 24 All of these cognitive tests have been validated in a separate sample from the REGARDS cohort. 25 Timeline of TL measurements and cognitive function assessment were described in Supplementary Figure 1.
In this study, the primary outcomes were the domain-specific cognitive function measured by the four-test battery (WLL, WLD, AFT, and LFT). Incident cognitive impairment was considered in a secondary analysis, and defined as having a SIS score ≤4 at the most recent assessment as of September 29, 2018. 26
Assessment of Covariates
The following baseline covariates were considered in our analyses: demographics (age, sex, and race [Black or White]), socioeconomics (education level [<high school, high school graduate, some college, or college graduate and above]), lifestyle factors (smoking status [never- or ever-smoker; pack-years of cigarettes], alcohol consumption [never- or ever-drinker; drinks per week], physical activity [none, 1-3, or ≥4 times per week], Mediterranean diet score, and body mass index [BMI]), clinical risk factors (blood pressure, plasma concentrations of total cholesterol, HDL-cholesterol, LDL-cholesterol, triglycerides, homeostasis model assessment of insulin resistance [HOMA-IR], and C-reactive protein), and medical history (current medication use for hypertension, dyslipidemia, or diabetes, history of heart disease or kidney failure, and incident stroke during follow-up). Information on socio-demographic and lifestyle factors was collected by self-administered questionnaires. The Mediterranean diet score was derived according to previously published methods in REGARDS. 27 Since data on dietary intake is available only in about 80% of REGARDS participants, those with missing Mediterranean diet score were categorized into a separate group, with the rest categorized into quintiles. Body mass index was derived by weight and height measured by trained professionals at the first in-home visit. HOMA-IR was computed as plasma glucose (mg/dL) × insulin (µIU/mL)/405. 28 History of heart disease was defined by electrocardiographic evidence or self-report. History of kidney failure was self-reported.
Statistical Analyses
All analyses were performed using SAS version 9.4 (SAS Institute, Cary, NC, USA), and a two-sided P value of <.05 was considered statistically significant. Baseline characteristics of the study participants were summarized using medians (inter-quartile ranges) for continuous variables and counts (proportions) for categorical variables. Differences in characteristics across baseline TL quartiles were tested using Kruskal-Wallis test or chi-squared test, as appropriate.
To examine the associations between baseline TL quartiles and time-averaged scores of WLL, WLD, AFT, and LFT, linear mixed models were fitted to examine scores after the first assessment with a Variance Components covariance structure. Similar to prior REGARDS reports, no random effects accounting for time between tests were included. 29 The models were adjusted for the scores of first cognitive assessments, years since baseline when the assessment was performed, and aforementioned covariates. Multivariable-adjusted mean differences and 95% confidence intervals (95% CIs) were reported with quartile 1 of TL (shortest TL) being the referent. Linear trend was tested using TL as a continuous variable. In the secondary analysis of baseline TL and incident cognitive impairment, a logistic regression model was conducted to estimate the multivariable-adjusted odds ratio (OR) and 95% CI.
Telomere length change was categorized into quartiles. Quartile 1 to 3 of TL change were compared with quartile 4 (largest attrition). Linear mixed models with a Variance Components covariance structure and no random effects were performed with additional adjustment for baseline TL. Linear trend was tested using TL change as a continuous variable.
In addition, the cross-product terms of baseline TL or TL change with each effect modifier (i.e. sex or race) were included in the models to test the significance of interaction, with P values of interaction <.05 were considered statistically significant. We also conducted stratified analyses. In each sex or race subgroup, mean differences (95% CIs) of cognitive test scores per standard deviation increase in TL were reported for baseline TL, while mean differences (95% CIs) comparing quartile 1 (smallest attrition/no change/slight increase) of TL change to quartile 4 (largest attrition, referent) were reported.
Results
Baseline Characteristics of the Study Population By Telomere Length Quartiles (n = 1820). a
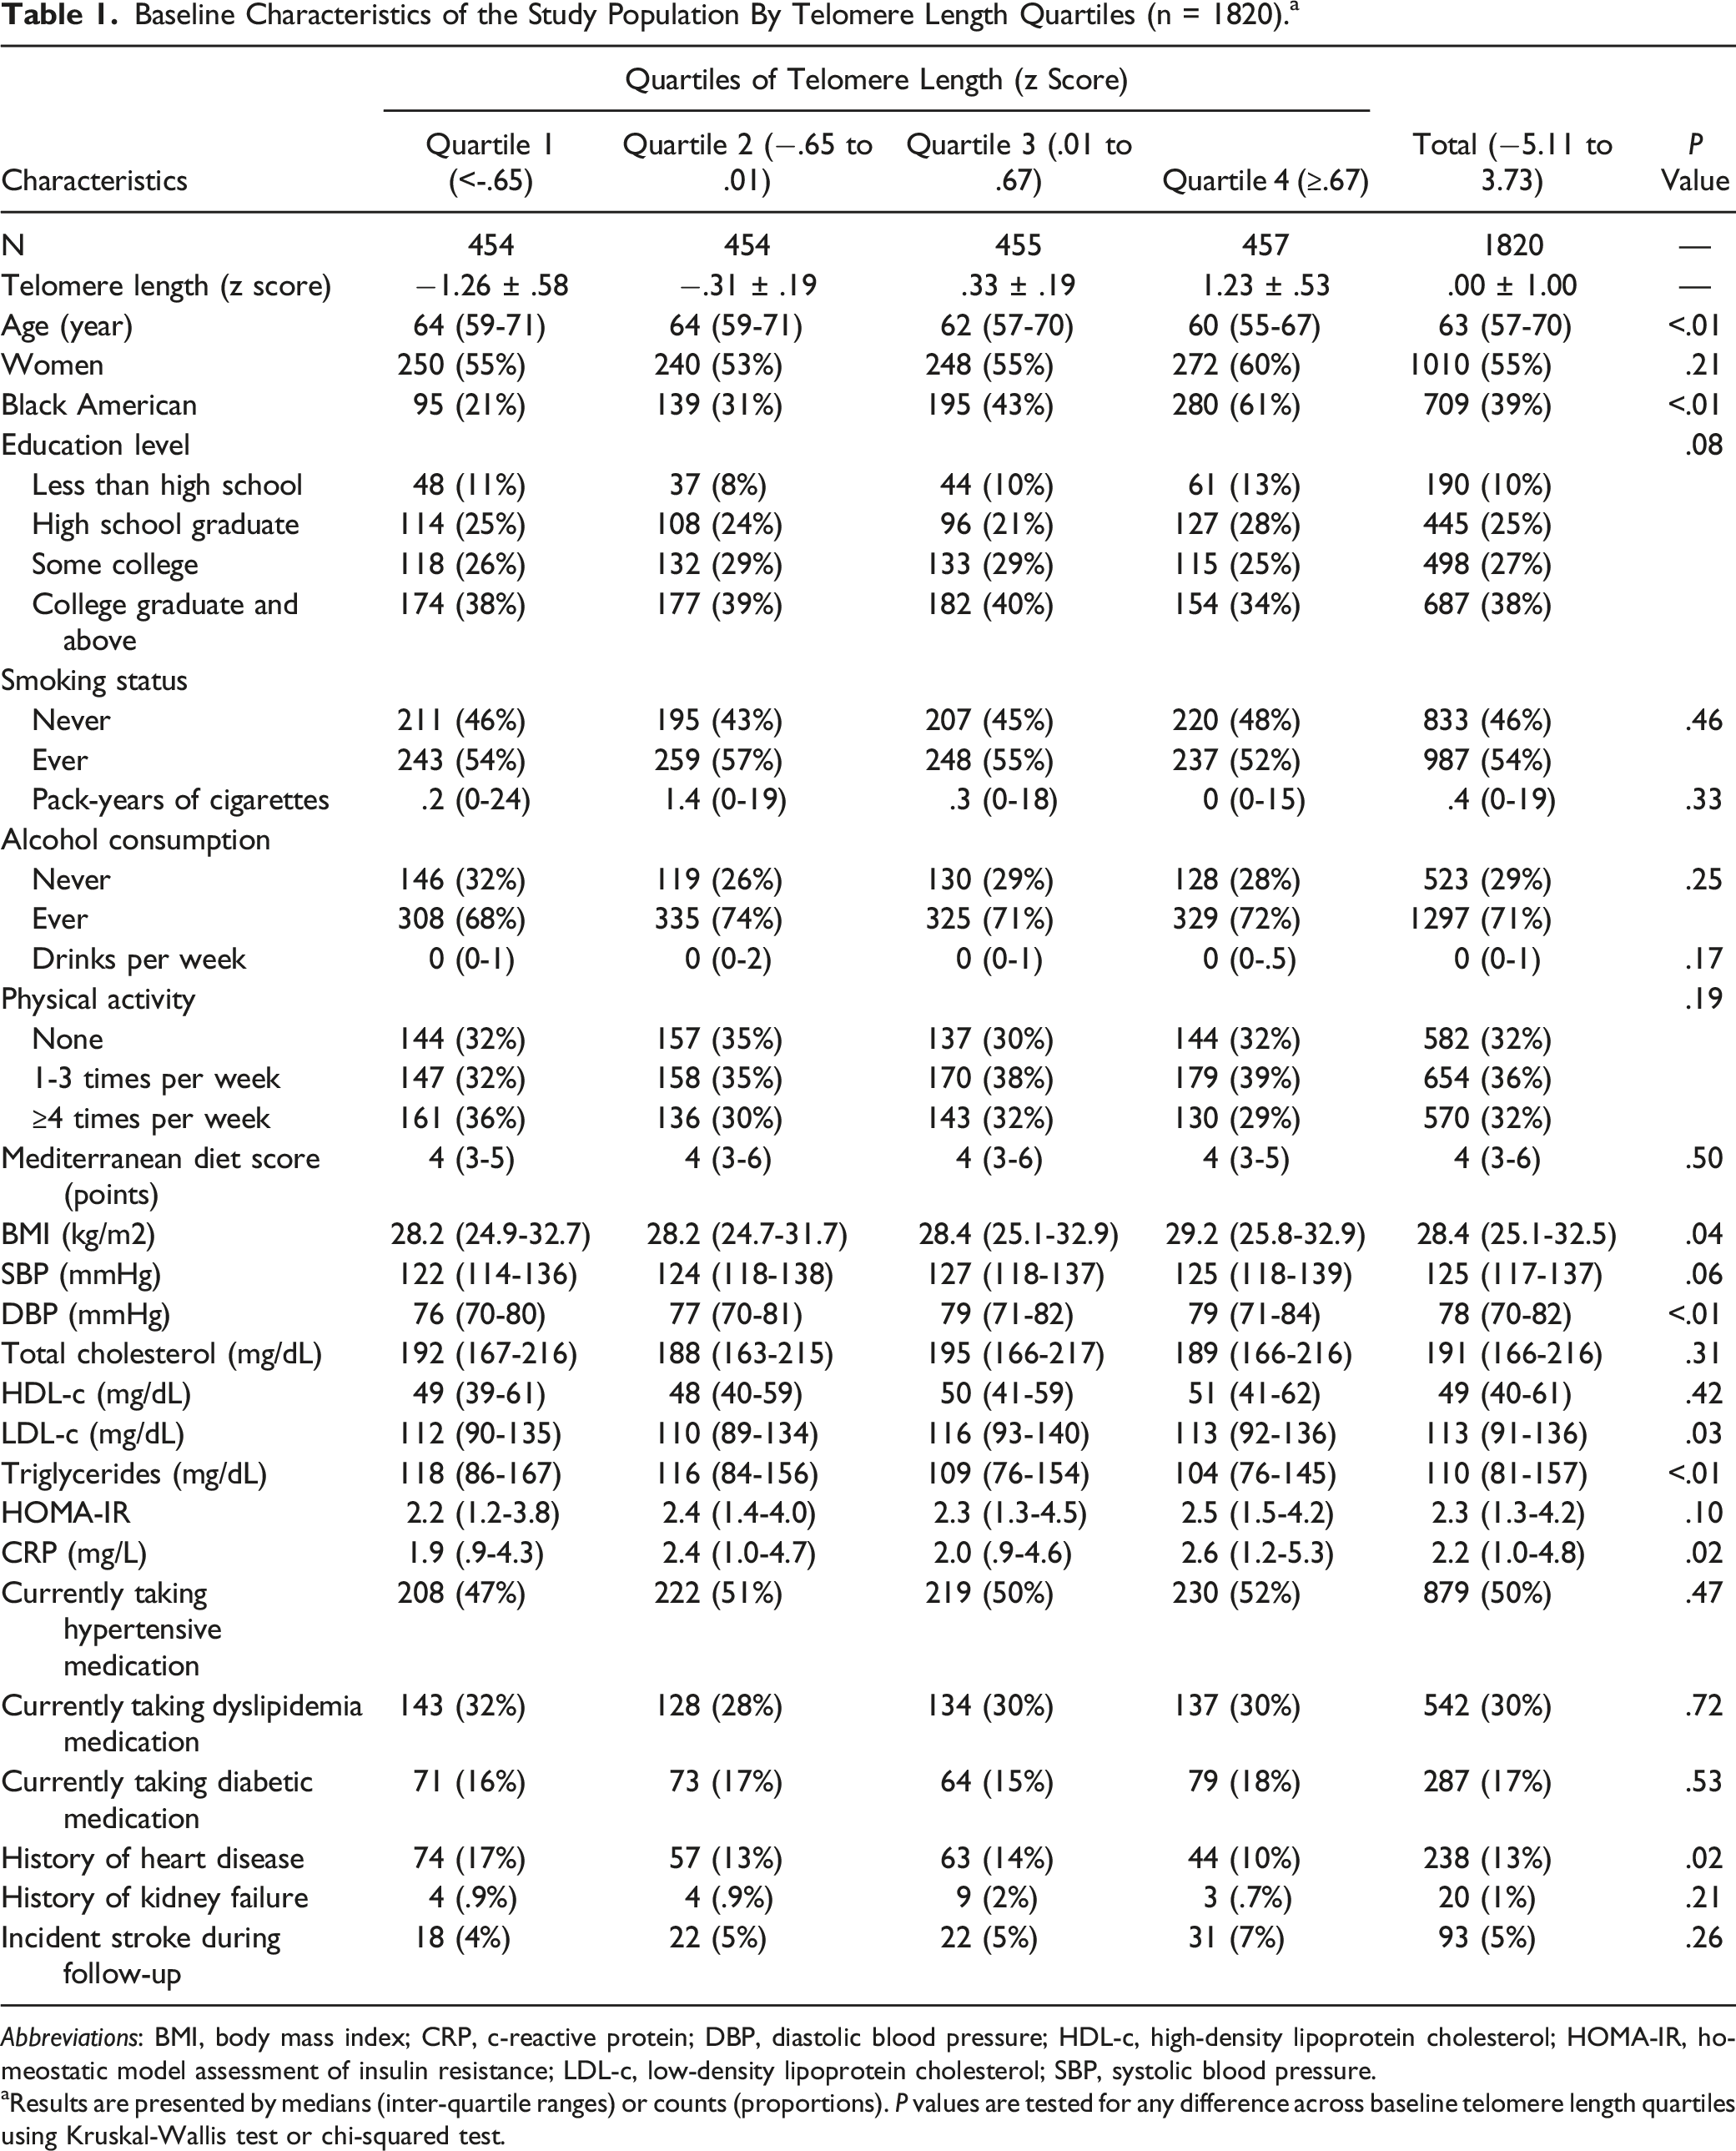
Abbreviations: BMI, body mass index; CRP, c-reactive protein; DBP, diastolic blood pressure; HDL-c, high-density lipoprotein cholesterol; HOMA-IR, homeostatic model assessment of insulin resistance; LDL-c, low-density lipoprotein cholesterol; SBP, systolic blood pressure.
aResults are presented by medians (inter-quartile ranges) or counts (proportions). P values are tested for any difference across baseline telomere length quartiles using Kruskal-Wallis test or chi-squared test.
Associations [Mean Difference (95% Confidence Interval)] Between Baseline Telomere Length and Four-Battery Cognitive Test Scores. a

Abbreviations: BMI, body mass index; HDL, high-density lipoprotein; LDL, low-density lipoprotein.
aCognitive test scores after the first assessment were used as the outcomes in linear mixed models. Covariates included age, sex, race, education, smoking status, alcohol consumption, physical activity, BMI, Mediterranean diet score, diastolic blood pressure, total cholesterol, HDL-cholesterol, LDL-cholesterol, triglycerides, HOMA-IR, c-reactive protein, medical history (current medication use for hypertension, dyslipidemia, or diabetes, and history of heart disease or kidney failure), incident stroke during follow-up, years since baseline when the assessment was performed, and the scores at first corresponding cognitive assessments.
Associations [Mean Difference (95% Confidence Interval)] Between Telomere Length Change and the Four-Battery Cognitive Test Scores. a

aTelomere length change was calculated as telomere length measured in the first visit (log-transformed) minus telomere length measured in the second visit (log-transformed). Cognitive test scores after the first assessment were used as the outcomes in linear mixed models with the adjustment for covariates in Table 2 plus telomere length in the first visit.
Associations Between Baseline Telomere Length and Four-Battery Cognitive Test Scores Stratified by Sex And Race. a
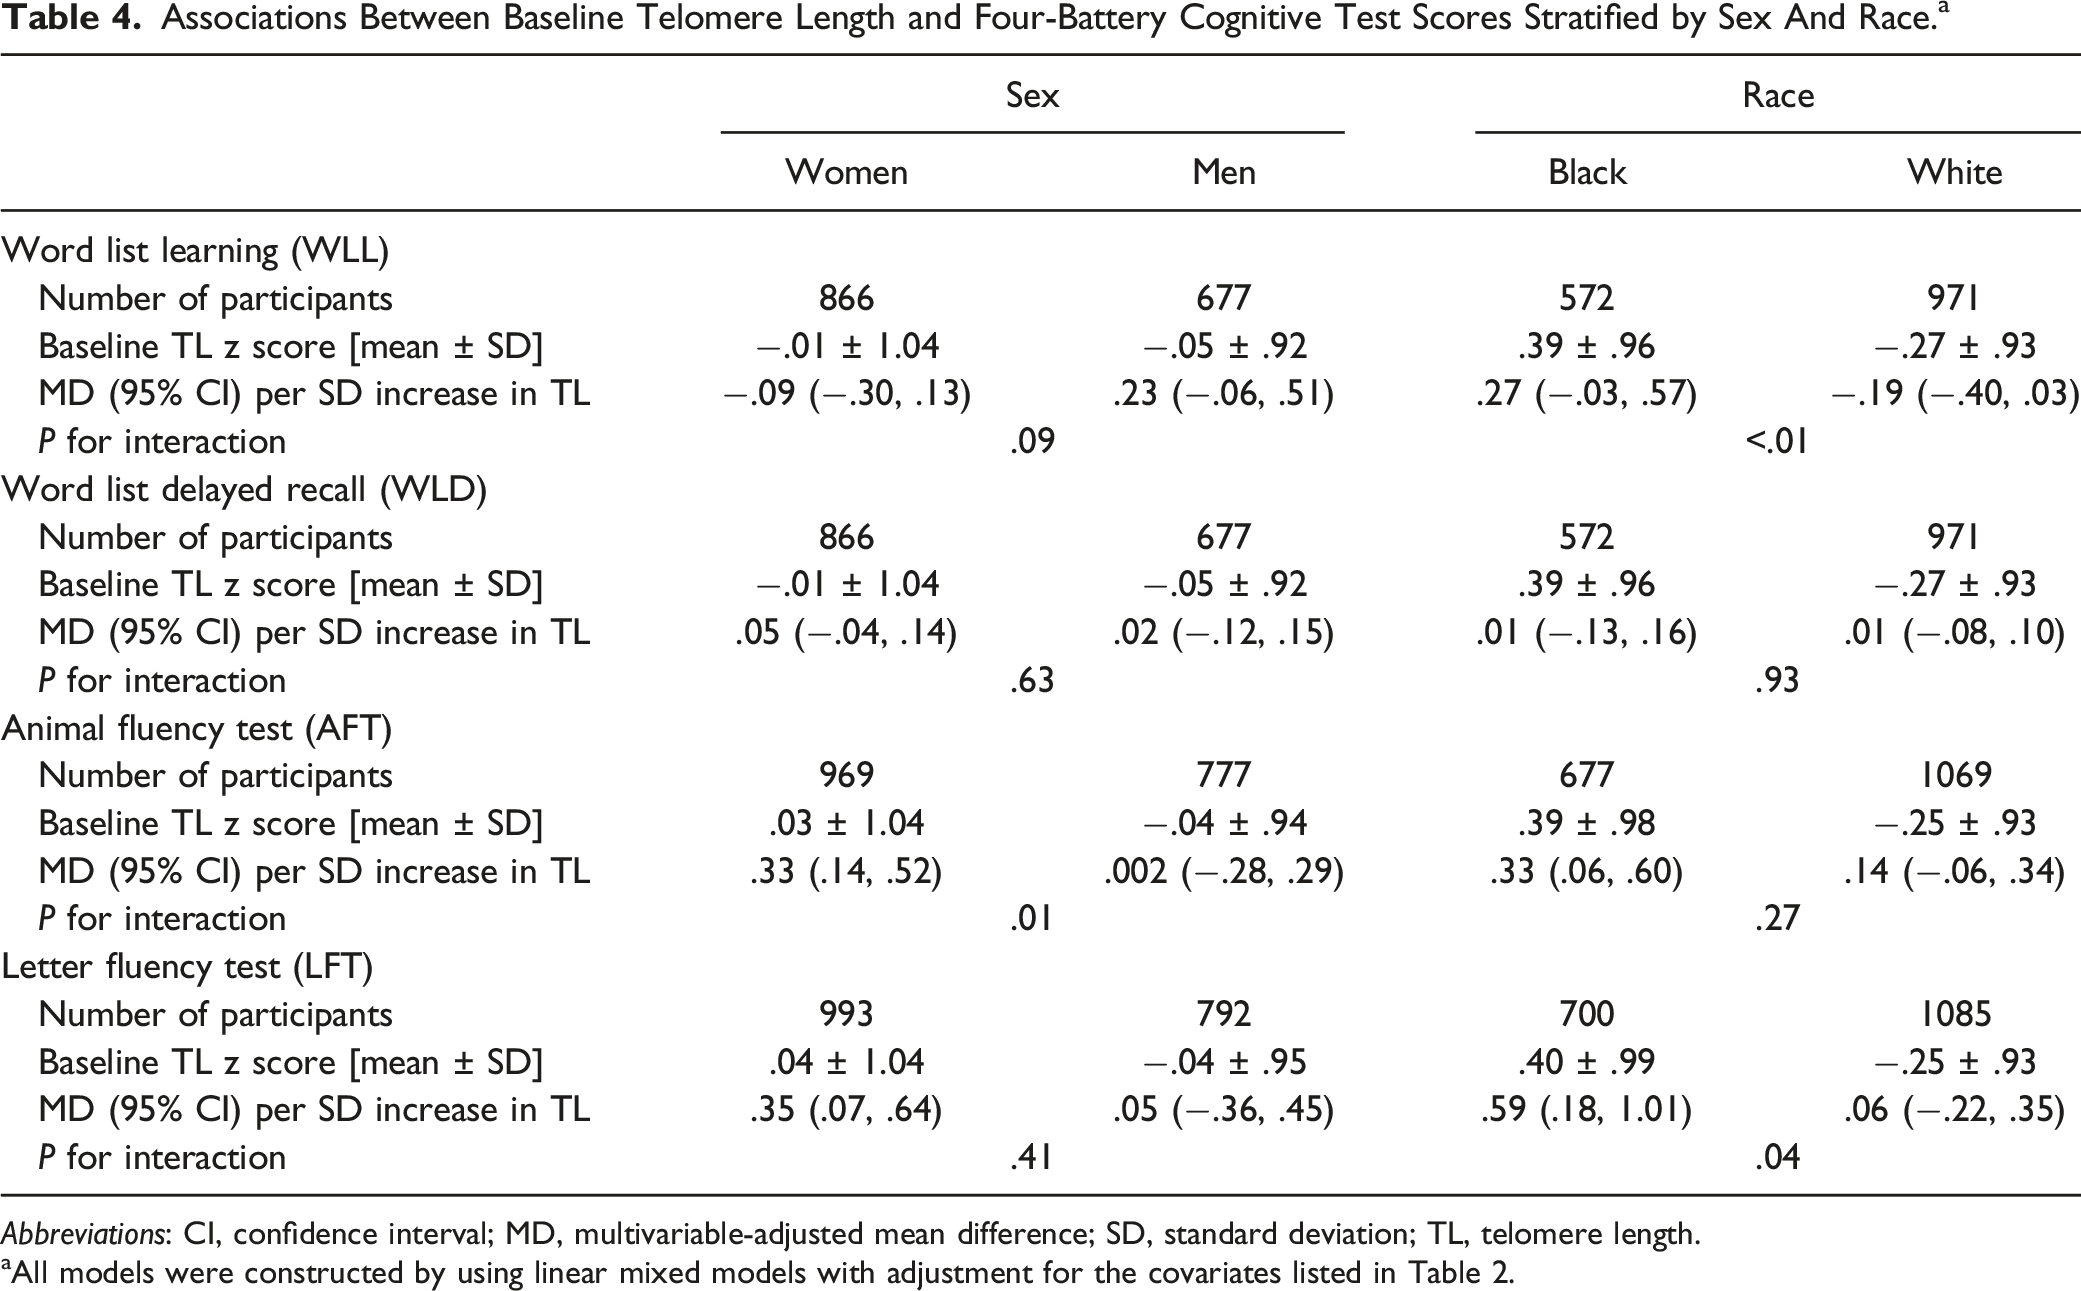
Abbreviations: CI, confidence interval; MD, multivariable-adjusted mean difference; SD, standard deviation; TL, telomere length.
aAll models were constructed by using linear mixed models with adjustment for the covariates listed in Table 2.
Associations Between Telomere Length Change and the Four-Battery Cognitive Test Scores Stratified by Sex and Race. a

Abbreviations: CI, confidence interval; MD, multivariable-adjusted mean difference; SD, standard deviation; TL, telomere length.
aAll models were constructed by using linear mixed models with adjustment for the covariates listed in Table 3.
Baseline TL was significantly longer in Black compared with White Americans in dependent of age (P < .01). Longer baseline TL was consistently associated with better time-averaged AFT and LFT scores in Black, but not in White Americans (Table 4). The mean differences (95% CI) per standard deviation increase in baseline TL were .27 (−.03, .57) for WLL, .33 (.06, .60) for AFT, and .59 (.18, 1.01) for LFT in Black Americans, while they were −.19 (−.40, .03) for WLL, .14 (−.06, .34) for AFT, and .06 (−.22, .35) for LFT in Whites. The test of interaction was significant for WLL (P for interaction <.01) and LFT (P for interaction = .04), but not for AFT (P for interaction = .27). However, TL change was significantly larger in Black compared with White Americans in dependent of age (P < .01). We did not observe significant effect modification by race on the association between TL change and cognitive test scores (P-interaction>.05, Table 5).
Discussion
Among cognitively healthy older adults, we found longer baseline TL and smaller attrition/lengthening of TL over a decade were associated with better longitudinal performance in verbal and phonemic fluency as well as executive functioning. Additionally, the associations between baseline TL and TL change with cognitive function in certain domains were more pronounced among women and Black Americans.
The association we observed between TL and better cognitive performance was in line with several previous studies,6,8,10,30,31 though many of these were cross-sectional analyses with one-time measurement of TL and cognitive function6,8,31 Only 1 previous study (n = 497) reported an association of larger TL attrition in young adulthood with worse cognitive function in midlife, 5 which is also consistent with our findings.
Our study systematically examined the sex and race differences in the association between TL and cognitive function. The association between TL and better cognitive function was only seen in women, which is supported by 1 recent study that found a stronger association of longer TL with larger brain parenchymal fraction, a measure of better cognitive function, in women than men. 8 In addition, we found that longer baseline TL was associated with better executive function as well as better abilities of learning and memory only among Black Americans. Since this is the only prospective study we are aware of to address racial differences, it is contingent on others to confirm this finding in other populations of Black Americans. Only 1 recent cross-sectional analysis with a relatively small sample size (n = 325) among middle-aged adults reported a three-way interaction between TL, race and poverty status, finding that shorter TL was associated with worse attention and working memory among White individuals in poverty compared to other social-demographic groups. 7 However, they did not report on other racial subgroups. 7 Notably, baseline age-adjusted TL was significantly longer among Black than White Americans in our data as well as in some previous studies.32,33 Therefore, it is possible that the potential benefits of longer TL on cognitive function would be more apparent for individuals with a relatively preserved TL and telomere function. More studies are warranted to confirm the sex and race effect modifications we observed.
Telomere length has been known as a biomarker for aging, which includes cognitive aging. Animal models have shown a bi-directional relationship between chronic inflammation and telomere shortening;34,35 critical telomere shortening, and dysfunction may further trigger genomic instability, cell senescence, tumorigenesis, and premature aging.36,37 Besides, longer TL may contribute to slower cognitive aging or impairment through brain structural changes. For example, research has shown that longer TL was associated with larger brain parenchymal fraction and white matter hyperintensities load. 8 Although almost all subsegmental brain regions decrease in size with aging, 38 the association between TL and brain volumes could not be fully explained by the biologic aging process. For instance, 1 study found that TL predicted brain volumes in the hippocampus, amygdala, temporal lobe, and parietal lobe, and these associations were independent of age. 38 Since these brain regions have important implications in the pathology of dementia, 39 TL shortening may play an independent role in cognitive decline.
The main limitation of our study is that relatively few participants had a second measurement of TL (n = 614) compared to baseline TL (n = 1820). However, to the best of our knowledge, the present study is the first of this kind, investigating the association between TL change and cognitive decline in older adults and explored the potential sex and race difference. Considering the relatively small sample size in the sex and race subgroups, we cannot exclude the possibility that the different association patterns of TL change with WLL or WLD by sex might be due to chance. In addition, most of the cognitive assessments were performed between the baseline and the second TL measures. Thus, the analysis of TL change with cognitive function is technically a “cross-sectional” analysis across over 10 years, and reverse causation might be possible.
To note, our study has several strengths. First, cognitive function in different domains was measured repeatedly during follow-up. Further, TL was measured at 2 time points 10 years apart, which provides valuable data to study TL change over time. In addition, compared to previous reports in a single sex or race group,6,9,30,31 our study included a biracial population of men and women, which granted us the opportunity to study the effect modifications by sex and race on the associations of interest.
In conclusion, we found that longer TL and smaller attrition/lengthening of TL were associated with better verbal and phonemic fluency and executive function among cognitively healthy older adults, particularly in women and Black Americans. Telomere length may be a biomarker that predicts long-term cognitive function even before the onset of cognitive impairment or dementia. Additional studies are needed to confirm our findings, especially in sex and racial disparity.
Supplemental Material
Supplemental Material - Associations of Telomere Length and Change With Cognitive Decline Were Modified by Sex and Race: The REGARDS Study
Supplemental Material for Associations of Telomere Length and Change With Cognitive Decline Were Modified by Sex and Race: The REGARDS Study by Cheng Chen, Keming Yang, Hongmei Nan, Frederick Unverzagt, Leslie A. McClure, Marguerite R. Irvin, Suzanne Judd, Mary Cushman, Debora Kamin Mukaz, James E. Klaunig, Mary E. D'Alton, and Ka Kahe in American Journal of Alzheimer's Disease & Other Dementias®
Footnotes
Acknowledgments
Declaration of Conflicting Interests
The authors declared no potential conflicts of interest with respect to the research, authorship, and/or publication of this article.
Funding
The author(s) disclosed receipt of the following financial support for the research, authorship, and/or publication of this article: This study is supported by a research grant from the NIH (RF1AG056111). The REGARDS research project is supported by cooperative agreement U01 NS041588 co-funded by the National Institute of Neurological Disorders and Stroke (NINDS) and the National Institute on Aging (NIA), National Institutes of Health, Department of Health and Human Service.
Disclosure
The content is solely the responsibility of the authors and does not necessarily represent the official views of the NINDS or the NIA. Representatives of the NINDS were involved in the review of the manuscript but were not directly involved in the collection, management, analysis or interpretation of the data.
Data Availability Statement
The data that support the findings of this study are available upon request to the corresponding author. The data are not publicly available due to REGARDS study policy and the containing information that could compromise the privacy of research participants.
Supplemental Material
Supplemental material for this article is available online
References
Supplementary Material
Please find the following supplemental material available below.
For Open Access articles published under a Creative Commons License, all supplemental material carries the same license as the article it is associated with.
For non-Open Access articles published, all supplemental material carries a non-exclusive license, and permission requests for re-use of supplemental material or any part of supplemental material shall be sent directly to the copyright owner as specified in the copyright notice associated with the article.