
Abstract
Background/Rationale:
Experimental studies support the role of neurotransmitter genes in dementia risk, but human studies utilizing single variants in candidate genes have had limited success.
Methods:
We used the gene-based testing program Versatile Gene-based Association Study to assess whether aggregate variation across 6 neurotransmitter pathways influences risk of cognitive decline in 8159 cognitively normal elderly (≥65 years old) adults from 3 community-based cohorts.
Results:
Common genetic variation in GNG4 and KCNQ2 was associated with cognitive decline. In human brain tissue data sets, both GNG4 and KCNQ2 show higher expression in hippocampus relative to other brain regions; GNG4 expression decreases with advancing age. Both GNG4 and KCNQ2 show highest expression in fetal astrocytes.
Conclusion:
Genetic variation analyses and gene expression data suggest that GNG4 and KCNQ2 may be associated with cognitive decline in normal aging. Gene-based testing of neurotransmitter pathways may confirm and reveal novel risk genes in future studies of healthy cognitive aging.
Introduction
The prevalence of dementia will rise as the world’s population ages; however, the risk factors and predictors of cognitive decline in cognitively normal older individuals are not fully understood. Dementia represents the clinical manifestation of a spectrum of neurodegenerative disorders that are likely caused by multiple factors. Despite variable underlying neuropathological etiologies, many forms of dementia are characterized by progressive cognitive decline, and early changes in cognitive function are often required for diagnosis under neurodegenerative conditions such as Alzheimer’s disease (AD). 1 and frontotemporal dementia. 2 Twin and sibling studies suggest that cognitive phenotypes such as working memory, episodic memory, and risk of dementia are heritable. 3 –7 Although recent research has broadened our understanding of the genetic underpinnings of cognitive decline and dementia, much remains to be understood. 8,9
Evidence from studies in humans and rodents suggests that neurotransmitter function declines in aging and that these changes could be associated with risk of dementia and other disorders. 10 –14 Current knowledge of genetic variation within neurotransmitter genes as risk factors for dementia is heavily derived from single-variant candidate gene studies and has often rendered mixed results. For example, common variants in BDNF have shown mixed associations in AD when compared to controls, even though imaging and cognitive studies suggest that this variation influences neurodegenerative processes. 15,16 In addition, estimated effects of single nucleotide polymorphisms (SNPs) often differ across studies. Replication of these effects is difficult, given disease heterogeneity, overestimates of risk effect in underpowered studies, and variability in genetic background across different populations. As an alternative to single SNP-based methods for identifying disease risk alleles, there are statistical tests that assess the combined assessment of multiple SNPs across a gene. 17,18 Such gene-based tests are an attractive alternative to single variant tests because they reduce the burden of multiple testing, are analytically more flexible, and allow for allelic heterogeneity (i.e., when different variants within the same gene are associated with the same phenotype). 18,19 For instance, if multiple SNPs in a single gene individually promote modest risk of cognitive decline, their effects could go unnoticed in a single-variant test due to the small and dispersed effects of each SNP.
Factors that impact global cognition may provide unique insight into the early pathological changes that underlie declines in cognitive function and mechanisms that may be helpful for combating it. Given their key roles in relaying synaptic signals throughout different networks of the brain critical for cognition, neurotransmitters are clear candidates for influencing cognitive aging. In addition to suggestive human genetic findings, research in animal models supports the role of components within neurotransmitter pathways as contributing to cognitive function in aging. For example, given the role depression may play as a risk factor for dementia, 20 many studies have examined candidate genes related to neurotransmitter or neuroendocrine pathways for roles in cognition and risk of neurodegenerative disorders leading to dementia such as AD. Further, the serotonin transporter length polymorphism (5-HTTLPR) has been associated with poorer memory function in older adults 21 and with risk of dementia. 22 Norepinephrine (adrenergic system) signaling is associated with better performance on memory tasks and is suggested to play a protective role against AD pathology, 23 –25 and extensive loss of norepinephrine projecting cells is often seen in AD. 23 Anticholinergic medications have been linked to cognitive decline. 26 One review suggests the excitatory glutamatergic system as another strong candidate system for risk of late-life depression and dementia that may relate to changes in signal transduction in older age. 27
Taken together, these findings suggest that multiple neurotransmitter pathways may contribute to risk for dementia, and that by investigating genes rather than single polymorphisms the authors may better understand the role these functional systems play in cognition during aging. Finally, there are many approved drugs that modulate neurotransmitter levels and are tolerated in dementia,
28
which makes treatment based on a gene-based analysis more tractable. For example, the drug memantine is already used to treat AD and is an N-Methyl-
Methods and Materials
Cohort Descriptions and Cognitive Measures
Three cohorts comprising a total of 8159 participants with cognitive and genetic data were used in our study. In all 3 cohorts, we required that individuals had genome-wide SNP genotypes, ≥2 cognitive test scores available, and were of European ancestry and unrelated based on SNP data. All participants in all studies provided written informed consent, and the institutional review boards at recruitment sites and the study-coordinating center (University of California, San Francisco) approved all aspects of this study.
Discovery Cohort—Health, Aging, and Body Composition
Our discovery cohort was the Health, Aging, and Body Composition (Health ABC) study, a prospective cohort study of 3075 community dwelling black and white men and women living in Memphis, Tennessee or Pittsburgh, Pennsylvania, and aged 70 to 79 years at recruitment in 1997. Eligible participants reported no difficulty with daily living activities, walking a quarter of a mile, or climbing 10 steps without resting at baseline. All participants were free from life-threatening cancer diagnoses and planned to live in the study area for at least 3 years. The cohort has been described in more detail in previous publications. 30
In the Health ABC cohort, we used 2 different measures of cognitive function: the Modified Mini-Mental State Examination (3MS), a measure of global cognition, 31 and the Digit Symbol Substitution Test (DSST), a measure of processing speed. 32 In Health ABC, the 3MS was administered in years 1, 3, 5, and 8 and the DSST was administered in years 1, 5, and 8. For phenotype generation, 3MS and DSST repeated measures from across the research period were used to calculate participant-specific slopes and intercepts for each test. As in prior work, we generated cognitive test score slopes as best linear unbiased predictions using a linear mixed model with random slopes and intercepts (Stata10, StataCorp, College Station, Texas). 33 This type of modeling enables estimation of population-level fixed effects (changes in cognitive function across the entire cohort) as well as individual-level random effects (each participant’s deviation from the overall group). This approach allows each participant to have a unique intercept and trajectory (slope describing a change in cognitive function). Estimated slopes were used as a quantitative trait in association analysis with genetic variants as described below. Covariate adjustments were introduced at the genetic analysis stage, as detailed below.
Replication Cohorts—Study of Osteoporotic Fractures and Osteoporotic Fractures in Men
Our replication cohorts were the Study of Osteoporotic Fractures (SOF) and Osteoporotic Fractures in Men (MrOS) study. The SOF is a multicenter observational study of 9704 women aged 65 or older started in 1986 to study risk factors for osteoporosis, falls, and fractures. It was expanded to include measures of successful aging and has been previously described in detail. 34 The MrOS study is a multicenter observational study of 5994 older men started in 2000 to study risk factors for osteoporosis, fractures, and prostate cancer susceptibility, which included multiple measures of successful aging and cognitive health. It has previously been described in detail. 35
In accordance with study guidelines, cognitive phenotype generation for SOF and MrOS was conducted by the San Francisco Coordinating Center (SFCC), a nonprofit academic organization that manages the clinical data for multisite studies and clinical trials. For the SOF cohort, the Mini-Mental State Examination (MMSE), 36 an assessment similar to the 3MS, was used as a measure of general cognitive function. The MMSE was administered in years 0, 6, 8, and 10. In the MrOS cohort, the 3MS was used as a measure of general cognitive function. The 3MS was administered in years 0, 4, and 7. For SOF and MrOS data, standardized measures of cognitive function (z scores) were separately calculated in each cohort. Participant-specific slopes were calculated by the SFCC using linear mixed effect regression models (PROC MIXED in SAS, SAS Institute, Cary, North Carolina). 37 In the SOF and MrOS cohorts, fixed effects of site, age, and education level were included in the cognitive score models. As in the Health ABC analyses, random effects for slope and intercept were included. Cognitive decline was scored as a dichotomous trait as the phenotype of interest, defining decline as having a slope >1 standard deviation (SD) from the group mean slope over the assessment period included in the present study.
Genotyping and Quality Control
Genotyping for Health ABC was performed on the Illumina Human1M-Duo BeadChip system by the Center for Inherited Disease Research. 33 Genotyping for SOF and MrOS was conducted on the Illumina Omni1-Quad array at the Broad Institute. 37 For individuals of European American genetic background based on principal components analysis (PCA), genotype imputation was performed using MACH/minimac to increase the number of SNPs covered in each cohort using CEU HapMap Phase 2 release 22 as reference. 38 The SNPs with a minor allele frequency ≥0.01, call rate >95%, and Hardy-Weinberg equilibrium P > .0001 were used for imputation. For imputed SNPs, we excluded markers with imputation accuracy <0.3.
Gene Selection
Neurotransmitter genes were first identified using pathways identified by the Kyoto Encyclopedia of Genes and Genomes (KEGG) 39 and the Science Signaling Database of Cell Signaling (SSDCS). The KEGG is a database that provides information for the systematic analysis of gene functions by providing genomic and higher order functional information. The KEGG’s PATHWAY database has graphical representations of cellular processes such as metabolism and cellular signaling. The SSDCS was a graphical interface that allowed for the visualization of canonical pathways. It was archived in June 2015, but the original XML files used in this article are still available (http://stke.sciencemag.org/about/help/cm). Both databases adequately represent current knowledge on the pathways of interest—KEGG is still actively maintained and the SSDCS database was last updated in 2012. Genes belonging to these 6 neurotransmitter pathways were included in our analyses: adrenergic, cholinergic, dopaminergic, γ-aminobutyric acid (GABAergic), glutamatergic, and serotonergic.
Gene Expression
To assess the expression patterns of our most promising candidate genes, we analyzed gene expression levels in the Braineac database (http://www.braineac.org/). The database consists of 134 neuropathologically confirmed normal donors from the MRC Sudden Death Brain Bank in Edinburgh, United Kingdom, and the Sun Health Research Institute in Sun City West, Arizona. The cohort is composed of 99 males and 35 females with an average age of 58 (range 16-102). The average postmortem interval (PMI) was 41.7 hours. For each individual in the study, up to 10 brain regions were sampled: cerebellar cortex, frontal cortex, hippocampus, medulla, occipital cortex, putamen, substantia nigra, thalamus, temporal cortex, and intralobular white matter. RNA extraction, quality control steps, and analysis of array data are described elsewhere in detail. 40 In brief, RNA expression was assessed using the Affymetrix Exon 1.0 ST Array following manufacturers’ protocols. Differences in transcript expression across the 10 brain regions were assessed using the default settings in Braineac, which utilizes the maximum number of samples per region as possible based on data availability. To minimize the effects of outlier probes within a gene, Braineac utilizes a Winsorized mean across the available probe sets.
To explore and describe the temporal and spatial patterns of gene expression among our most promising candidate genes, we used the Human Brain Transcriptome project (HBT; http://hbatlas.org/pages/hbtd). The HBT provides transcriptome data for the developing and adult human brain. The study used over 1340 tissue samples from 57 clinically unremarkable individuals with no large-scale genetic abnormalities. The cohort is composed of 31 males and 26 females ranging in age from 5.7 weeks postconception (pcw) to 82 years old. The average PMI was 12.1 hours. Tissue was taken from 6 major areas. We examined the hippocampus, amygdala, striatum, cerebellar cortex, mediodorsal nucleus of the thalamus, and neocortex. Cohort characteristics, RNA extraction, quality control steps, and analysis of array data are described in detail in Kang et al. 41 The developers of the HBT project also used the Affymetrix Exon 1.0 ST Array to measure RNA expression.
Finally, cell type–specific expression data were obtained for selected genes using the Brain RNA-Seq tool (http://www.brainrnaseq.org/). All samples came from elective procedures and all postnatal tissue were deemed normal by both electroencephalography and magnetic resonance imaging. We examined all available cell types including fetal astrocytes, mature astrocytes, neurons, oligodendrocytes, microglia/macrophages, and endothelial cells. Detailed descriptions of the samples and processing techniques used have been previously published. 42 –44
Statistical Analysis
We performed a 2-step analysis. First, univariate genetic associations with cognitive slope (Health ABC) or cognitive decline (SOF and MrOS) were determined for SNPs in candidate genes in each cohort separately. Next, we grouped SNPs within gene regions of interest as defined by genes’ membership in specific neurotransmitter pathways in order to evaluate gene-level contributions to cognition. The 3 cohorts used for this study utilized 2 separate cognitive tests and were mixed with respect to sex composition and study initiation date, so they were not combined for analysis. Qualitative comparisons were made between the cohorts when possible.
Single-Variant Associations With Cognitive Measures
We implemented a regression model in R to test for genetic associations between SNPs and the cognitive phenotype of interest in each cohort. In the Health ABC study, we assessed SNP associations with slope of scores on 3MS or DSST separately using linear regression. Both analyses were adjusted for participants’ baseline age, sex, education level, APOE ∊4 carrier status, recruitment site, baseline cognitive test score, and population substructure. Population substructure was estimated using PCA, and the first 2 eigenvectors (from PCA) were included in the model as covariates. In the SOF and MrOS analyses, SNP associations were tested using the dichotomous phenotype of cognitive decline (slope < 0) on MMSE or 3MS, respectively, versus no decline (slope ≥ 0) via logistic regression, adjusting for age, education level, APOE ∊4 genotype, and population substructure (through inclusion of the first 2 PCA-derived eigenvectors). In all analyses, we did not adjust for depression levels, as depression can be a prodromal sign of dementia. 45
Gene-Based Testing
The Versatile Gene-based Association Study (VEGAS) algorithm has been previously described. 46 Briefly, the VEGAS uses the University of California, Santa Cruz genome browser hg18 assembly to assign user supplied SNPs to genes. Gene boundaries were defined as ±50 kb from the 5′ and 3′ end of the untranslated regions, and all SNPs within these boundaries that were analyzed for associations from each data set were included for analysis. The software then takes the full set of markers within a gene and accounts for confounding due to reference population linkage disequilibrium (LD) patterns and gene size. The VEGAS corrects for these confounders using simulations that utilize HapMap LD structures. 46 The VEGAS provides a gene-based test statistic as the sum of all χ2-converted SNP P values for a given gene. The software then calculates a null distribution of χ2 statistics using Monte Carlo simulation, which is compared to the gene-based test statistic described above. The P value for a gene is calculated by comparing the empirical χ2 statistic to the null distribution of χ2 statistics. The Monte Carlo simulation technique is faster than traditional permutation techniques and yields similar results. 46 The maximum number of simulations was 1 000 000 (default setting), which means that the lowest possible P value is 1 × 10⁻⁶.
Results
Cohort Composition
The final Health ABC cohort was comprised of 1598 cognitively normal older individuals who had either the 3MS or DSST available for analysis. There were 1597 individuals with a longitudinal 3MS profile and 1594 individuals with a longitudinal DSST profile. In the SOF cohort, 383 of 3508 women were labeled as showing cognitive decline over the test period. In the MrOS cohort, 384 of 3820 men were labeled as showing cognitive decline over the test period. The average age of participants in the 3 cohorts was in the early to mid-70s (Tables 1 and 2). The Health ABC cohort and MrOS cohorts were highly educated, with a majority of individuals reporting greater than 12 years of education, whereas a majority of the SOF cohort participants reported less than 12 years of education (Tables 1 and 2). Baseline scores on cognitive tests differed between individuals by cognitive trajectory; individuals with a negative slope in the Health ABC cohort or identified as cognitive decliners in the SOF or MrOS cohorts generally did worse compared to those with a positive slope or identified as nondecliners in the SOF or MrOS analyses (Tables 1 and 2).
Primary Health ABC Cohort.
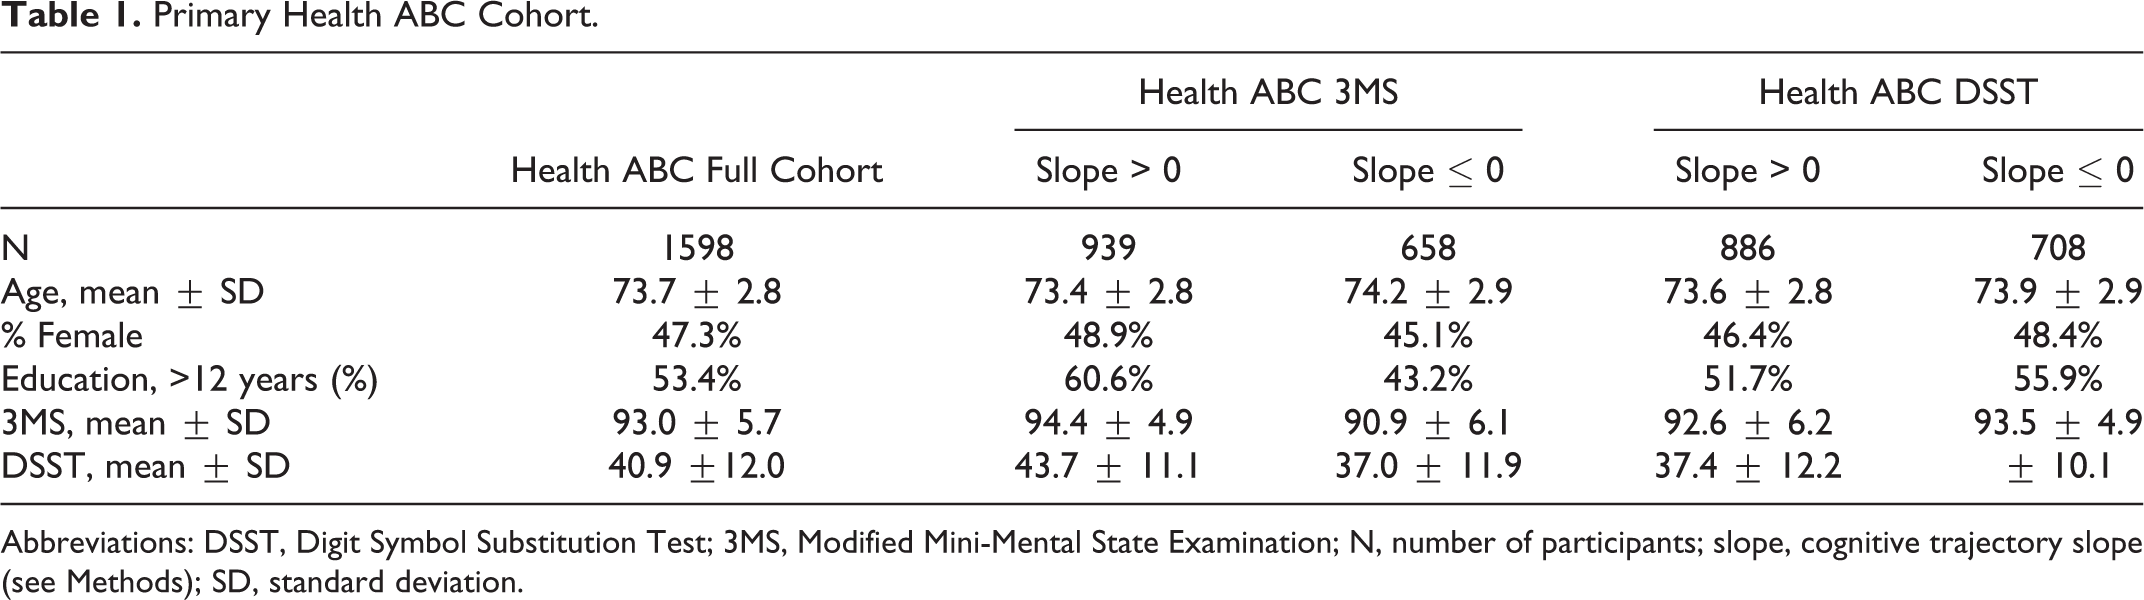
Abbreviations: DSST, Digit Symbol Substitution Test; 3MS, Modified Mini-Mental State Examination; N, number of participants; slope, cognitive trajectory slope (see Methods); SD, standard deviation.
Replication SOF and MrOS Cohorts.
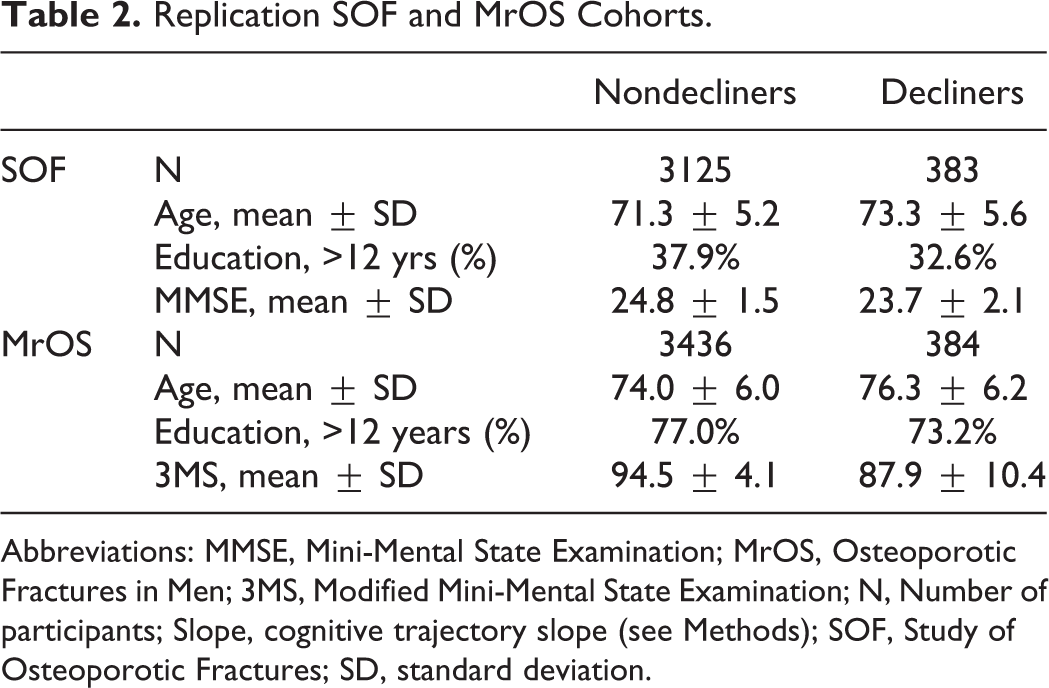
Abbreviations: MMSE, Mini-Mental State Examination; MrOS, Osteoporotic Fractures in Men; 3MS, Modified Mini-Mental State Examination; N, Number of participants; Slope, cognitive trajectory slope (see Methods); SOF, Study of Osteoporotic Fractures; SD, standard deviation.
Gene Pathway Identification
Using the KEGG and SSDCS databases, we identified a total of 330 genes associated with adrenergic, cholinergic, dopaminergic, GABAergic, glutamatergic, and serotonergic neurotransmitter pathways. A full list of these genes is available in Supplemental Data 1.
Gene-Based Analyses
VEGAS results were available for 315 of the 330 neurotransmitter genes identified through the KEGG and SSDCS databases due to SNP coverage and other factors (sex chromosome genes are not analyzable in version of VEGAS used). A graphical summary of the major findings and replicated genes from the Health ABC analyses as well as the SOF and MrOS cohorts is shown in Figure 1.
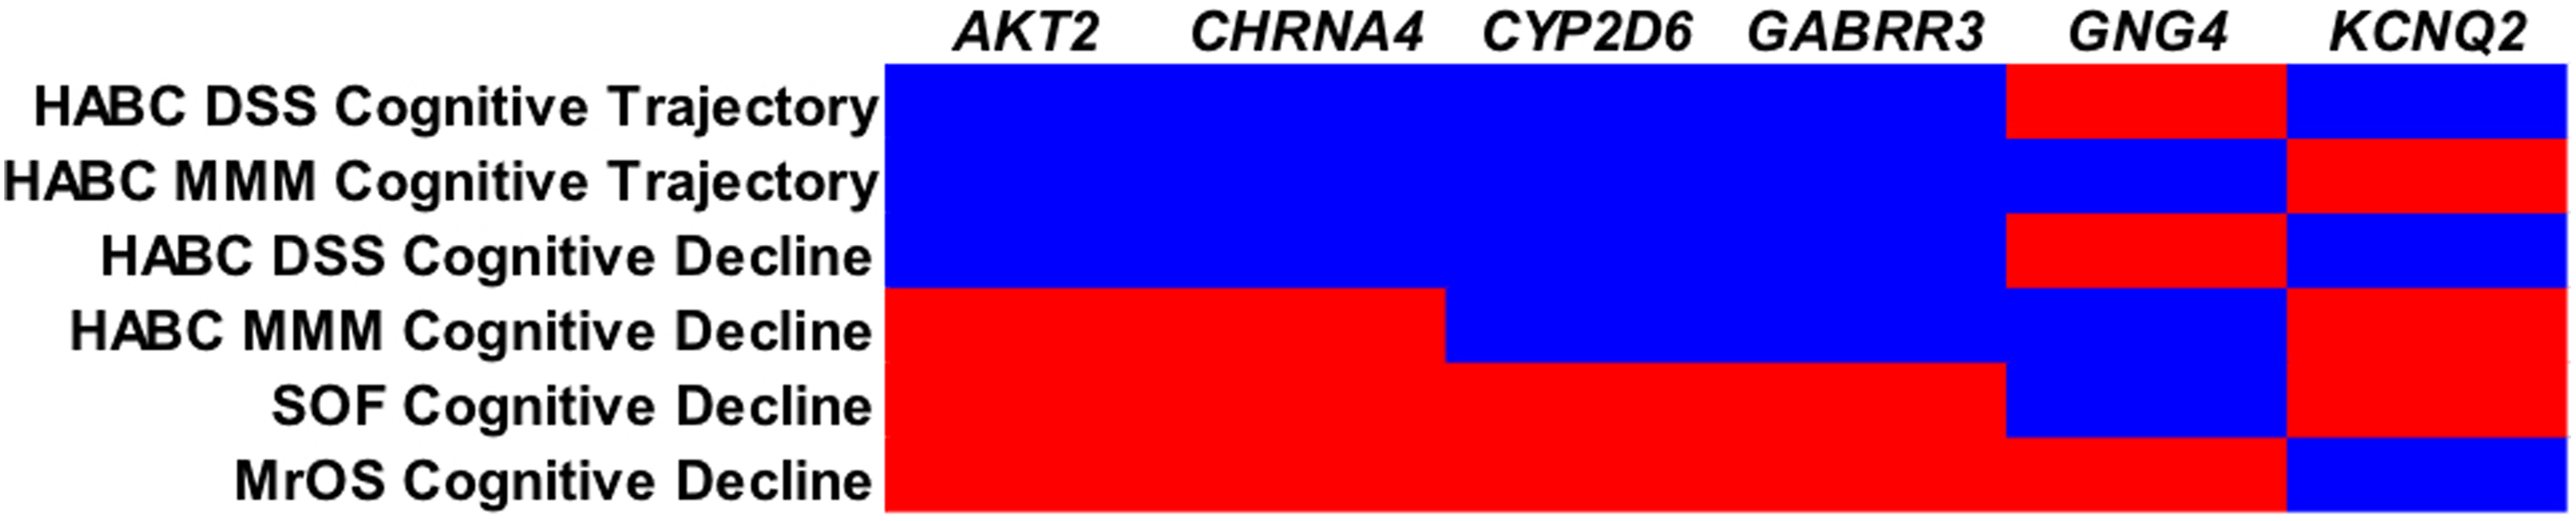
Results from HABC, SOF, and MrOS analyses major findings replicated between the Health ABC, DSST, HABC, 3MS, SOF, and MrOS cohorts are shown. Blue areas were significant and red areas were not significant. DSST, Digit Symbol Substitution Test; HABC, Health ABC; MrOS, Osteoporotic Fractures in Men; 3MS, Modified Mini-Mental State Examination; SOF, Study of Osteoporotic Fractures.
The Health ABC DSST cognitive trajectory analysis resulted in 20 genes that were significant at a P value <0.05. In the Health ABC 3MS analysis, 17 genes were significant at a P < .05. Full results for these analyses are provided in Table 3. Four genes were significant in both of the Health ABC cognitive trajectory analyses: AKT2, CHRNA4, CYP2D6, and GABRR3.
Health ABC Cognitive Trajectory Analyses.
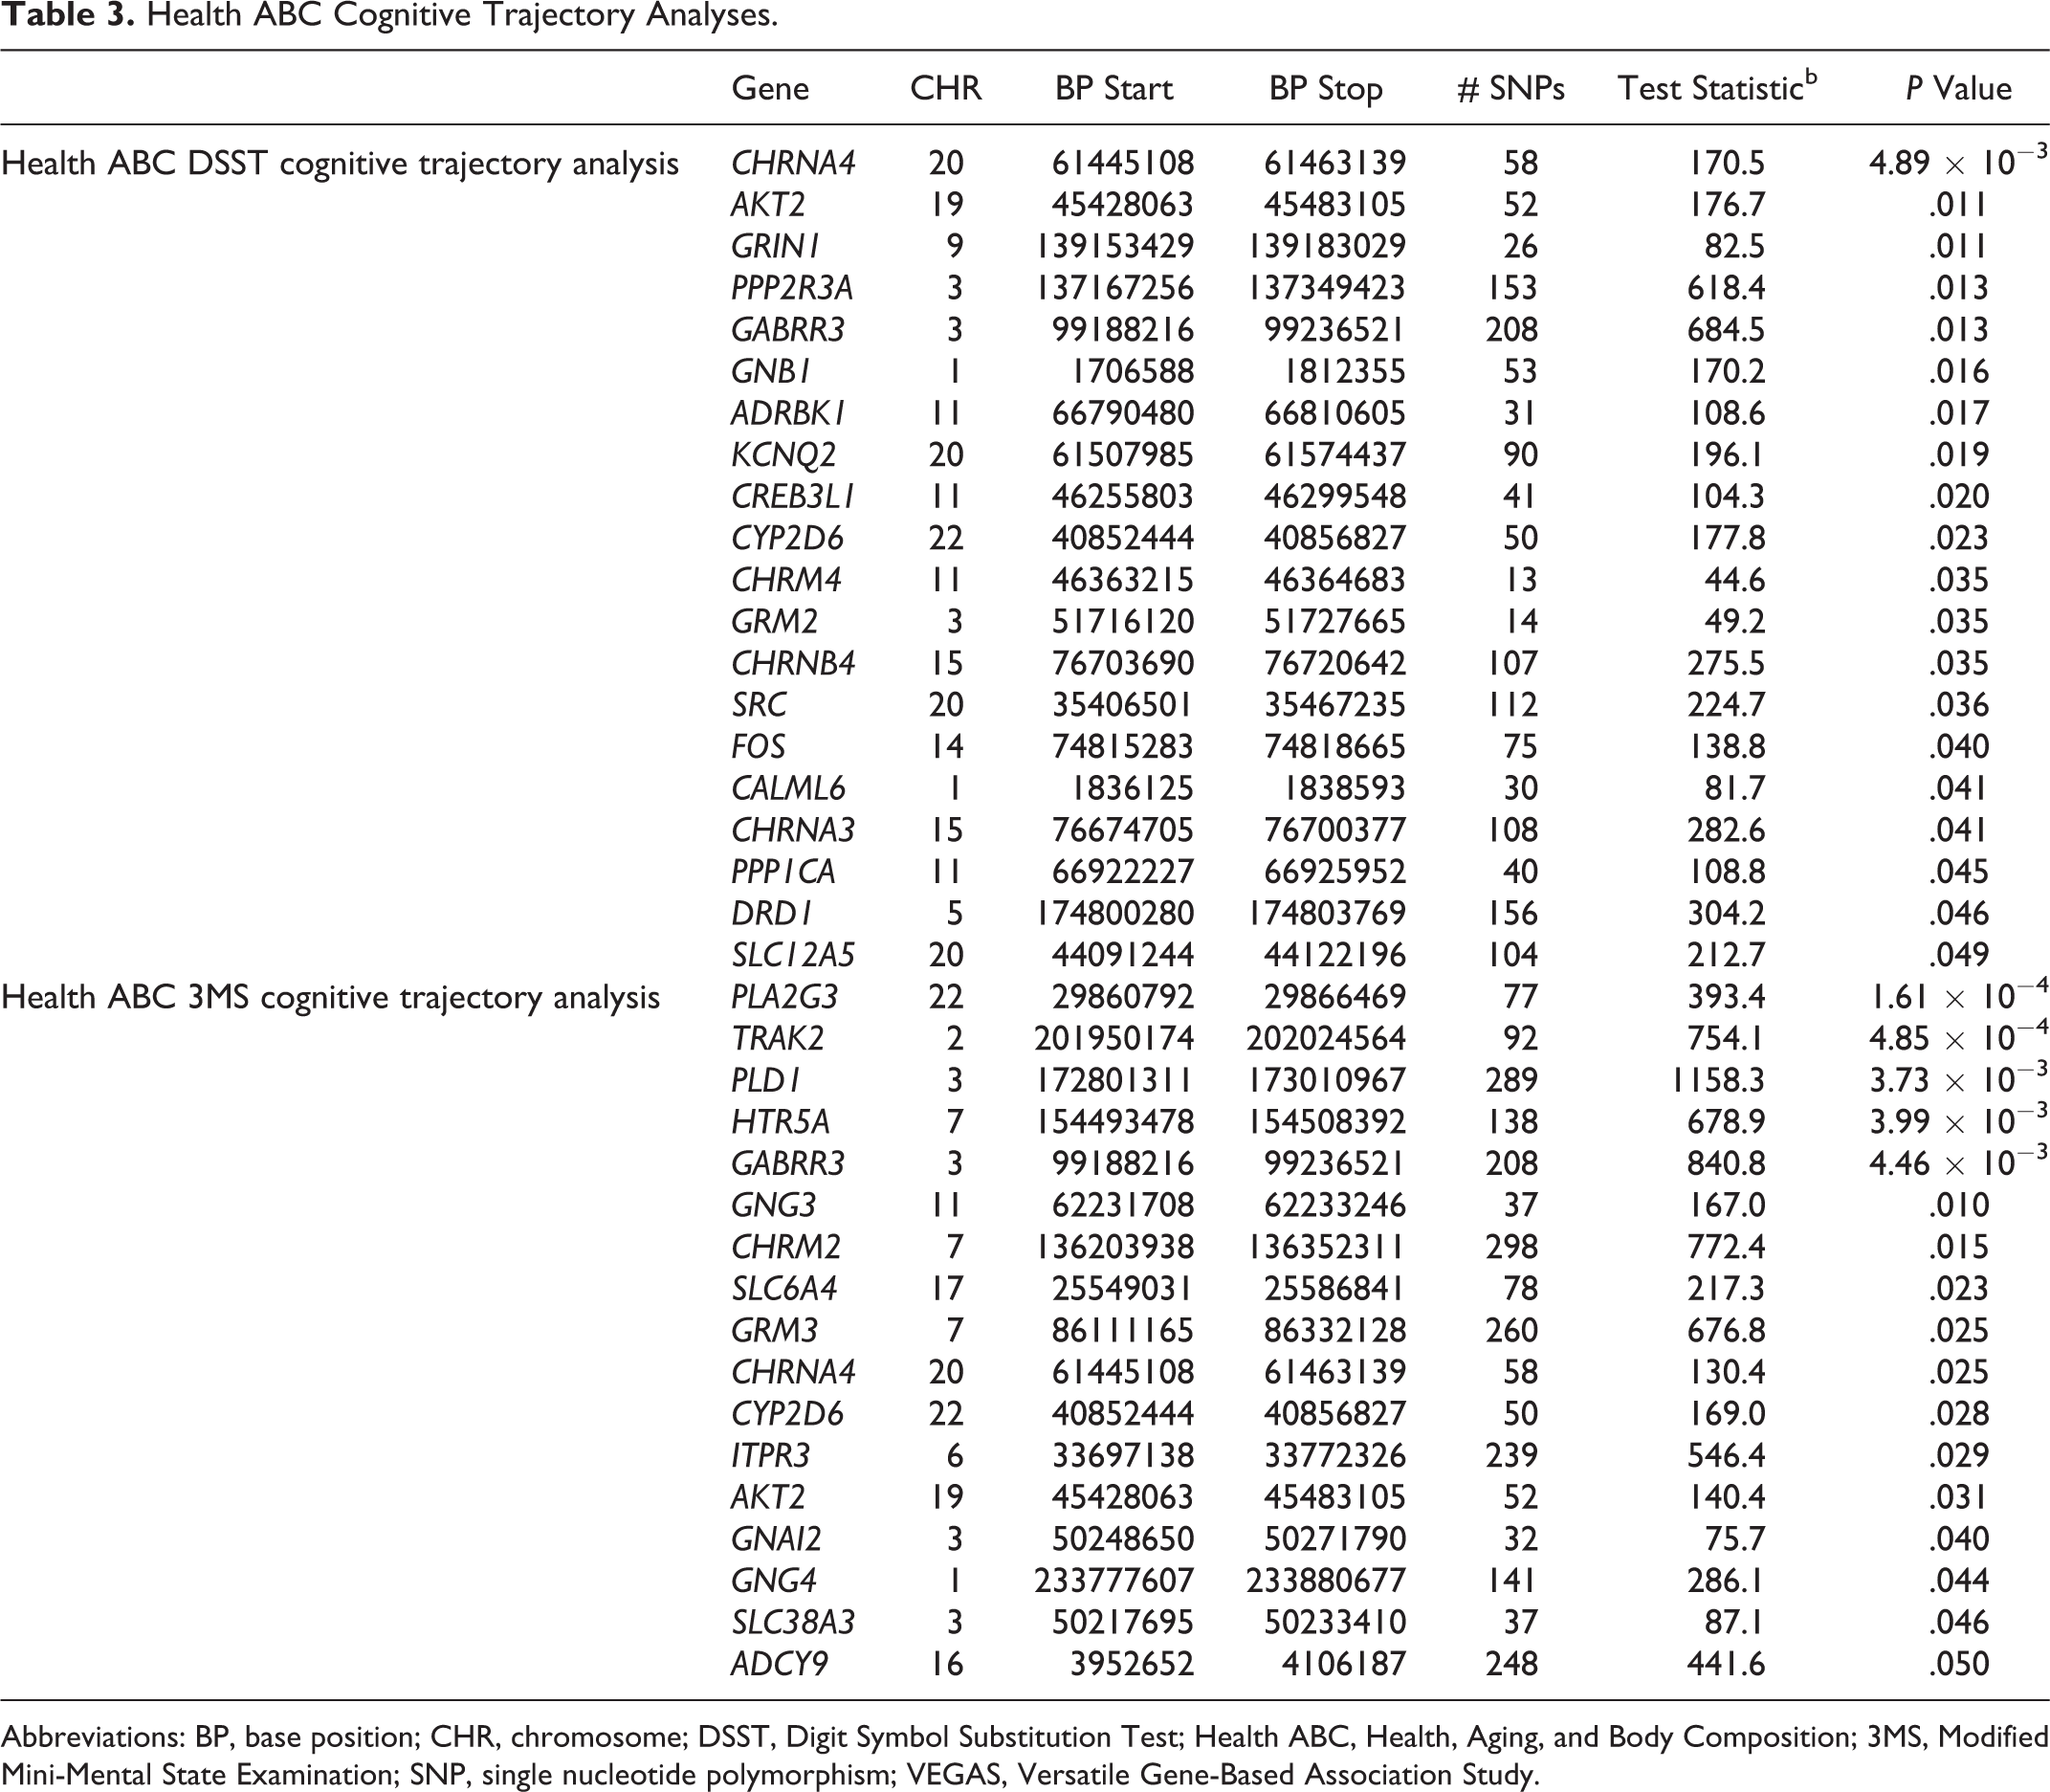
Abbreviations: BP, base position; CHR, chromosome; DSST, Digit Symbol Substitution Test; Health ABC, Health, Aging, and Body Composition; 3MS, Modified Mini-Mental State Examination; SNP, single nucleotide polymorphism; VEGAS, Versatile Gene-Based Association Study.
To test for genes that specifically influence cognitive decline, we restricted our gene-based VEGAS analyses to the Health ABC SNPs with negative β coefficients in the regression model. The Health ABC DSST cognitive decline model resulted in 18 genes that were significant. In the Health ABC 3MS cognitive decline model, 15 of the genes tested were significant at a P < .05. Full results for these analyses are provided in Table 4. Results from the Health ABC cognitive decline analyses were largely concordant with prior Health ABC cognitive trajectory analyses, with AKT2, CHRNA4, CYP2D6, and GABRR3 replicating in the Health ABC DSST cognitive decline analysis and CYP2D6 and GABRR3 replicating in the Health ABC 3MS cognitive decline analysis.
Health ABC Cognitive Decline Analyses.
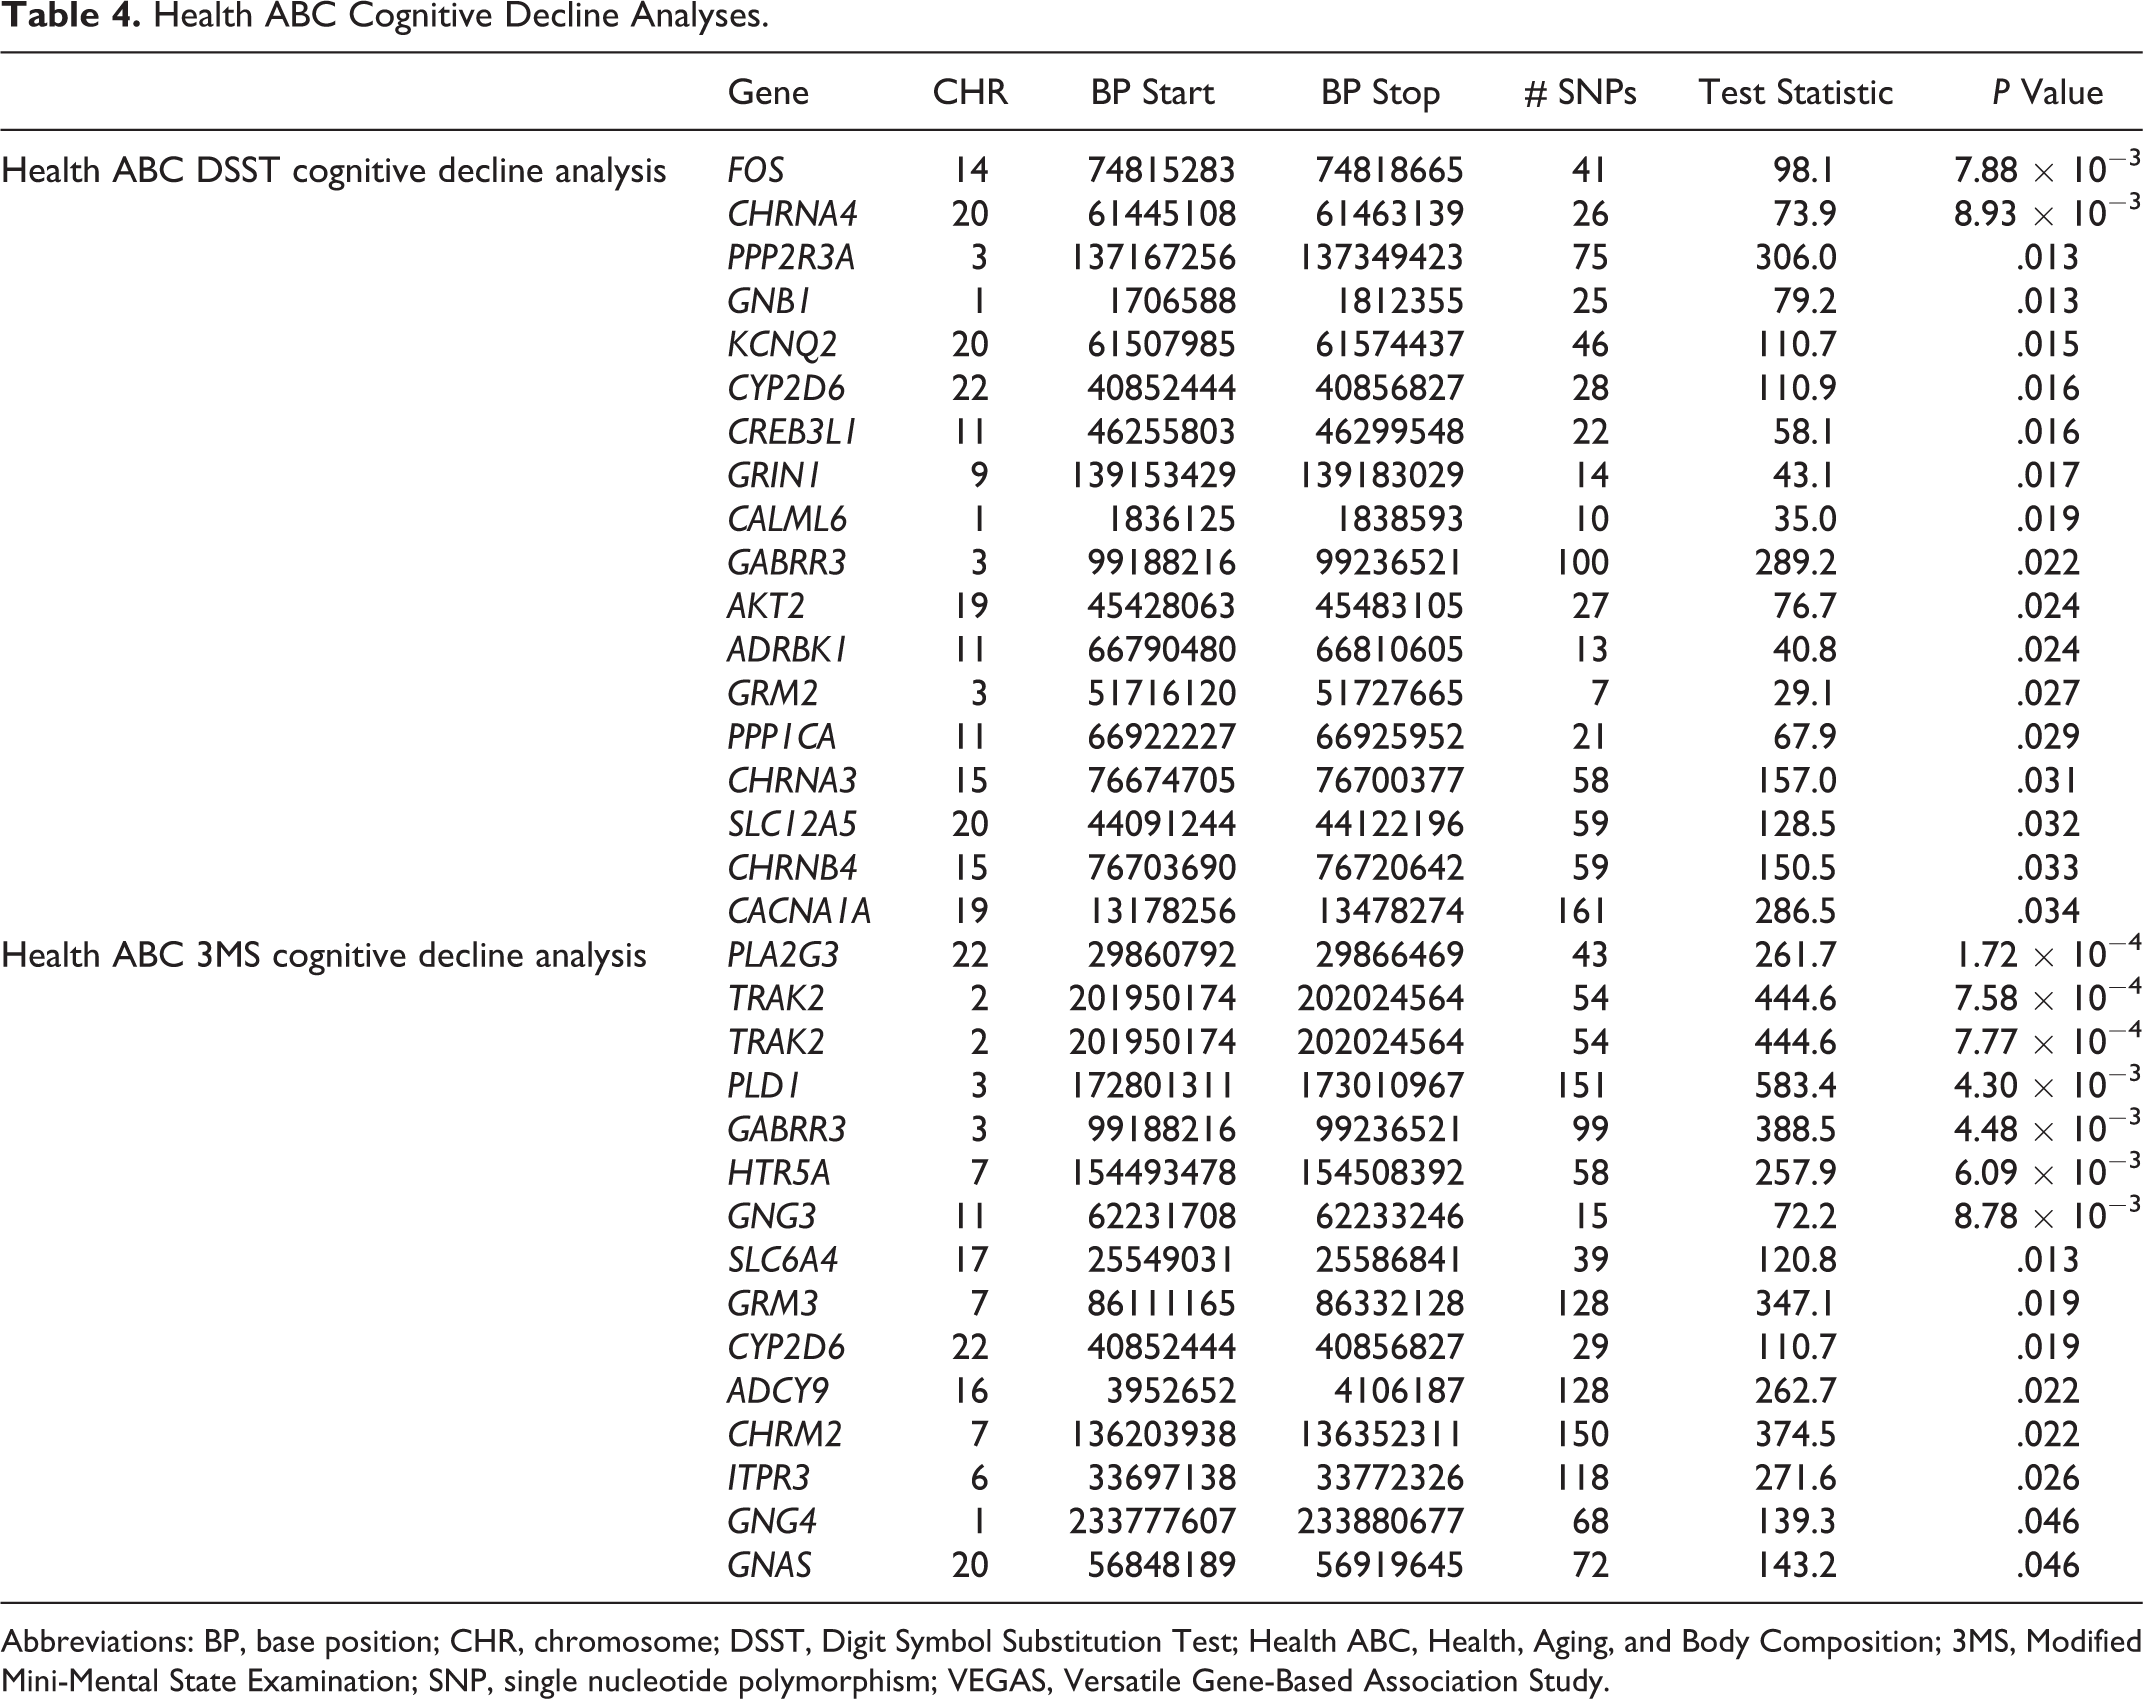
Abbreviations: BP, base position; CHR, chromosome; DSST, Digit Symbol Substitution Test; Health ABC, Health, Aging, and Body Composition; 3MS, Modified Mini-Mental State Examination; SNP, single nucleotide polymorphism; VEGAS, Versatile Gene-Based Association Study.
We used the SOF and MrOS cohorts to replicate our findings from the Health ABC analyses. In both cohorts, 13 genes were significant. GNG4 (G protein subunit gamma 4), found in the Health ABC 3MS cognitive trajectory and 3MS decline analyses, was replicated in the SOF cohort. KCNQ2 (potassium voltage-gated channel subfamily Q member 2), found in the Health ABC DSST cognitive trajectory and DSST decline analyses, was replicated in the MrOS cohort. The results from our replication analyses are shown in Figure 1, and the full results for the SOF and MrOS analyses are provided in Table 5.
SOF and MrOS Cognitive Decline Analyses.
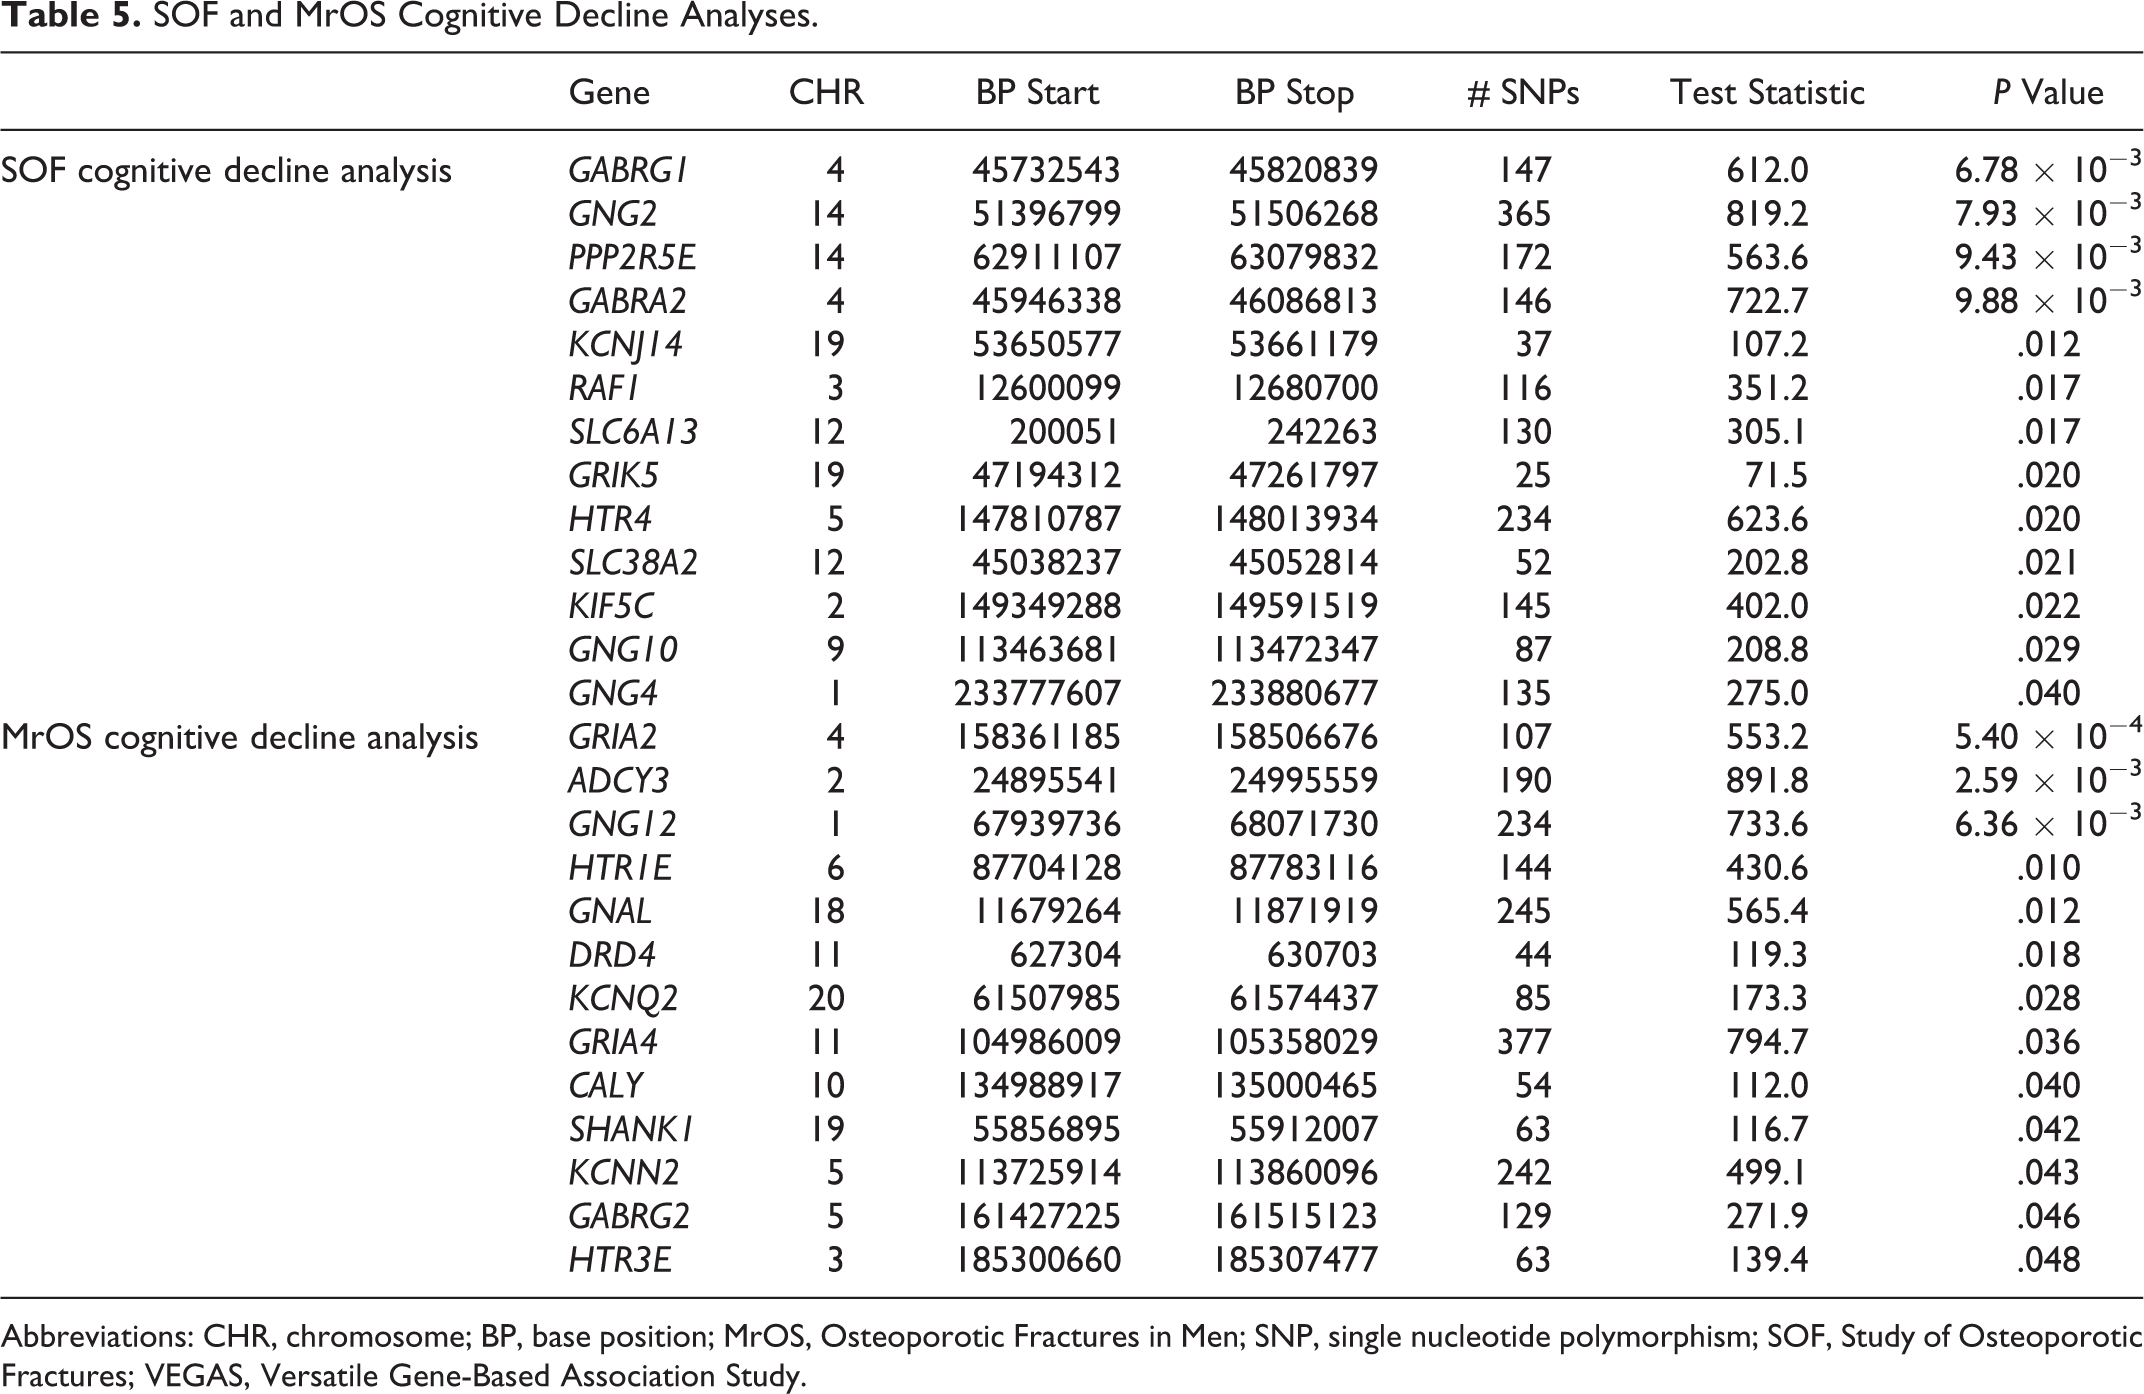
Abbreviations: CHR, chromosome; BP, base position; MrOS, Osteoporotic Fractures in Men; SNP, single nucleotide polymorphism; SOF, Study of Osteoporotic Fractures; VEGAS, Versatile Gene-Based Association Study.
Gene Expression Analyses
Gene expression analyses were conducted for GNG4 and KCNQ2, the 2 genes from the Health ABC analyses that were replicated in the MrOS or SOF cohorts, using information from 3 publicly available data sets of regional brain and cell type gene expression.
We next evaluated the extent to which GNG4 and KCNQ2 are expressed in brain regions associated with the cognitive functions measured in our study. Expression levels were analyzed in 10 adult brain regions, with increased expression found in areas often implicated in dementia such as the hippocampus, putamen, and frontal cortex when compared to white matter. For GNG4, the regions of highest expression were the hippocampus, putamen, and frontal cortex, and the region of lowest expression was intralobular white matter. There was a 2.4-fold difference in expression between the hippocampus and intralobular white matter (P = 1.7 × 10−41). For KCNQ2, the regions of highest expression were the hippocampus, frontal cortex, and temporal cortex, whereas the region of lowest expression was intralobular white matter. There was a 2.8-fold difference in expression between the hippocampus and intralobular white matter (P = 3.0 × 10−72). The high expression of GNG4 and KCNQ2 in highly plastic brain regions such as hippocampus and frontal cortex 47 supports the possibility that these genes may have a role in cognitive function. Plots of expression levels for GNG4 and KCNQ2 by neuroanatomical region are shown in Figure 2.
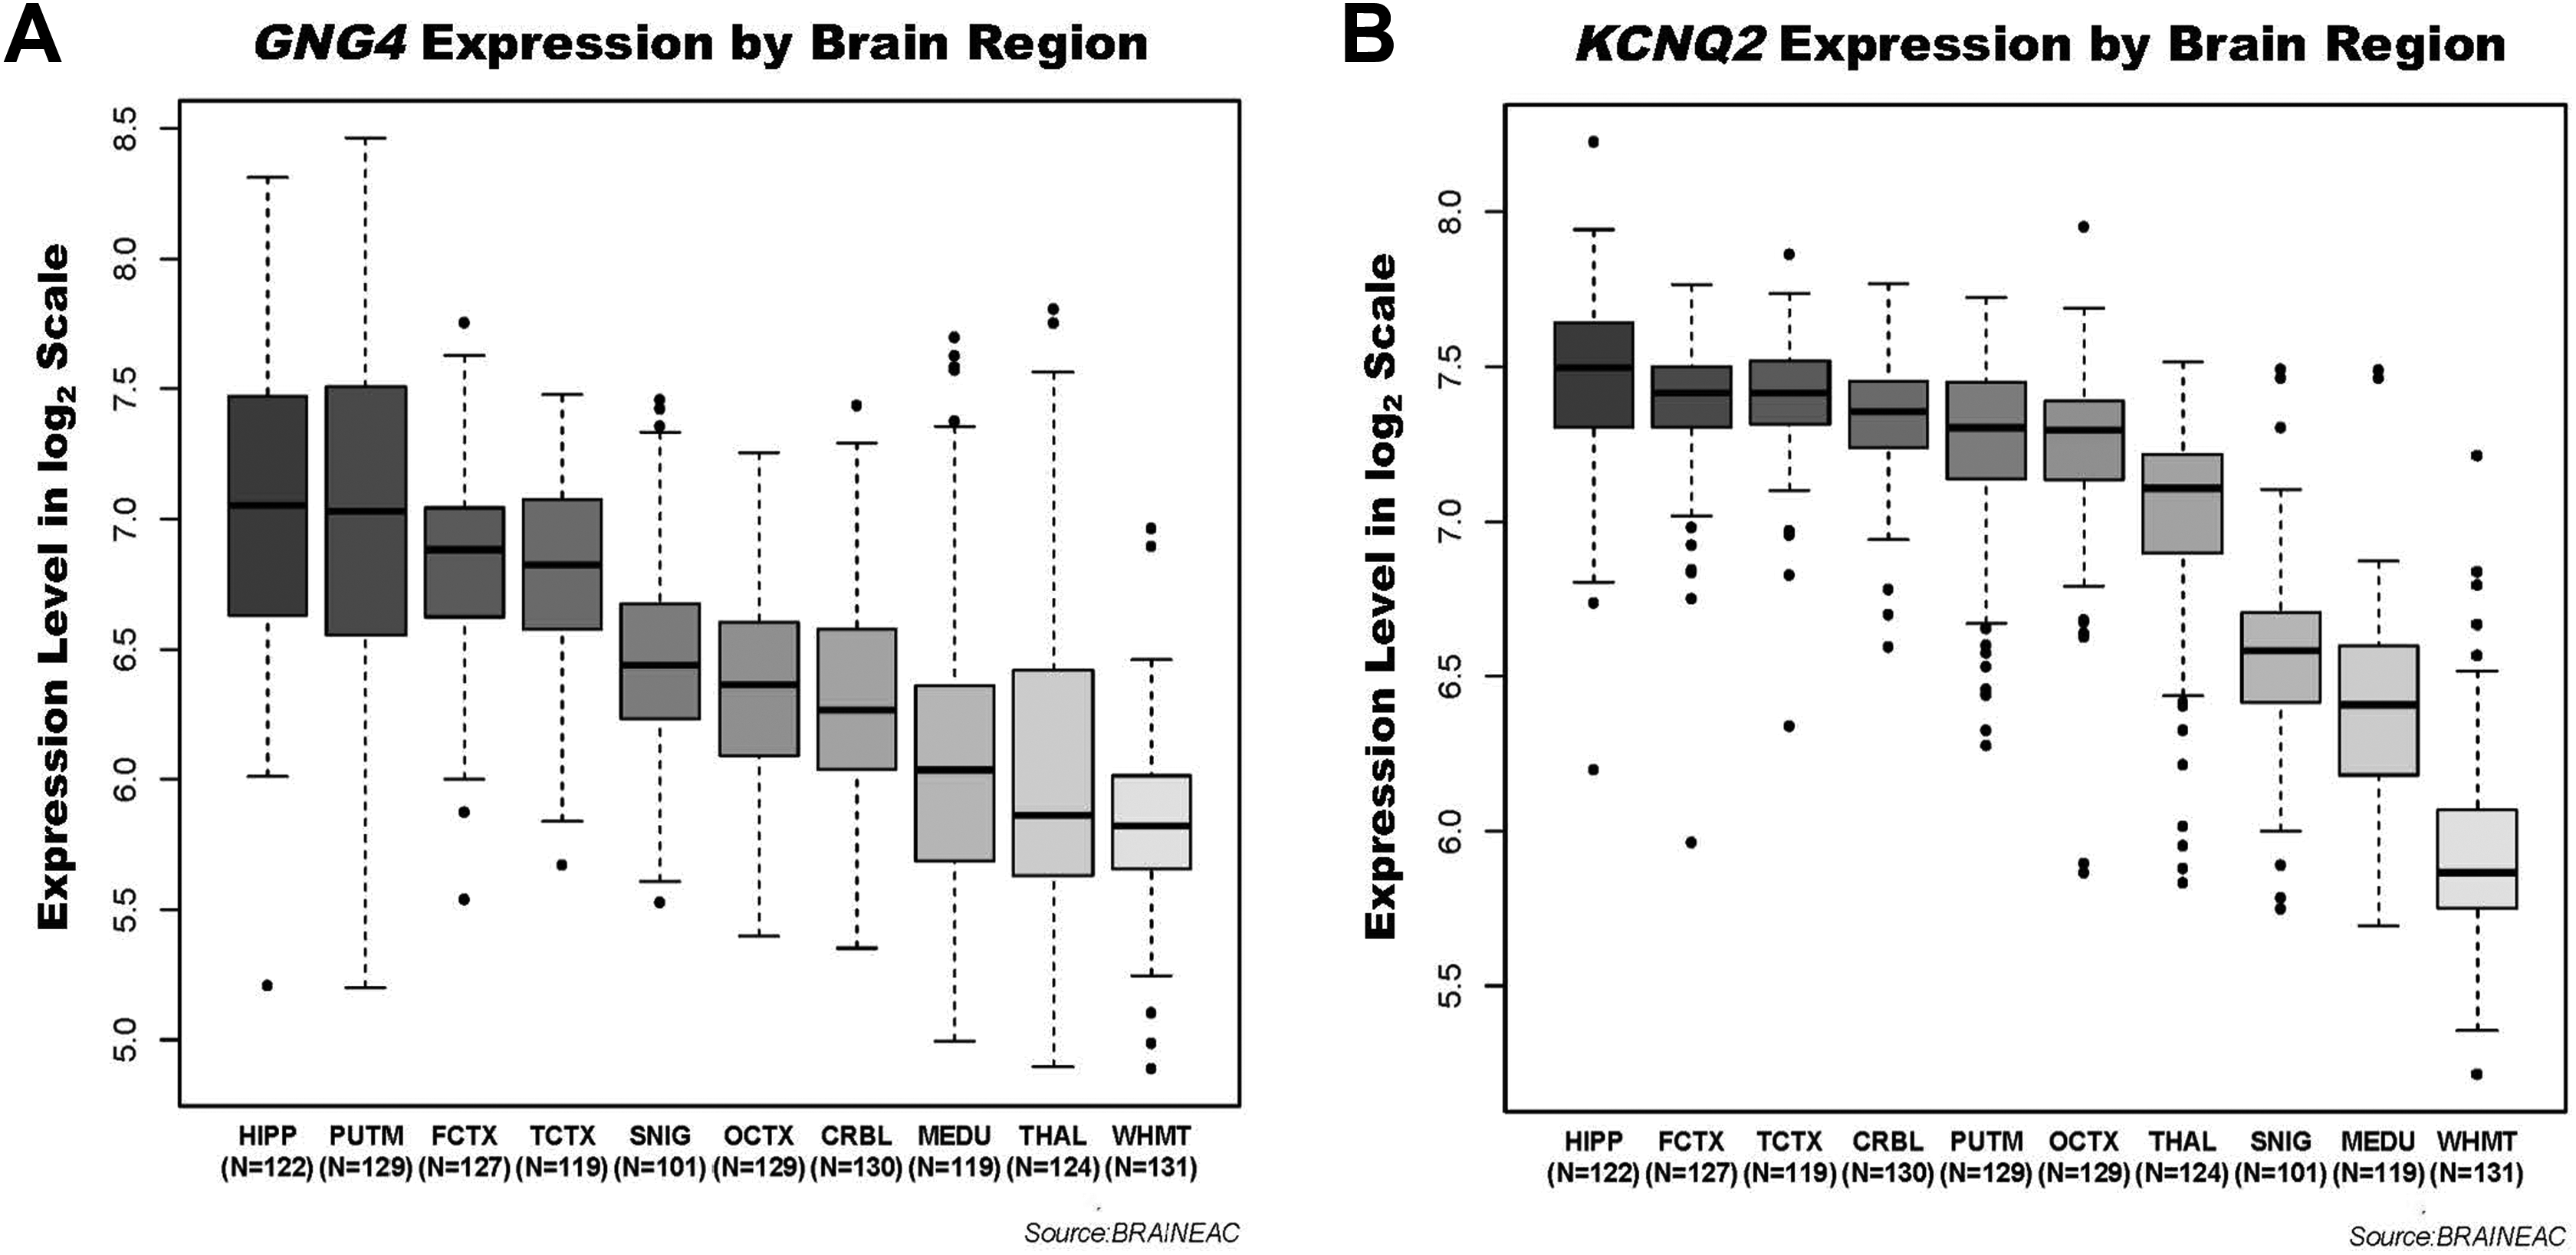
GNG4 and KCNQ2 are most highly expressed in human hippocampus. Results of gene expression analyses for 10 brain regions in a cohort of cognitively normal adults are shown. The number of samples included for each brain area is shown below the region label on the x-axis.
To explore and qualitatively assess the temporal expression patterns of GNG4 and KCNQ2, we used expression data from human brain ranging from 5.7 pcw to 82 years old from HBT. We observed that across all 6 brain areas included in the data set, GNG4 expression appeared to decrease over older adulthood, whereas KCNQ2 expression remained relatively stable after birth. Plots of expression levels for GNG4 and KCNQ2 versus age are shown in Figure 3. Separate cell-specific gene expression analyses in human brain tissue suggested that both transcripts are most highly expressed in fetal astrocytes. For GNG4, neurons were the second highest expressing population, whereas KCNQ2 showed second highest expression in adult astrocytes and only modest expression in neurons (Supplemental Figure 1).
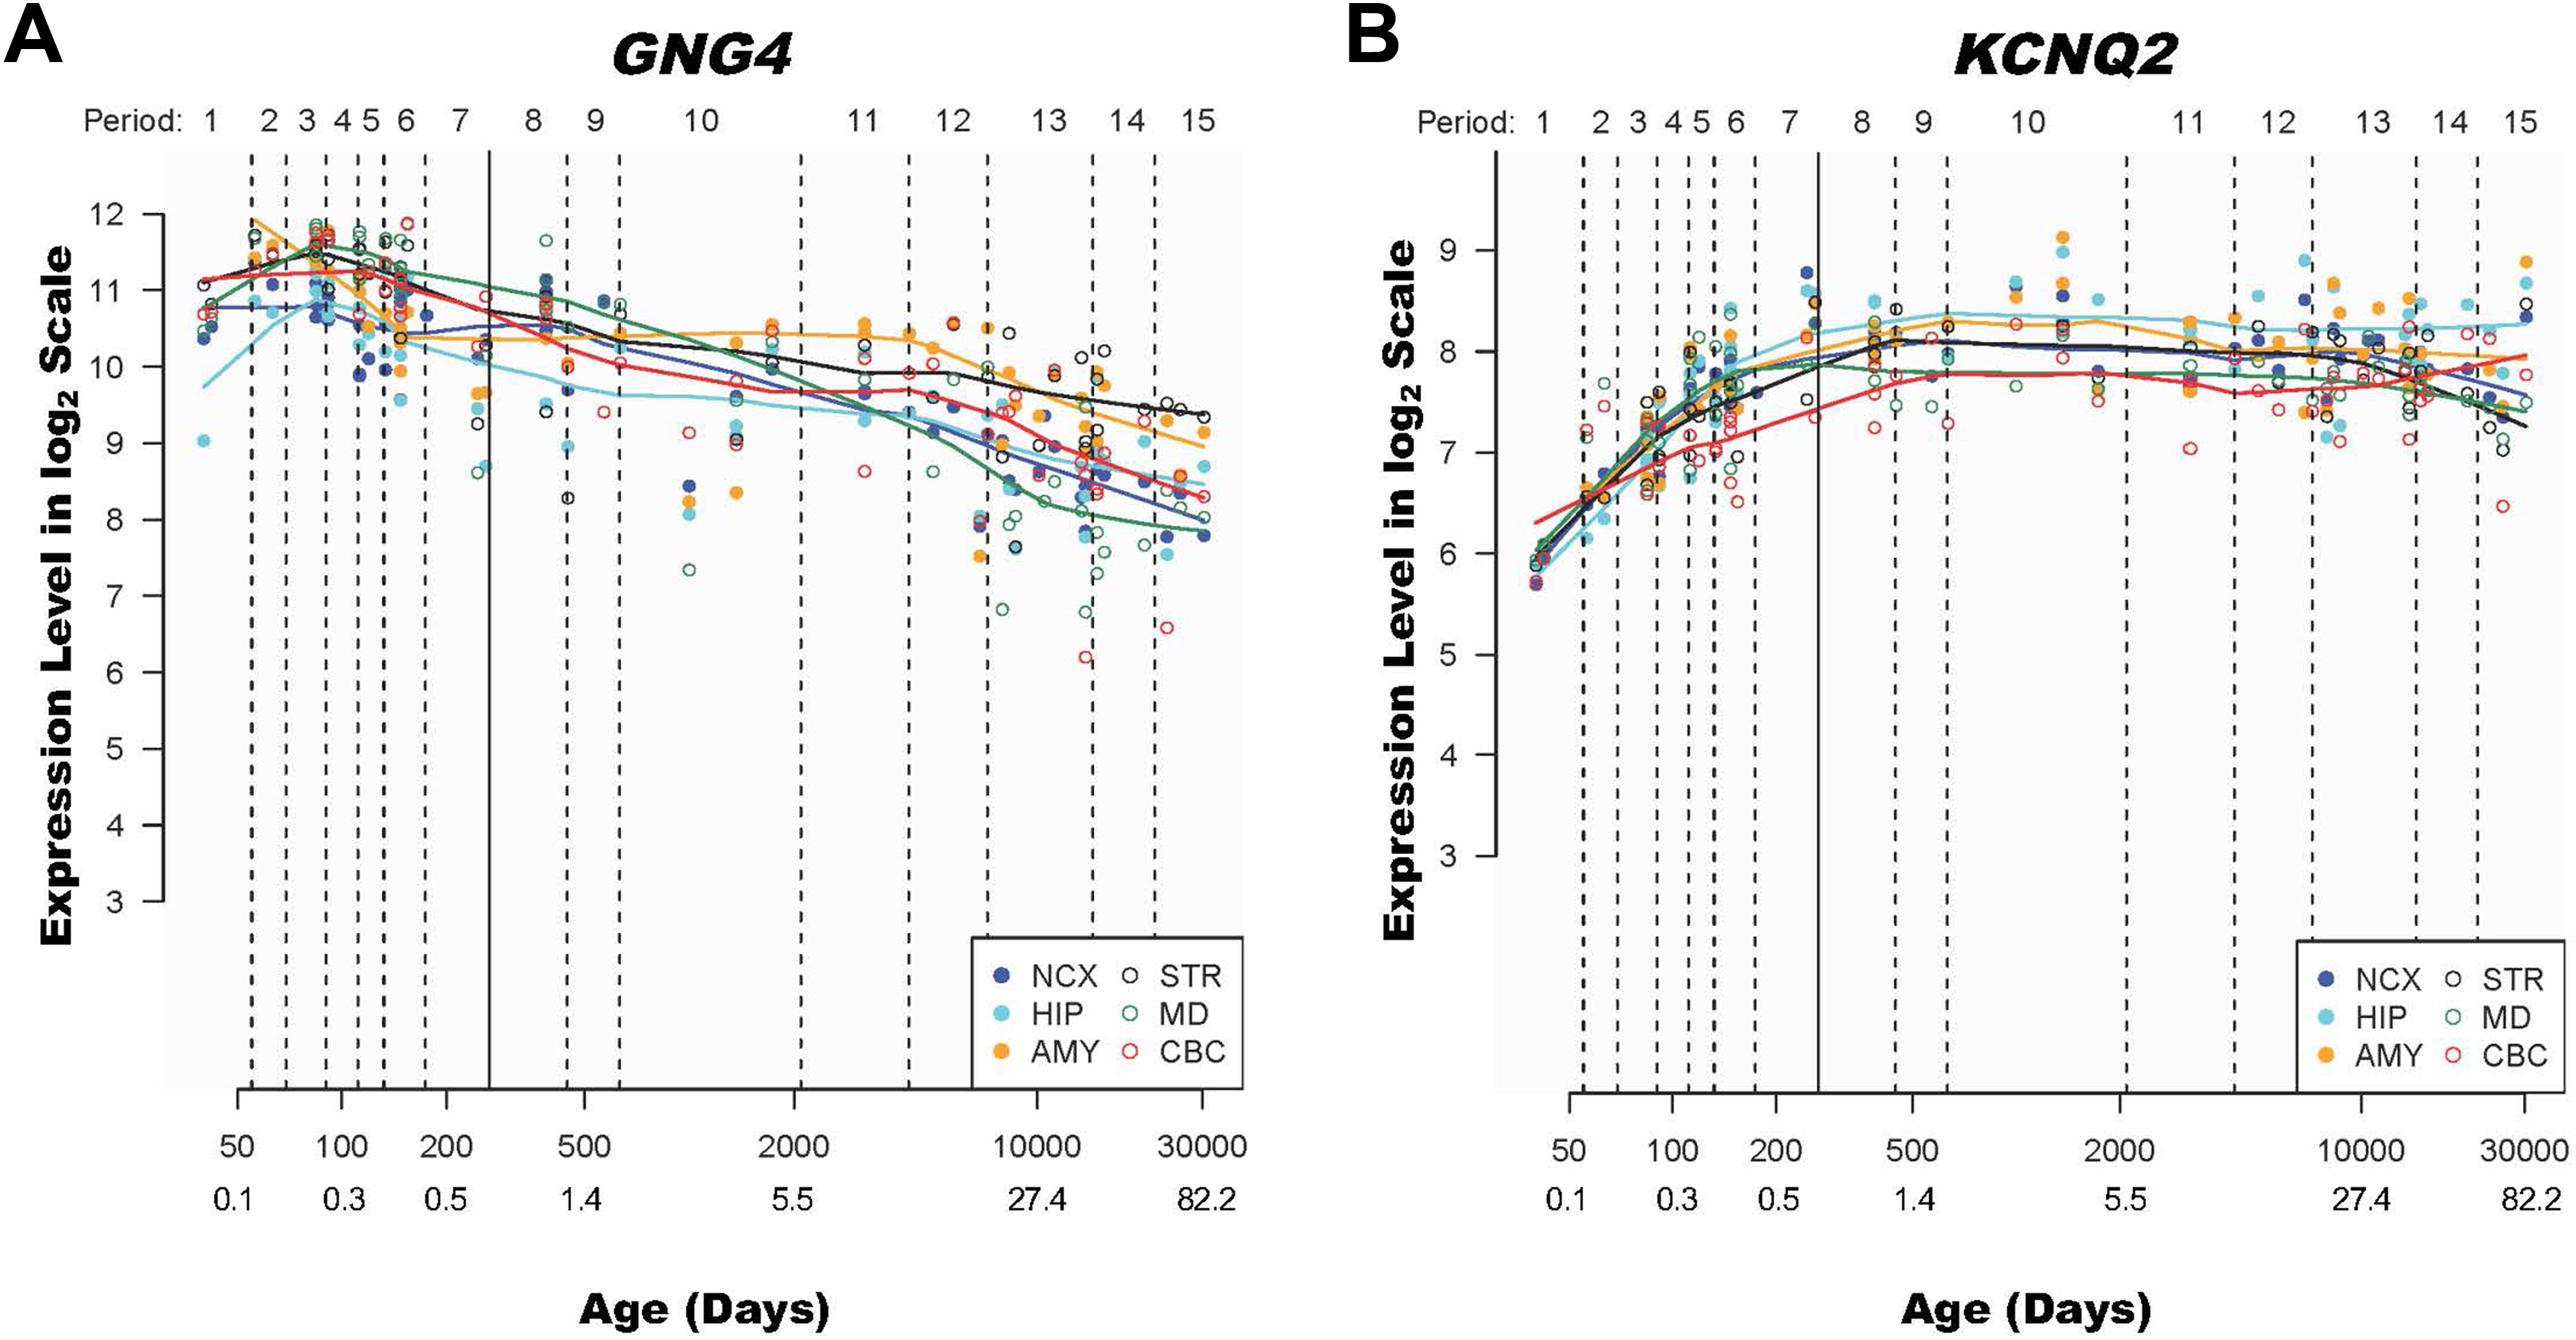
GNG4 and KCNQ2 expression varies across the human life span. GNG4 and KCNQ2 expression levels over the human life span are shown. The period is a developmental staging system developed by Kang et al 41 and used to categorize the human lifespan from embryonic development to late adulthood. Age is expressed in days and years from conception and plotted on a log scale for ease of viewing. Age in years was rounded to the nearest decimal point and added by the authors manually after generating the figures in HBT.
Discussion
Our findings implicate neurotransmitter pathway genes GNG4 and KCNQ2 with cognitive decline in 3 population-based cohorts of cognitively normal older adults. Both GNG4 and KCNQ2 were replicated in independent cohorts and showed greater expression in the hippocampi versus other neuroanatomical regions in a publicly available human post-mortem gene expression data set. Further, GNG4 showed a decrease in expression from birth to old age in human brain tissue. Although our results were not significant after correction for multiple testing, they were replicated in separate cohorts, have regional brain expression patterns consistent with our outcome of interest, and are biologically plausible given the existing literature. Moreover, these findings represent an important methodological step forward in the assessment of how genetic variation influences risk of cognitive decline.
GNG4 is a modulator and transducer of several transmembrane signaling systems 48 and plays a role in hemostasis and glucagon response. 49 Further, recent experimental evidence suggests that GNG4 is down-regulated in the brain tissue of rodent models of AD 49 and an SNP near GNG4 (rs291353) has been nominally associated with age at menopause in the Framingham Heart Study. 50 In the context of the Framingham Heart Study’s findings, our finding that GNG4 replicated in the all-female SOF cohort is particularly interesting. Though the role of estrogen on cognition and neurodegenerative disease is yet to be fully elucidated, there is evidence to support it as a modifier of cognitive decline and dementia risk. 51 –56 Given this, it may not be coincidental that the GNG4 association with cognitive decline was replicated in the all-female SOF cohort but was not significant in the all-male MrOS cohort. The role of GNG4 in female-specific cognitive decline in aging remains to be further investigated in studies specifically designed to probe this question.
KCNQ2 is a transmembrane potassium channel gene that is part of the acetylcholinergic pathway and can harbor pathogenic mutations associated with epilepsy, 57 suggesting that KCNQ2 may be important for restraining excessive neuronal signaling. Beyond the known association with epilepsy, there is growing evidence that KCNQ2 is also associated with memory impairment in mice 58 and age-related memory impairment in drosophila. 59 Recent evidence shows that KCNQ2 expression is decreased by αβ, one of the pathological proteins associated with AD. 60 Whether the effects of αβ on KCNQ2 expression mediate the memory impairments observed in model organisms remains unknown, but increased seizures and excitatory activity have been identified in AD mouse models 61 –63 as well as human patients 64 and are linked to cognitive impairment. Under this framework, αβ suppression of KCNQ2 expression may contribute to the increased seizures, excitatory activity, and memory impairments seen in AD. Whether KCNQ2 is related in a similar fashion to cognitive decline remains an open area of research.
Of note, both genes showed highest expression in fetal astrocytes. Although speculative, these findings could potentially suggest that genetic variation in GNG4 and KCNQ2 could be important during neurodevelopment. If this proves to be true, it would suggest that cognitive trajectories in aging are influenced by common variation in utero. Astrocytes are critical for synaptogenesis, and the role of these cells in adult neurologic and neuropsychiatric diseases is becoming increasingly appreciated. 65 Additional studies will be required to validate this hypothesis and further explore the role of common genetic variation on neurodevelopmental processes and cognitive decline in aging.
We specifically tested the role of neurotransmitter pathway genes in cognitive decline because their protein products are more accessible as therapeutic targets than many other proteins implicated in cognitive decline. As candidate genes, GNG4 and KCNQ2 are particularly interesting given our observation that both are expressed at highest levels in human hippocampal tissue compared to 9 other functionally relevant brain regions and that GNG4 expression decreases during aging. The hippocampus is one of the first regions of the brain to atrophy and accumulate pathologic αβ during the earliest stages of AD and is a sensitive biomarker of clinical progression in mild cognitive impairment and AD. 66 –68 Although additional studies will be required to validate these findings, both candidate genes and their protein products represent potentially tractable drug targets. KCNQ2 is perhaps the more tractable of the 2 genes, as there are already drugs known to alter potassium channel activity. One of these drugs, flupertine (an aminopyridine), works by opening potassium channels and has been shown to ameliorate stress-induced memory deficits in rodents. 69 Flupertine is already approved for use in many major markets as a nonopioid analgesic. 70,71 Similarly, given our observation that GNG4 expression decreases across the brain with advancing age and evidence from murine models of AD that GNG4 expression is decreased in neurodegenerative disease, 49 it is plausible that drug treatments which increase GNG4 could modify cognitive trajectory.
This study represents an important step forward in the utilization of gene-based testing to identify neurotransmitter pathway gene candidates that may predispose healthy individuals to cognitive decline, which may ultimately put them at greater risk of (or be an early indicator of) dementia. Our study benefits from its use of 3 well-established and characterized community-based cohorts. As community-based studies, Health ABC, SOF, and MrOS studies are designed to be more representative of the general population. Our findings are supported by gene expression evidence from pathologically confirmed normal individuals. However, our study cannot confirm causality or infer directionality in the relationship between GNG4 or KCNQ2 and cognitive decline. Further, our findings relied upon nominal P values and will require further testing to establish their significance. We were limited in the cognitive measures and phenotype scoring available for analyses, with 3 different neuropsychological tests (3MS, MMSE, and DSST) used to assess cognitive change/decline and thus our findings may capture alterations in different domains of cognition (eg, general function versus episodic memory). Our studies were conducted in individuals of European descent and thus may not apply to other populations. Future studies will be required to confirm these findings and establish mechanisms by which GNG4 and KCNQ2 may alter risk of cognitive decline in diverse populations. Assessing gene relationships with cognitive phenotypes derived from more specific (rather than global) neuropsychological measures may also provide insight into the cognitive domains that are particularly vulnerable in aging (e.g., memory and executive function).
In this study, we used gene-based testing to identify an association between GNG4 and KCNQ2 with cognitive decline in 3 cohorts of healthy older adults. We found evidence in pathology specimens suggesting links between these gene candidates and regions of the brain often associated with cognitive decline in aging and dementia. Our findings underscore the importance of neurotransmitter genes in the cognitive trajectory of healthy aging individuals and identify 2 promising candidate genes. Future studies in larger cohorts with more detailed cognitive characterization will be required to generalize these findings to broader populations and determine whether GNG4 and KCNQ2 directly alter disease risk and outcome.
Supplemental Material
Supplemental_Figure_1 - Neurotransmitter Pathway Genes in Cognitive Decline During Aging: Evidence for GNG4 and KCNQ2 Genes
Supplemental_Figure_1 for Neurotransmitter Pathway Genes in Cognitive Decline During Aging: Evidence for GNG4 and KCNQ2 Genes by Luke W. Bonham, Daniel S. Evans, Yongmei Liu, Steven R. Cummings, Kristine Yaffe, and Jennifer S. Yokoyama in American Journal of Alzheimer’s Disease & Other Dementias
Supplemental Material
Supplementary_Data_1 - Neurotransmitter Pathway Genes in Cognitive Decline During Aging: Evidence for GNG4 and KCNQ2 Genes
Supplementary_Data_1 for Neurotransmitter Pathway Genes in Cognitive Decline During Aging: Evidence for GNG4 and KCNQ2 Genes by Luke W. Bonham, Daniel S. Evans, Yongmei Liu, Steven R. Cummings, Kristine Yaffe, and Jennifer S. Yokoyama in American Journal of Alzheimer’s Disease & Other Dementias
Footnotes
Acknowledgments
The authors thank the Heath, Aging, and Body Composition (Health ABC), SOF, and MrOS research participants for their long-standing dedication. The SOF is supported by the National Institutes of Health (NIH) funding. The National Institute on Aging (NIA) provides support under the following grant numbers: R01 AG005407, R01 AR35582, R01 AR35583, R01 AR35584, R01 AG005394, R01 AG027574, and R01 AG027576. The MrOS Study is supported by the NIH funding. The following institutes provided support: the NIA, the National Institute of Arthritis and Musculoskeletal and Skin Diseases (NIAMS), the National Center for Advancing Translational Sciences, and NIH Roadmap for Medical Research under the following grant numbers: U01 AG027810, U01 AG042124, U01 AG042139, U01 AG042140, U01 AG042143, U01 AG042145, U01 AG042168, U01 AR066160, and UL1 TR000128. The NIAMS provides funding for the MrOS ancillary study “GWAS in MrOS and SOF” under the grant number RC2 AR058973. The NIAMS provides funding for the MrOS ancillary study “replication of candidate gene associations and bone strength phenotype in MrOS” under the grant number R01 AR051124. The Health ABC study was supported by NIA contracts N01AG62101, N01AG62103, and N01AG62106. The genome-wide association study was funded by NIA grant 1R01AG032098-01A1 to Wake Forest University Health Sciences and genotyping services were provided by the Center for Inherited Disease Research (CIDR). The CIDR is fully funded through a federal contract from the NIH to The Johns Hopkins University, contract number HHSN268200782096C.
Declaration of Conflicting Interests
The authors declared no potential conflicts of interest with respect to the research, authorship, and/or publication of this article.
Funding
The authors disclosed receipt of the following financial support for the research, authorship, and/or publication of this article: Primary support for data analyses was provided by NIA K24 AG031155 (KY), NIA K01 AG049152 (JSY), the Larry L. Hillblom Foundation 2012-A-015-FEL and 2016-A-005-SUP (JSY), an AFTD Susan Marcus Memorial Fund Clinical Research Grant (JSY), and the Tau Consortium (JSY).
Supplemental Material
Supplementary material for this article is available online.
References
Supplementary Material
Please find the following supplemental material available below.
For Open Access articles published under a Creative Commons License, all supplemental material carries the same license as the article it is associated with.
For non-Open Access articles published, all supplemental material carries a non-exclusive license, and permission requests for re-use of supplemental material or any part of supplemental material shall be sent directly to the copyright owner as specified in the copyright notice associated with the article.