
Abstract
Introduction
Alzheimer’s disease (AD), an age-related disease, is slowly progressive and devastating neurodegenerative disorder. It is the most prevalent cause of dementia and cognitive impairment among aging population. 1 About 50 million people are living with dementia around the world, and are predicted to triple by 2050. 2 Histopathologically, AD is characterized by the accumulation of intracellular neurofibrillary tangles (NFTs),3,4 along with neurite damage and synaptic dysfunction. AD may occur either sporadically or on a hereditary basis, which are related to certain genetic mutations.5,6 Diagnosis approaches to AD have been improved clearly over the last hundred years, which contains neuropsychological tests, cerebrospinal fluid (CSF) or plasma analyses, and image analysis. 5 However, the only definitive diagnosis of AD may be made post-mortem, with detection of characteristic amyloid plaques and neurofibrillary tangles in the brains of affected patients.
Serum biomarkers can be obtained easily, non-invasive and inexpensive. Blood-based C-reactive protein as a marker has been well-established and widely used to evaluate the activity of inflammatory bowel disease (IBD). Besides, some newly discovered cytokines, antibodies and non-coding RNAs are also used in different aspect of IBD management. 7 And several commercially available blood biomarkers have been used in diagnosis of prostate cancer. 8 Therefore, it is particularly necessary to develop blood diagnostic markers for AD. Previous studies have identified some biomarkers against a single pathological change (plasma neurofilament light, Aβ and Tau), biomarkers pannels (miRNA pannels, etc.) 9 and peripheral inflammatory biomarkers (inflammatory cytokines, immune cell population, component cascade molecules, etc.), 10 that may represent tissue responses to AD-related pathologies. However, there is still a long way before these markers can be utilized in clinical practice. 11
Epigenetic modifications have emerged as important players in AD. 12 Chi Him Poon and his colleagues 13 summarized the role of aberrant DNA methylation on the expression of APP, β-Secretase 1 (BACE1), PSEN1, Sortilin-related receptor 1 (SORL1), as well as many other genes, which are involved in Aβ and tau protein–related pathologies of AD. In addition, DNA methylation also plays an important role in inflammatory response in AD patients. 14 Therefore, identification of aberrant DNA methylated genes in peripheral blood could be considered as biomarkers of AD patients,15-18 which is useful for early detection and treatment of AD.
There are also numerous studies analyzing gene expression in peripheral blood from AD19-26 However, no researchers combine DNA methylation and gene expression for comprehensive analysis in AD. Previous studies27-29 have shown that comprehensive analysis of DNA methylation and gene expression provides the capabilities to properly identify the pathways and genes that mediate the pathology of cancer. Herein, we analyzed publicly available gene expression microarrays (GSE63060 and GSE63061) 30 and gene methylation microarray (GSE153712) 31 to identify pathways and genes associated with AD. Our results may provide bioinformatics evidence for a better understanding of the development of AD, and also may be useful for detecting candidate molecules of blood diagnostic markers for AD.
Materials and Methods
Dataset Retrieval and Filtering
The Gene Expression Omnibus (GEO) database is the largest database of gene expression and mainly based on microarray data. We used “Alzheimer’s disease AND Homo sapiens [porgn:__txid9606]” as keywords and made search criteria as follows: (1) The type of research are “Expression profiling by array” and “Methylation profiling by array”; (2) The selected data set must be genome-wide mRNA transcriptome data and DNA methylation data; (3) These data come from blood samples of AD patients and healthy controls; (4) Both standardized and original dataset are enrolled. We finally enrolled and downloaded 2 mRNA datasets (GSE63060 and GSE63061) 30 and 1 methylation dataset (GSE153712) 31 in this study.
Screening of Differentially-Methylated/Expressed Genes
Differentially-expressed genes were evaluated by edgeR and limma packages in R-4.0.5. Differential methylation sites were evaluated by CHAMP package, followed by identification of differentially-methylated (hypermethylated and hypomethylated) genes corresponding to the differential methylation sites. Those differentially-methylated genes were annotated in their gene regions (including promoter regions) and CpG islands. No covariates were included in the above analysis. Both differentially-expressed/methylated genes in AD were identified with the false discovery rate (FDR) < .05 compared with the controls.
Enrichment Analysis of Differentially-Methylated/Expressed Genes
Differentially-methylated/expressed genes were utilized for functional analysis using the GeneCodis4.0 database (https://genecodis.genyo.es/). Gene Ontology (GO) enrichment analysis and the Kyoto Encyclopedia of Genes and Genomes (KEGG) pathway enrichment analysis were performed under the screening criteria of FDR <.05.
Protein-Protein Interaction Network of Differentially-Methylated/Expressed Genes
To explore the interactions between proteins (encoded by differentially-methylated/expressed genes), we used the online database STRING to construct the Protein-Protein Interaction (PPI) network with Cytoscape software and filtered genes by the CytoHubba plug-in through 2 algorithms. Genes that presented in the top 8 genes of each algorithm were considered as hub genes.
Verification of the Differentially-Methylated/Expressed Genes in the Additional Online Datasets
To further validate the expression of identified differentially-methylated/expressed genes, the datasets of GSE140829, GSE85426 and GSE132903 was selected. Additionally, to study whether differentially-methylated/expressed genes have diagnostic value, receiver operating characteristic (ROC) analysis was performed through the pROC package in R in the GSE140829 dataset.
Verification of the Differentially-Methylated/Expressed Genes by Quantitative Real-Time PCR
To further detect the expression of the differentially-methylated/expressed genes in peripheral blood from AD patients, the in vitro qRT-PCR was performed. A total of 15 AD patients and 17 healthy controls were enrolled. The inclusion criteria of AD are as follows: (1) Patients meet the criteria of the NINCDS-ADRDA; (2) Patient’s first onset without taking any special drugs; (3) Patients had normal routine physical examination and had no family history of dementia. Those AD patients with the previous history of mental illness, dementia, head trauma and alcohol dependence were excluded. The exclusion criteria of all volunteers are as follows: (1) Individuals with other types of dementia such as vascular dementia and Lewy body dementia; (2) Individuals had a history of mental illness; (3) Individuals had a history of taking special drugs; (4) Individuals with severe cardiovascular disease; (5) Individuals with diabetes; (6) Individuals or the family disagreed to sign an informed consent. The characteristics of the patients are presented in Supplemental Table 1.
Blood samples were collected from above individuals. Total RNA was extracted using a Blood RNA kit according to the manufacturer’s protocols. Then, gene reverse transcription was performed by FastKing RT Kit (With gDNase) (KR116, TIANGEN, Beijing, China). The quantitative Real-Time (qRT-PCR) was performed in 7300 real-time PCR system (Applied Biosystems) with SuperReal PreMix Plus (SYBR Green) (FP205, TIANGEN, Beijing, China). Relative gene expression was analyzed by the 2-ΔΔCT method. GAPDH and ACTB were used as the internal reference. The sequences of the primers sequences are presented in Supplemental Table 2.
Results
Screening of Differentially–Methylated/Expressed Genes
The flowchart of our bioinformatics analysis is demonstrated in Figure 1. A total of 3360 and 2426 differentially-expressed genes were identified in GSE63060 dataset and GSE63061 dataset, respectively. In detail, there were 1748 up-regulated genes and 1612 down-regulated genes in GSE63060 dataset, while 1236 up-regulated genes and 1190 down-regulated genes were selected in GSE63061 dataset. Volcano plots of all differentially expressed genes in each dataset are presented in Supplemental Figure 1. In addition, a total of 1174 differentially-methylated genes were identified in GSE153712 dataset, including 256 hypermethylated genes and 918 hypomethylated genes. Intersection of differentially-expressed genes and differentially-methylated genes was carried out to obtain differentially–methylated/expressed genes. A total of 4 hypermethylated-low expression genes (Hyper-LGs) and 55 hypomethylated-high expression genes (Hypo-HGs) were obtained. Venn diagrams are shown in Figure 2A and B and the heat map is shown in Figure 2C. Flow chart of the bioinformatics analysis. DMGs: differentially methylated genes; DEGs: differentially expressed genes; Hyper-LGs: Hypermethylation-low expression genes; Hypo-HGs: Hypomethylation-high expression genes; GO: gene ontology; KEGG: Kyoto Encyclopedia of Genes and Genomes; PPI: protein-protein interaction. Identification of differentially-methylated/expressed genes. A-B: Different color represented different datasets: (A) Hyper-LGs; (B) Hypo-HGs. C: The heat map of 4 Hyper-LGs and 55 Hypo-HGs in GSE63060.

Enrichment Analysis of Differentially–Methylated/Expressed Genes
To further investigate the functions of the 4 Hyper-LGs and 55 Hypo-HGs, GO and KEGG functional enrichment were used for analysis. Functional annotation of the 4 Hyper-LGs indicated that mitochondrial cytochrome c oxidase assembly, regulation of protein autophosphorylation, regulation of phosphatidylinositol 3-kinase signaling, GTP metabolic process, etc. were significantly enriched in biological processes. Golgi apparatus, protein phosphatase type 2A complex, etc. were enriched cytological components. Protein phosphatase activator activity, protein binding, protein phosphatase regulator activity, etc. were significantly enriched molecular functions. AMPK signaling pathway, thermogenesis, dopaminergic synapse, etc. were significantly enriched signaling pathways. The detailed results of GO and KEGG analysis, as well as the involved genes are listed in Figure 3A, C, E, and G and Supplemental Table 3. Functional annotation of the 55 Hypo-HGs indicated that neutrophil deregulation, leukocyte migration, phosphorylation, negative regulation of MAP kinase activity, etc. were significantly enriched in biological processes. Membrane, cytosol, nucleus, intracellular membrane-bounded organelle, etc. were significantly enriched cytological components. Protein binding, ATP binding, kinase activity, etc. were significantly enriched molecular functions. Regulation of actin cytoskeleton, chemokine signaling pathway, Fc gamma R-mediated phagocytosis, axon guidance, etc. were significantly enriched signaling pathways. The detailed results of GO and KEGG analysis, as well as the involved genes are listed in Figure 3B, D, F, and H and Supplemental Table 4. GO and KEGG enrichment analysis of differentially-methylated/expressed genes. Biological process (A), Cytological component (B), Molecular function (C) and KEGG (D) of 4 Hyper-LGs. Biological process (E), Cytological component (F), Molecular function (G) and KEGG (H) of 55 Hypo-HGs.
Protein-Protein Interaction Network of Differentially-Methylated/Expressed Genes
We didn’t find any interaction relationship between the 4 Hyper-LGs in the PPI network. On the other hand, a total of 25 interaction gene pairs were identified in the 55 Hypo-HGs through PPI network (Figure 4A). Cytochrome c oxidase assembly factor COX14 (C7orf26) and integrator complex subunit 3 (INTS3) were genes with the highest interaction score, .996. The top 8 Hypo-HGs identified by Maximal Clique Centrality (MCC) and degree analysis are presented in Supplemental Table 5. Eight genes were common to the top 8 genes of both 2 analyses: Rac family small GTPase 2 (RAC2), FGR proto-oncogene, Src family tyrosine kinase (FGR), LYN proto-oncogene, Src family tyrosine kinase (LYN), protein kinase C delta (PRKCD), myosin IF (MYO1F), integrin subunit alpha 5 (ITGA5), semaphorin 4D (SEMA4D), and growth arrest specific protein 7 (GAS7). The PPI network of these 8 hub Hypo-HGs is shown in Figure 4B. The PPI network of 55 Hypo-HGs. A: The PPI network of 55 Hypo-HGs; B: The protein interaction among the 8 hub Hypo-HGs through MCC.
Verification of the Differentially-Methylated/Expressed Genes in Online Datasets
In our study, 4 Hyper-LGs and 8 hub Hypo-HGs were selected for verification in GSE140829 dataset (Figure 5) GSE85426 and GSE132903 datasets (Figure 6). In the GSE140829 dataset, B and T lymphocyte attenuator (BTLA) and GTPase, IMAP family member 7 (GIMAP7) were markedly down-regulated, and FGR, GAS7, PRKCD, RAC2 and MYO1F were significantly up-regulated, which was consistent with our bioinformatics analysis. Whereas, C12orf62 and protein phosphatase 2 regulatory subunit B’gamma (PPP2R5C) were down-regulated without any significance. LYN, SEMA4D and ITGA5 were up-regulated without any significance, either. In both GSE85426 and GSE132903 datasets, MYO1F and SEMA4D were up-regulated in AD. In addition, the possible diagnostic utility of these genes was assessed by ROC curve analysis in GSE63060 (Figure 7). We found the AUC values of these genes in each dataset were all greater than .61, indicating that they have a potential diagnostic value for AD. Verification of the 4 Hyper-LGs and 8 hub Hypo-HGs in GSE140829 dataset. *P < .05; **P < .01; ns: not significant. Verification of the 2 hub Hypo-HGs in GSE85426 and GSE132903 datasets. *P < .05; ns: not significant. Prognostic values of the 4 Hyper-LGs and 8 hub Hypo-HGs hub genes in AD.


Quantitative Real-Time PCR Validation of the Differentially-Methylated/Expressed Genes
We detected the expression of 1 Hyper-LG PPP2R5C and 8 hub Hypo-HGs in peripheral blood from 15 patients with AD and 17 healthy controls (Figure 8). Detail values of mean and SD are listed in supplemental Table 6. The qRT-PCR results showed that ITGA5 was up-regulated significantly, while the expression levels of the other 8 genes were not significantly different between the healthy group and the patient group. QPCR verifications of the differentially-methylated/expressed genes clinically. ***P < .001.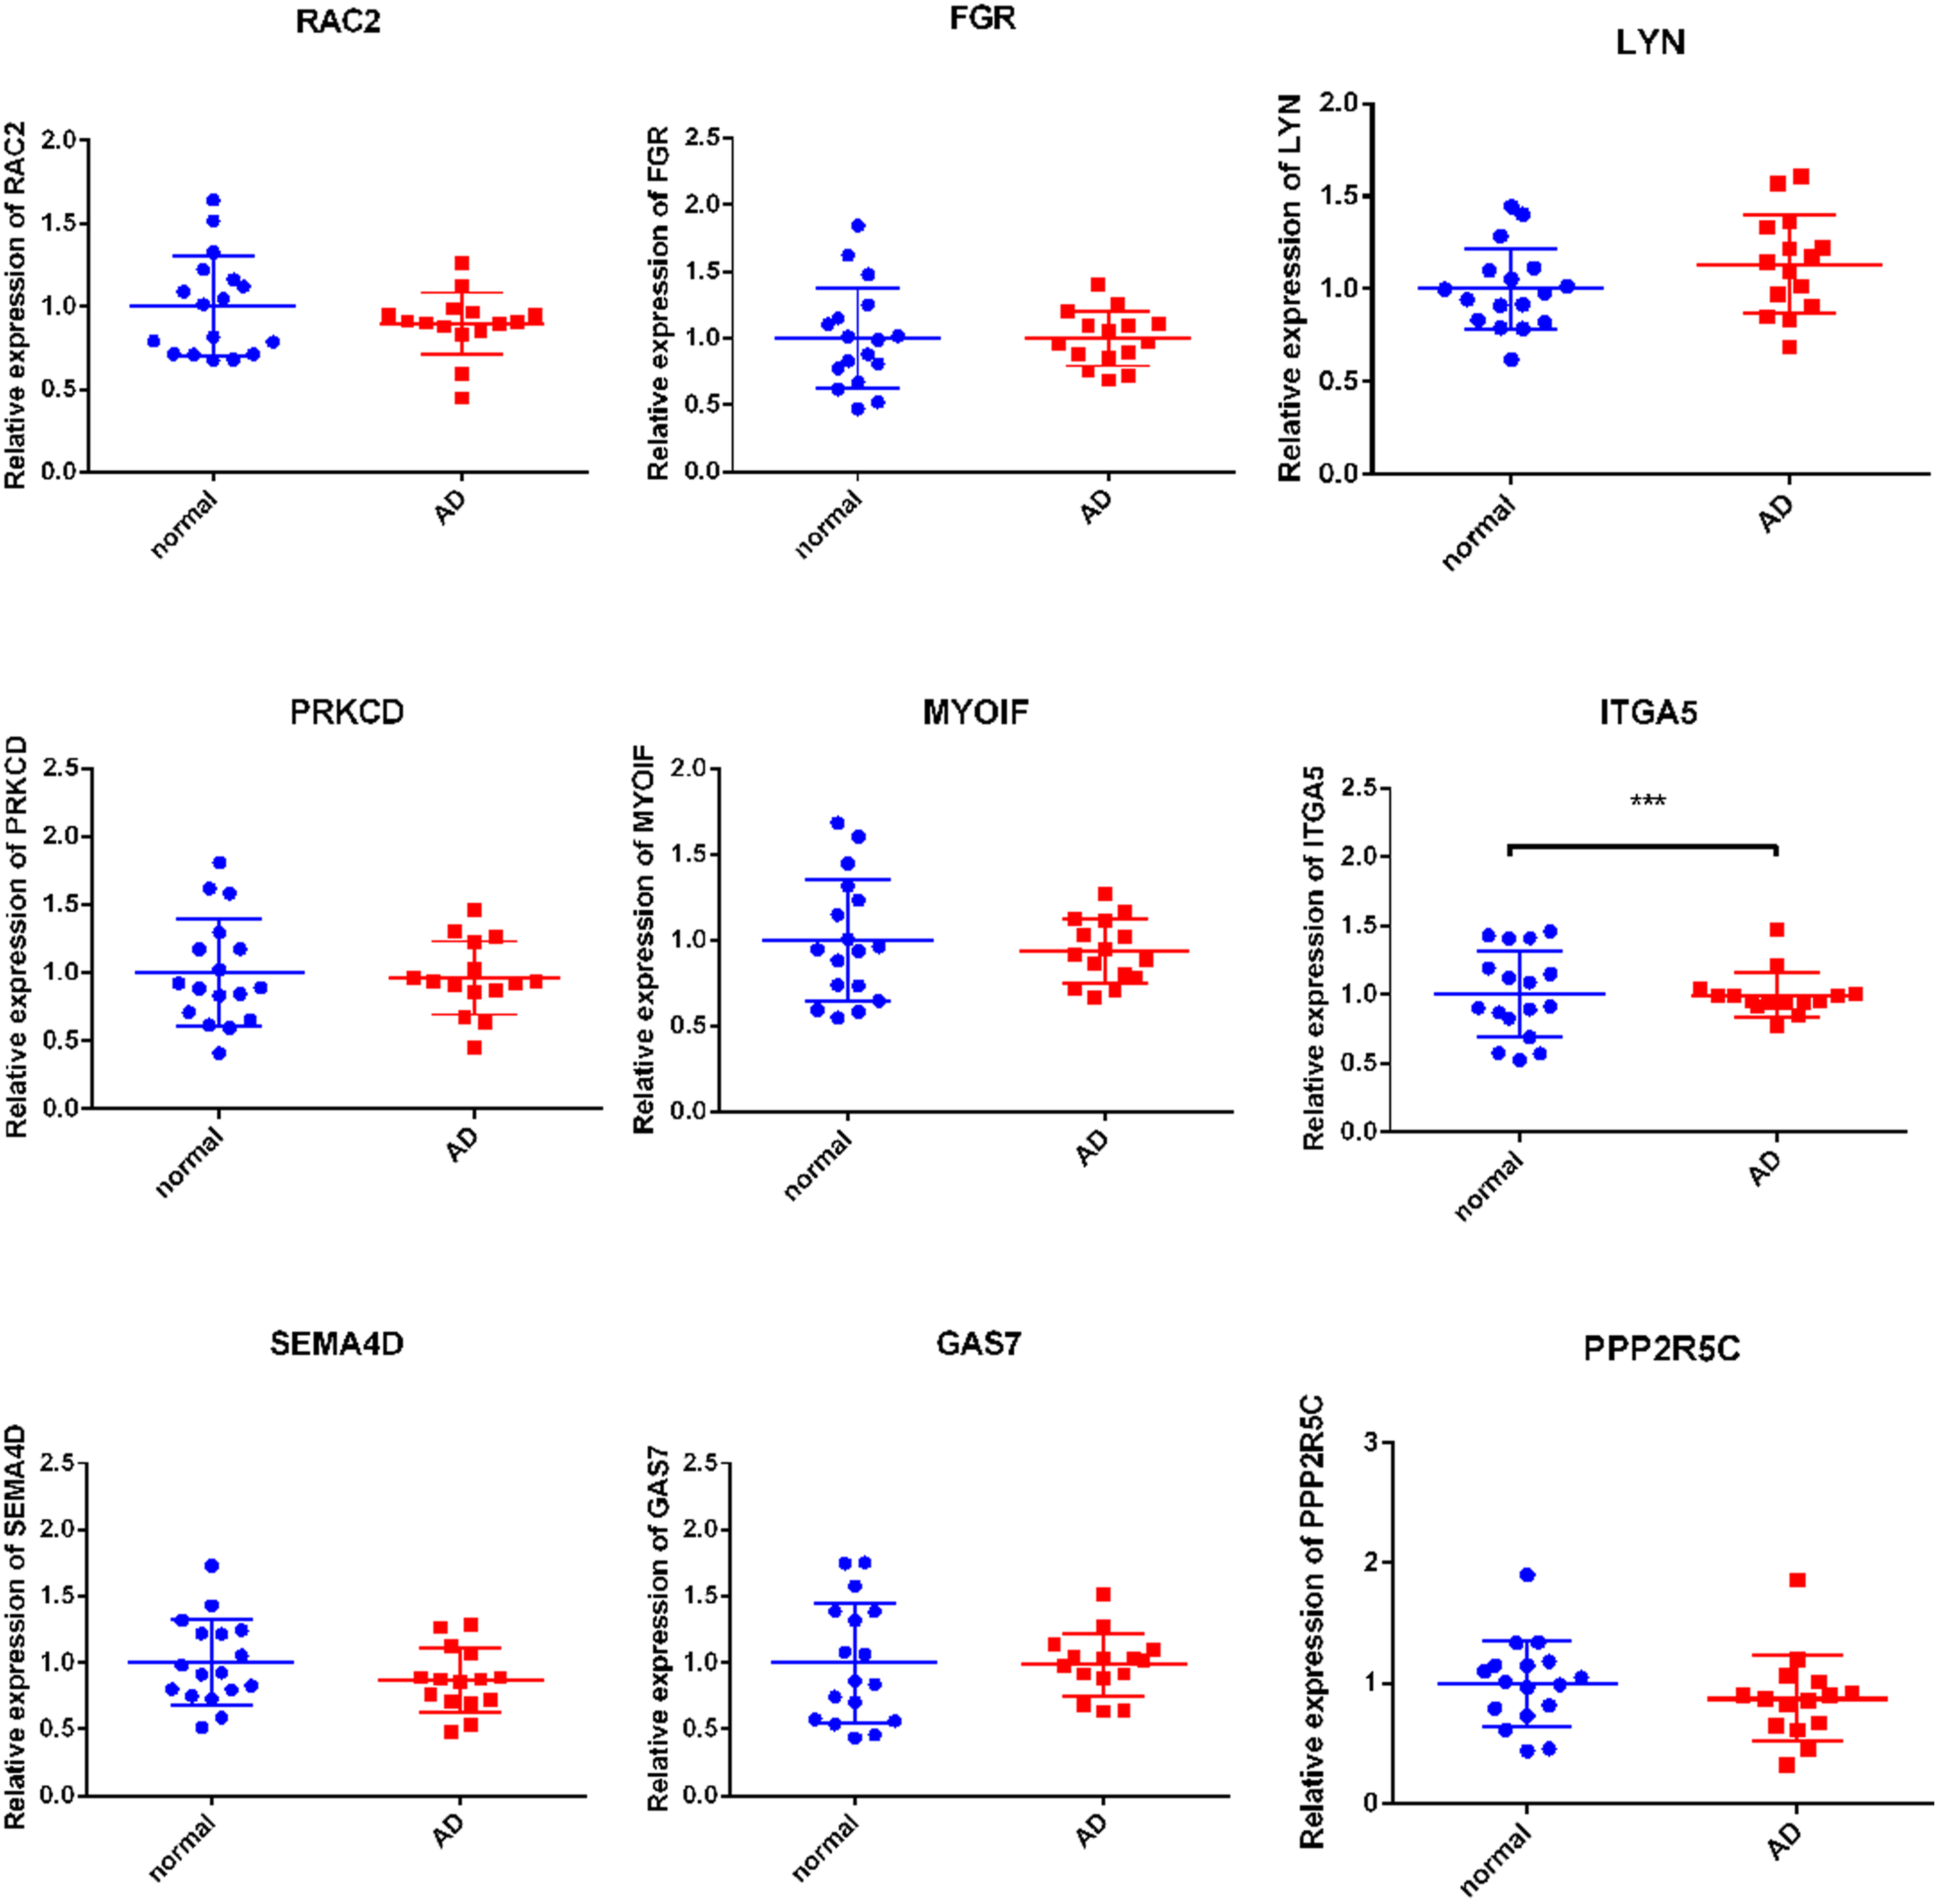
Discussion
Disease pathology and potential biomarkers identified with post-mortem could not be entirely generalizable to live patients. Blood directly interacts with the brain. Abnormalities in the blood may indicate abnormalities in the brain or abnormal brain-blood interactions, revealing the possible pathological mechanisms of AD and providing convenient molecules for the diagnosis of AD. 32 A novel gene expression contrastive trajectory inference (GE-cTI) method has been developed to discover 85%-90% predictive pathways in the brain is also common in peripheral blood. 33 In this sense, peripheral blood potentially provides minimally invasive in vivo biomarkers for live patient screening in clinic. Herein, using the GSE153712 methylation microarray dataset and the GSE63060 and GSE63061 gene expression datasets, we analyzed DNA methylation and gene expression in peripheral blood of AD patients.
Gene expression can be regulated by DNA methylation. However, genes from brain and peripheral blood have different methylation between AD patients and controls, 34 indicating that the characteristics of DNA methylation in different tissue are very different.35-37 The reported relationship between gene expression and methylation was obtained from only a small number of samples and at the level of individual genes.38,39 This method is inefficient and difficult for finding a positive result. We conducted an integrated analysis at the chip level to quickly find the differentially-methylated/expressed genes, and then combined protein interaction and enrichment analysis to screen out target molecules with diagnostic value for AD. In this study, a total of 4 Hyper-LGs and 55 Hypo-HGs were identified. Of particular interest were 4 Hyper-LGs and the top 8 Hypo-HGs identified by MCC and degree analysis. Moreover, these genes all had potential diagnostic utility for AD.
Consistent with our analysis results, a recent network-based gene expression analysis of 2 independent mRNA microarrays 40 also showed that Fc gamma receptor-mediated phagocytosis was significantly dysregulated in AD patients. They revealed that Fc gamma receptor-mediated phagocytosis was involved in cognitive function and CSF biomarkers. It has been reported that Fc gamma receptors are increased 41 and necessary for the inflammation in the AD brain. 42 In our study, we found LYN, RAC2 and PRKCD were markedly overexpressed in AD in the Fc gamma receptor-mediated phagocytosis pathway. Moreover, LYN, RAC2 and PRKCD, as well as FGR also participated in chemokine signaling pathway. Consistent with the results from entorhinal cortex, SWItchMiner algorithm identified chemokine signaling pathway as the top 1 pathway switched between AD patients and healthy controls. 43 A case-control study 44 also revealed that chemokines cutaneous T-cellattracting chemokine (CTACK), monokine induced by gamma interferon (MIG) and stromal cell-derived factor-1alpha (SDF-1α) were increased in peripheral blood of AD. In brief, the peripheral immune system may contribute to the pathophysiology of AD through Fc gamma receptor-mediated phagocytosis pathway and chemokine signaling pathway by LYN, RAC2, PRKCD and FGR.
Myosin IF is a long-tailed myosin, expressed predominantly in the mammalian immune system 45 and required in cytoskeleton remodeling and migration of microglia/immune cells.45,46 In AD patients, neutrophils extravasated to brain venules and were present in the parenchyma, along with neutrophil extracellular traps (NETs). 47 It suggested that innate immune cells contributed to AD pathogenesis, and MYO1F may play crucial roles in the process and is expected to serve as a diagnostic marker for AD.
B and T lymphocyte attenuator, also known as CD272, is a member of CD28 superfamily. 48 It is down-regulated in colorectal cancer and involved in immune cells (CD8+ T cells, CD4 memory resting T cells, resting NK cells, M1 macrophages, etc.) infiltration and functions as a prognosis biomarker in colorectal cancer. 49 Increasing evidence has demonstrated that immune cells infiltrate the brain during AD progression and recent researches demonstrated that the number of CD8+ T cells is elevated in CSF, blood and brain of AD patients.50,51 Further analysis in APP Swedish PS1 dE9 (APP-PS1) transgenic mice and aged mice indicated the infiltrated CD8+ T cells in the brain might modulate synaptic plasticity through directly regulating neuronal dysfunction. 51 We speculated that hyper-methylated and low-expressed BTLA in AD patients might contribute to the brain infiltration of immune cells, disrupt the synaptic plasticity. Considering, BTLA shows diagnostic potential for AD.
Dendritic spines are mainly excitatory synapses in the brain and its plasticity and stability are regulated by actin cytoskeleton. Just like synaptic plasticity, regulation of actin cytoskeleton is relevant in the pathogenesis of AD.52-54 Some actin-binding proteins involving Rac, cofilin, etc. are able to modulate the complex actin dynamics.53,54 In this study, we found the regulation of actin cytoskeleton enriched with ITGA5 and RAC2 was dysregulated, suggesting that synaptic plasticity was dysfunction.
Protein phosphatase 2 regulatory subunit B’gamma, also known as B56
Studies have found that GAS7 can interact with hyperphosphorylated Tau to prevent its aggregation, thus potentially playing a neuroprotective role in AD. 58 However, some studies also have found that high levels of GAS7 will interfere with kinesin, which may destroy the homeostasis of Tau in the central nervous system. 59 Therefore, GAS7 protein level has a very important regulatory role for the development of AD. 60 Our analysis results showed that GAS7 was significantly elevated in the peripheral blood of AD patients, which was controversy to the data in the brain.58-60 We speculate that this may be the result of feedback regulation. Peripheral GAS7 may be used as a marker of hyperphosphorylated Tau protein aggregation in the brain of AD patients.
Semaphorins are among the 4 major classes of axon-guidance molecules. 61 Sema3A is the mostly studied Semaphorins on the relationship with AD, and accumulation of an internalized form of Sema3A may contribute to degeneration of neurons in vulnerable fields of the hippocampus during AD. 62 Sema4D is a class 4 transmembrane-semaphorin and up-regulated in neurons of AD 63 and it may play a role in oligodendrogenesis in injured mouse brains. 64 Neuroimaging studies indicated that white matter abnormalities could promote cognitive impairment and AD pathology and could be a potential treatment target. 65 Sema4D in peripheral blood may be a diagnostic marker for white matter abnormalities in AD.
Regrettably, when we assessed the expression of key differentially-methylated/expressed genes in peripheral blood from AD patients, we did not get a perfect result consistent with the bioinformatics analysis results. On 1 hand, the number of patients or controls was less than 20 and this may not be a good representation. On the other hand, the control group was not strict enough from the perspective of age: the average age of the control group is 71 years old, while the average age of the case group is 78 years old. There is another possible reason that the course of AD patients in this study ranged from 1 year to 9 years, with a large span, indicating that these patients are in different stages of AD, which will also lead to a great variation level in the patient group.
Conclusions
We found some differentially-methylated/expressed genes, such as RAC2, FGR, LYN, PRKCD, MYO1F, ITGA5, SEMA4D, GAS7, GIMAP7, C12orf62, PPP2R5C and BTLA. We also found that these genes could be enriched in several important pathways related to AD pathology, such as Fc gamma receptor-mediated phagocytosis, regulation of actin cytoskeleton, axon guidance and chemokine signaling pathway. Dysfunction of these genes in peripheral blood of AD suggesting the importance of brain-peripheral axis and the key role of the immune system in synaptic plasticity and neuroinflammation. However, there are limitations to our study. Firstly, further experiments are needed to confirm the linkage between these genes (as well as pathways) and AD pathology. Secondly, ADNI dataset is further needed to validate the expression and methylation of identified genes.
Supplemental Material
Supplemental Material - Screening of Crucial Differentially-Methylated/Expressed Genes for Alzheimer’s Disease
Supplemental Material for Screening of Crucial Differentially-Methylated/Expressed Genes for Alzheimer’s Disease by Haiyuan Qiu and Qiuyan Weng in American Journal of Alzheimer's Disease & Other Dementias®
Footnotes
Author Contributions
HQ and QW performed research and analyzed data; HQ designed the research; HQ wrote the paper; HQ and QW revised the manuscript for important intellectual content. All co-authors read and approved the final manuscript.
Declaration of Conflicting Interests
The authors declared no potential conflicts of interest with respect to the research, authorship, and/or publication of this article.
Funding
The authors received no financial support for the research, authorship, and/or publication of this article.
Supplemental Material
Supplemental material for this article is available online.
References
Supplementary Material
Please find the following supplemental material available below.
For Open Access articles published under a Creative Commons License, all supplemental material carries the same license as the article it is associated with.
For non-Open Access articles published, all supplemental material carries a non-exclusive license, and permission requests for re-use of supplemental material or any part of supplemental material shall be sent directly to the copyright owner as specified in the copyright notice associated with the article.