
Abstract
Aim:
The aim of this study is to extend our understanding of the molecular mechanism of Alzheimer’s disease (AD).
Methods:
We downloaded the gene expression profile GSE18309 from Gene Expression Omnibus database, which includes 3 genechips from patients with mild cognitive impairment (MCI), 3 genechips from patients with AD, and 3 genechips from normal controls (NC). Linear Models for Microarray Data package was used to identify differentially expressed genes (DEGs) in MCI versus NC group and AD versus NC group. Then, we extracted the overlapping DEGs of 2 groups for functional and pathway enrichment analysis using FuncAssociate software accompanied by gene ontology and expressing analysis systematic explorer, respectively. Further, AutoDock4 (http://autodock.scripps.edu/) was used to predict the docking site between small molecule ligands and proteins of a key DEG.
Results:
A total of 60 DEGs were identified. Biological processes associated with nutrient response and muscle development were significantly dysregulated in AD and MCI. In addition, we identified 2 active binding sites (A5 and L30) on protein structure of cholecystokinin A receptor (CCKAR) for drug design.
Conclusion:
The DEGs including CCKAR might be used as biomarkers for early diagnosis of AD. However, further experimental studies are needed to confirm our results.
Keywords
Introduction
Alzheimer’s disease (AD) is one of the most disabling and burdensome health conditions worldwide. The AD mainly affects individuals older than the age of 60, and the risk of developing this disease increases steadily with age. 1 Thus, AD severely reduces the quality of life of elderly people. 2 Improvement in early diagnosis and identification of disease biomarkers represent key issues in AD research.
The pathogenesis of AD is heterogeneous and complex caused by aging in concert with both genetic and environmental risk factors. 3 The neurodegeneration that occurs in AD is associated with a number of abnormalities, such as decreased number of cells, dystrophic neuritis, amyloid-β deposits, increased activation of prodeath genes and signaling pathways, impaired energy metabolism and mitochondrial function, and chronic oxidative stress. 4 –6 Besides, a previous study demonstrated extensive abnormalities in insulin and insulin-like growth factor type I and II signaling mechanisms in brains with AD and suggested AD may represent a neuroendocrine disorder that resembles diabetes mellitus. 7 Although there are several popular hypotheses about its pathogenesis, the genetic mechanisms of AD are far from being clear.
In this study, we aimed to extend our understanding of the disease mechanisms of AD. We downloaded gene expression profiles on AD and mild cognitive impairment (MCI) with normal controls (NC) from Gene Expression Omnibus (GEO) database and analyzed the differentially expressed genes (DEGs) in AD. The dysregulated biological processes and pathways were identified using functional enrichment analysis. Further, we identified the ligand binding sites on the protein chain of a key DEG.
Materials and Methods
Affymetrix Microarray Data
We extracted the gene expression profiles on patients with AD compared with NC from GEO database, which were deposited by Chen and colleagues (ID: GSE18309). This microarray study was conducted among the Taiwanese population, including 3 genechips from peripheral blood mononuclear cells (PBMCs) of patients with MCI, 3 genechips from PBMC of patients with AD, and 3 genechips from PBMC of NC. The platform was GPL570 (Affymetrix Human Genome U133 Plus 2.0 Array). Annotation information for all probe sets of ATH1 (25K) is provided by Affymetrix company. We downloaded the raw CEL file and the probe annotation file.
Data Preprocessing and DEGs Analysis
The original data were converted into identifiable expression form, the missing part was imputed, 8 and then the complemented data were normalized. 9 We divided data into 2 groups (NC vs MCI and NC vs AD) and used Linear Models for Microarray Data (LIMMA) 10 package in R language to identify DEGs in both groups, respectively. The DEGs only with P < .05 and |log (fold change)| > 1 were selected.
Functional Enrichment Analysis
FuncAssociate is a Web-based tool to help researchers use Gene Ontology (GO) attributes to characterize large sets of genes derived from experiment. 11 The overlapping DEGs of 2 groups (NC vs AD and NC vs MCI) were inputted into FuncAssociate. Based on the hypergeometric distribution, GO terms were enriched. P < .05 was chose as threshold.
Pathway Enrichment Analysis
Expressing analysis systematic explorer (EASE) is a bioinformatics program that provides statistical methods that facilitates the biological interpretation of gene lists derived from results of a microarray analysis. 12,13 We used the Fisher’s exact test in EASE to identify the significantly enriched pathway of the overlapping DEGs. P < .05 was selected as threshold.
Molecular Binding Sites
Molecular docking is a method that predicts the preferred orientation of one molecule to a second when bound to each other to form a stable complex. 14 AutoDock combines an empirical free energy force field with a Lamarckian Genetic Algorithm, providing fast prediction of bound conformations with predicted free energies of association. 15 In this study, we used AutoDock4 (http://autodock.scripps.edu/) to predict the docking sites between small molecule ligands and the 3-dimensional structure of protein chain of a key DEG.
Results
Screening of DEGs
The original data downloaded from GEO databases were normalized at first (Figure 1). From Figure 1, the median values of each sample were almost at the same level, suggesting data were eligible for further analysis. At the cutoff criteria of P < .05 and |log (fold change)| > 1, a total of 395 DEGs and 405 DEGs were identified from NC versus MCI group and NC versus AD group, respectively. There were 60 overlapping DEGs between the 2 groups. This set of DEGs was used for hierarchical clustering analysis. The dendrogram in Figure 2 demonstrates close correlation of the gene expression profiles of PBMC from patients with MCI and AD, which are clustered together, although the gene expression profiles of PBMC from NC are placed in a distinct group.
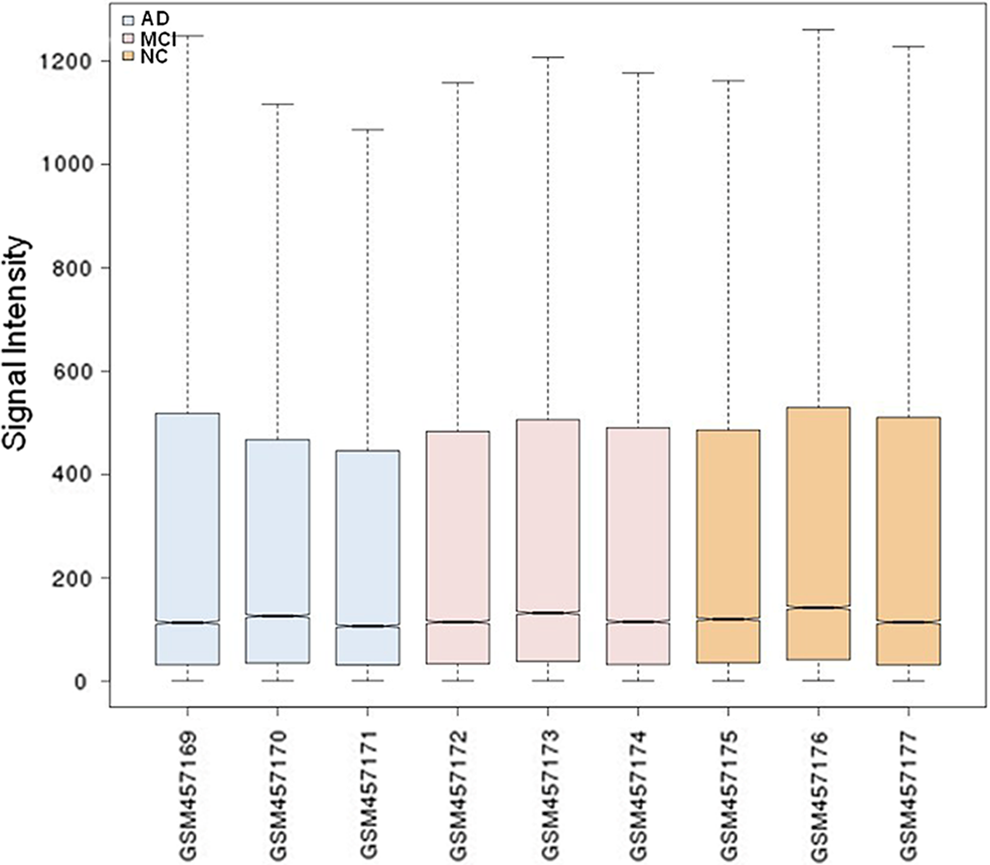
Cassette diagram of expression data after normalization. The boxes in blue, pink, and orange represent Alzheimer’s disease (AD), mild cognitive impairment (MCI), and normal control (NC), respectively. The median values of each sample are almost at the same level after normalization, suggesting data are eligible for further analysis.
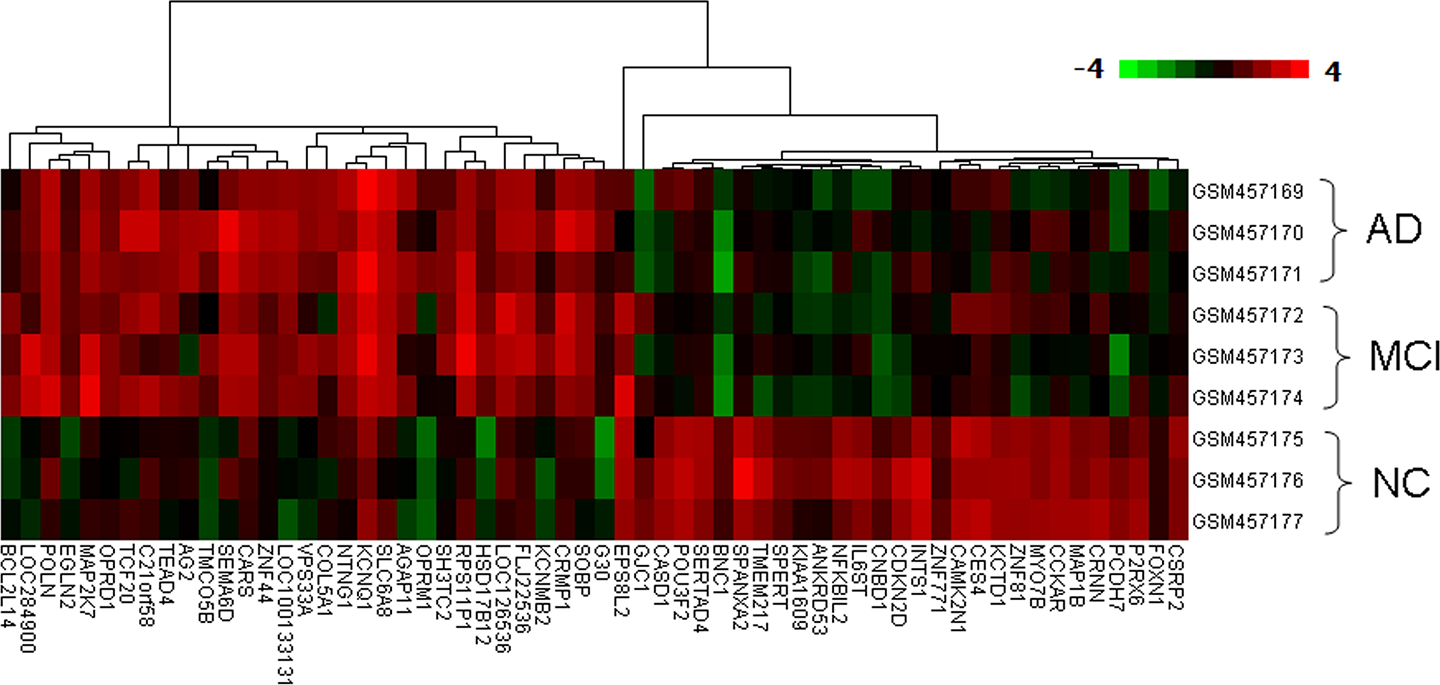
The hierarchical clustering heat map diagram of gene expression. Red color represents higher expression, and green color represents lower expression. The expression value from low to high is showed by gradient of green to red.
Functional Enrichment Analysis
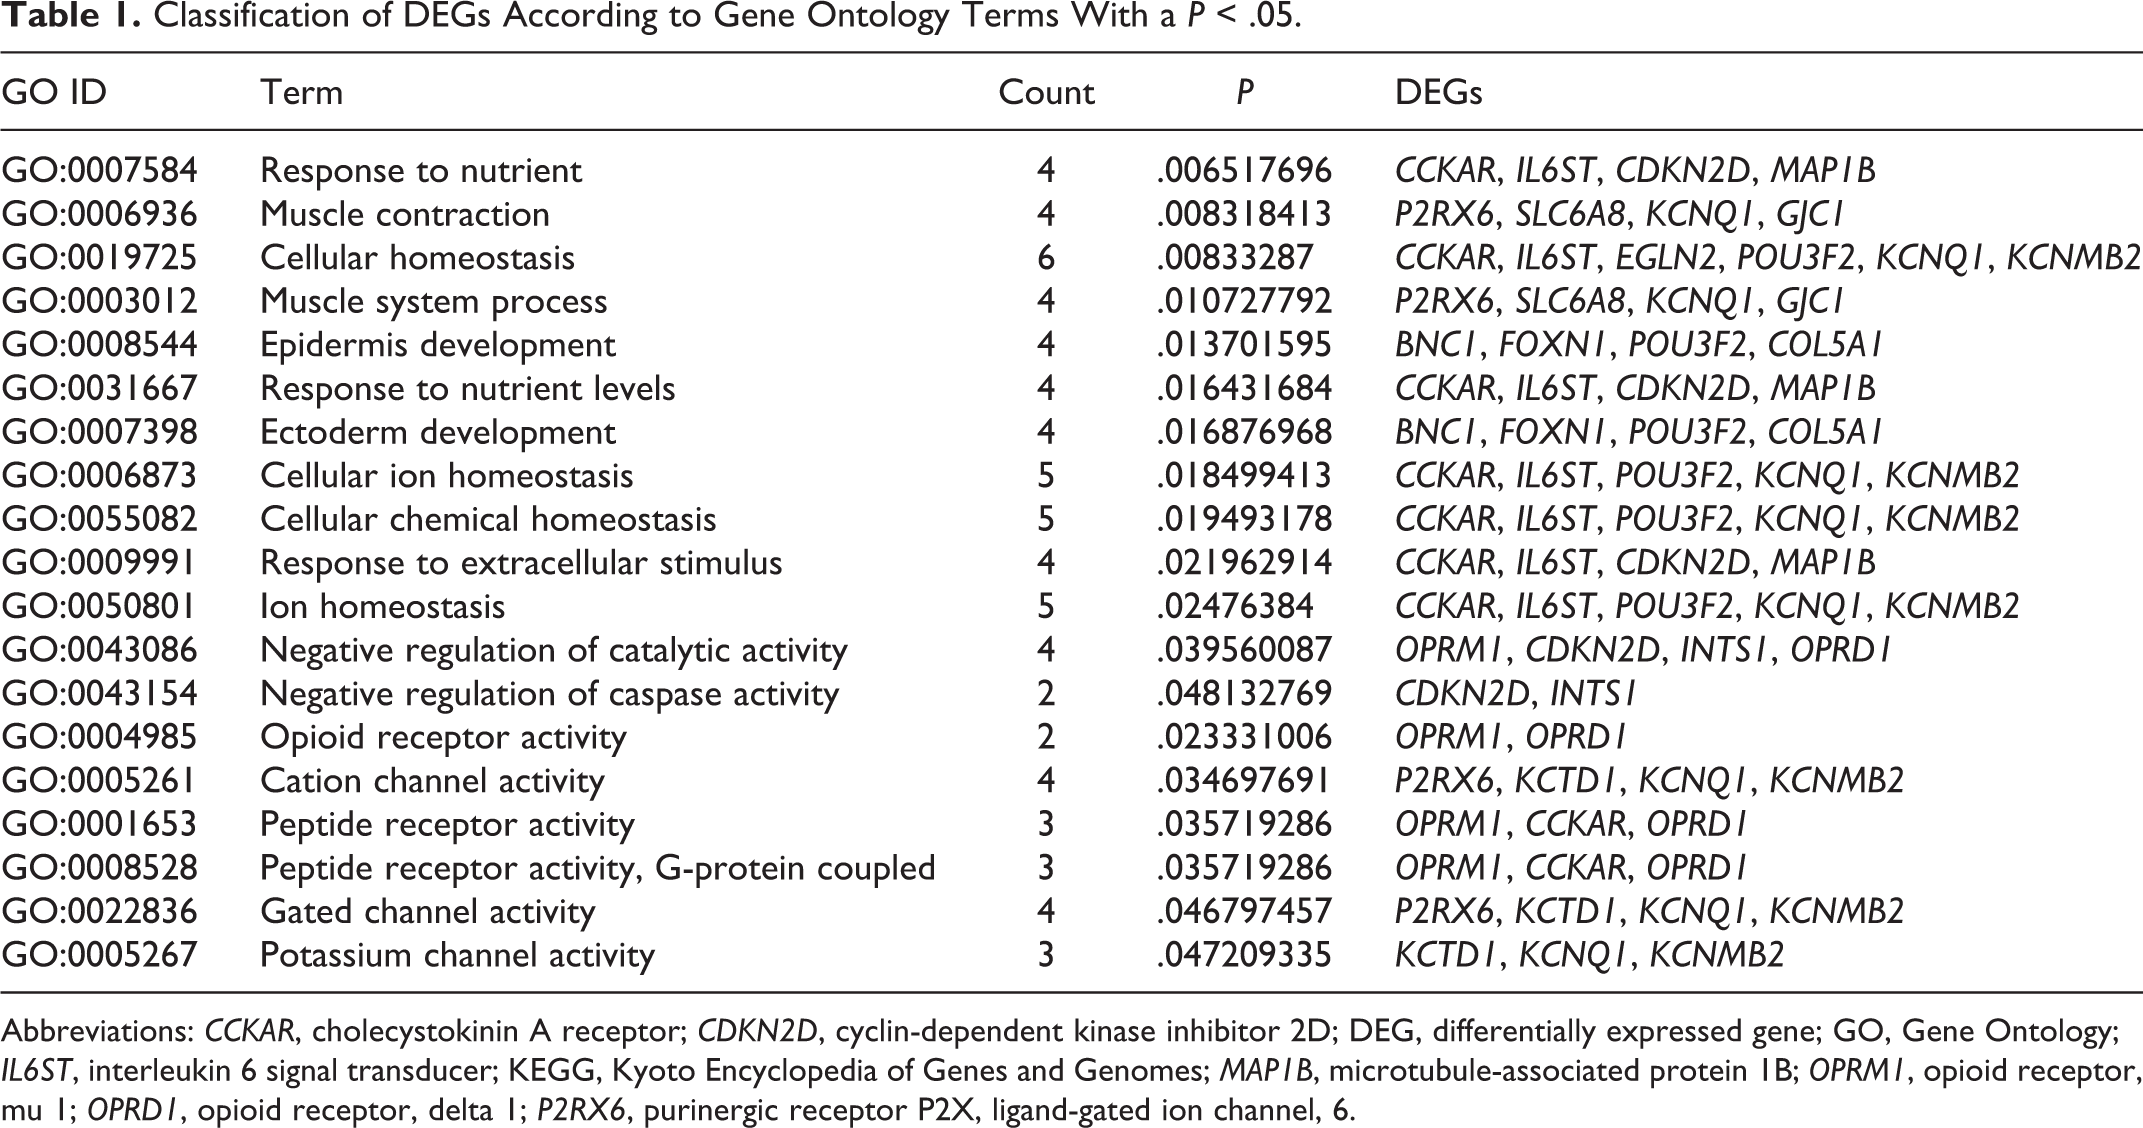
A total of 19 GO terms with P < .05 were enriched (Table 1). The most significant enrichment was the GO term of “response to nutrient” (P = .0065). The DEGs of cholecystokinin A receptor (CCKAR), IL6ST (interleukin 6 signal transducer), CDKN2D (cyclin-dependent kinase inhibitor 2D), and MAP1B (microtubule-associated protein 1B) were enriched in this GO term. The other significant GO categories included muscle contraction (P = .0083), cellular homeostasis (P = .0083), and muscle system process (P = .0107).
Classification of DEGs According to Gene Ontology Terms With a P < .05.
Abbreviations: CCKAR, cholecystokinin A receptor; CDKN2D, cyclin-dependent kinase inhibitor 2D; DEG, differentially expressed gene; GO, Gene Ontology; IL6ST, interleukin 6 signal transducer; KEGG, Kyoto Encyclopedia of Genes and Genomes; MAP1B, microtubule-associated protein 1B; OPRM1, opioid receptor, mu 1; OPRD1, opioid receptor, delta 1; P2RX6, purinergic receptor P2X, ligand-gated ion channel, 6.
Pathway Enrichment Analysis
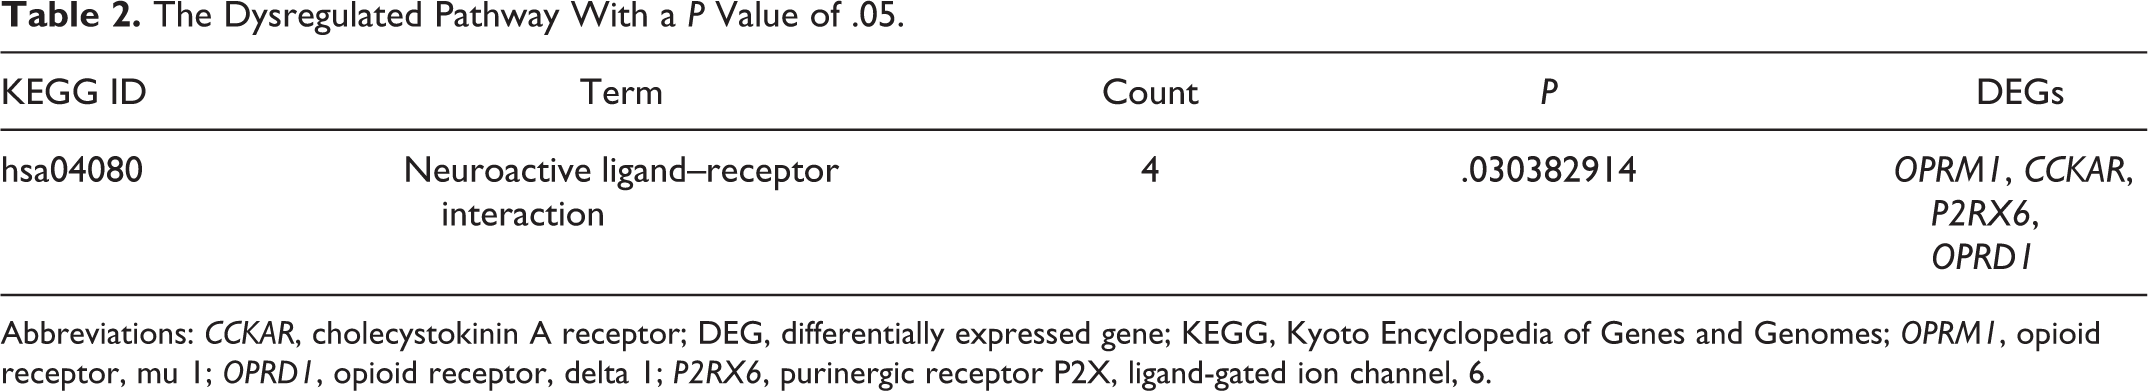
At P < .05, the overlapping DEGs were significantly enriched in one pathway, neuroactive ligand–receptor interaction (P = .0304; Table 2). The DEGs of OPRM1 (opioid receptor, mu 1), CCKAR, P2RX6 (purinergic receptor P2X, ligand-gated ion channel, 6), and OPRD1 (opioid receptor, delta 1) were enriched in this pathway.
The Dysregulated Pathway With a P Value of.05.
Abbreviations: CCKAR, cholecystokinin A receptor; DEG, differentially expressed gene; KEGG, Kyoto Encyclopedia of Genes and Genomes; OPRM1, opioid receptor, mu 1; OPRD1, opioid receptor, delta 1; P2RX6, purinergic receptor P2X, ligand-gated ion channel, 6.
Protein Molecular Binding Sites Analysis
From the results of functional enrichment analysis and pathway enrichment analysis, we found that CCKAR was enriched in both the most significant GO term of “response to nutrient” and the most significant pathway of “neuroactive ligand–receptor interaction”. Besides, this gene was significantly downregulated in AD (log[fold change] = −2.53, P = .006) and MCI (log[fold change] = −2.48, P = .001), compared with NC. We hypothesized that this gene might be used as a therapy target. Therefore, we identified the putative ligand binding sites on protein structure of CCKAR using AutoDock4 (http://autodock.scripps.edu/) (Figure 3). Adhesin of collagen from enterococci (ACE) and NH2- were the known ligands of CCKAR. 16,17 Based on these 2 binding sites, the amino acid residues (A5 and L30) of CCKAR protein chain are the active binding sites.
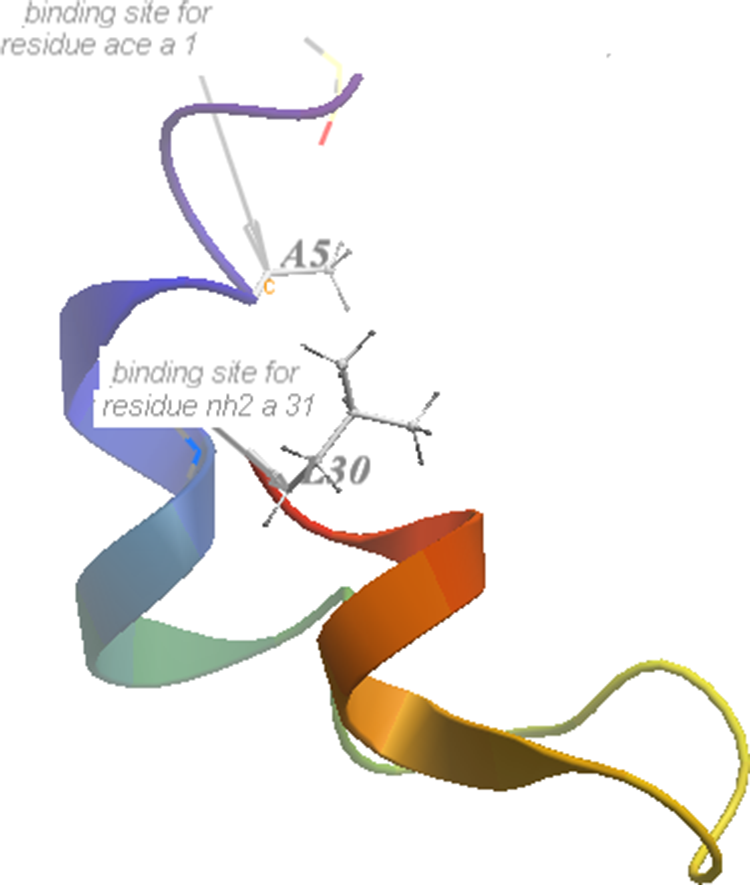
The 3-dimensional structure of CCKAR protein chain. The amino acid residues (A5 and L30) of cholecystokinin A receptor (CCKAR) protein chain are the active binding sites.
Discussion
In this study, we aimed to extend our understanding of AD. Results revealed that expression level of 60 genes was altered in both patients with MCI and patients with AD compared with NC. These genes might provide basis for biomarkers identification. Functional enrichment showed that response to nutrient and muscle system process was dysregulated in patients with AD. In addition, we identified 2 active binding sites on protein chain of CCKAR for drug design.
Response to nutrient (GO: 0007584) is the most significant dysregulated GO term in our study (P = .006). Our results suggest that nutrient supply might be related with AD and MCI. This result was in agreement with previous studies, which suggested that the damage of cognitive function was correlated with a variety of nutrients, for instance, cholesterol and fats. 18,19 The most well-known genetic variant leading to an increased risk of AD is apolipoprotein E (APOE) 4, 20,21 which play an essential role in the delivery of fat, cholesterol, and antioxidants from the liver to all the cells of the body. Seneff et al suggested that advanced glycation end products in crucial plasma proteins concerned with fat, cholesterol, and oxygen transport were damaged in AD, leading to cholesterol deficiency in neurons. Further, a cascade response leads to impaired glutamate signaling, increased oxidative damage, mitochondrial and lysosomal dysfunction, increased risk of microbial infection, and ultimately, apoptosis. 22 Therefore, we suggest that simple dietary modification is likely a protective measure against AD and MCI.
Neuroactive ligand–receptor interaction was the significantly enriched pathway in our study, suggesting this pathway was dysfunctional in AD and MCI. Our results were consistent with a previous study. 23 Two DEGs in opioid receptor family were enriched in this pathway (OPRM1 and OPRD1). Opioid receptors affect the regulation of neurotransmitters, which have been implicated in the pathogenesis of AD, including acetylcholine, gamma aminobtyric acid (GABA), glutamate, norepinephrine, and serotonin. 24,25 Opioid system was reported to be related to the pathogenesis of AD by previous studies, including hyperphosphorylated tau, Aβ production, cognitive impairment, and neuroinflammation. 25 –28 We suggest OPRM1 and OPRD1 might be attractive drug targets for novel pharmacotherapies of AD.
In our study, CCKAR was closely related with and the most significantly enriched GO term (response to nutrient) and pathway (neuroactive ligand–receptor interaction). It was significantly downregulated in patients with AD and MCI, compared with NC, suggesting this gene plays an important role in the development of AD. A recent study suggested that another type of cholecystokinin (CCK) receptor (CCKBR) was downregulated in AD hippocampus, compared with that in non-AD hippocampus 29 which was in line with our results to some extent. CCKAR encodes a G-protein-coupled receptor that binds nonsulfated members of the CCK family of peptide hormones. It is widely distributed in the central nervous system 30 and plays an important role in the function of the central nervous system by interacting with dopamine and other neurotransmitters. 31 The widespread distribution of CCK receptors in the central nervous system is consistent with the various proposed functions of neural CCK like a role in the regulation of satiety, in learning and memory, analgesia, and neuropsychiatric disorders (reviewed in 32 ). Additionally, data of CCK receptor knockout mice suggest a role for the receptor in the negative feedback control of the opioid system, as deletion of the receptor resulted in an activation of the endogenous opioid system. 33 A previous study suggested CCKAR mediates the release of dopamine in the nucleus accumbens. 34 Dopamine deregulation has been suggested to be involved in AD. 35 –37 Besides, a recent study demonstrated dysfunction of the dopaminergic system contributes to decline in cognitive functioning of animal models of AD. 38 Therefore, we suggest CCKAR might be involved in cognitive functioning in AD and MCI. So far, few studies have reported CCKAR expression in patients with AD; therefore, it remains to be investigated what its potential role could be in AD development process.
Docking is frequently used to predict the binding orientation of small molecule drug candidates to their protein targets in order to predict the affinity and activity of the small molecule in turn. Hence docking was largely used in the rational design of drugs. 39 Through 3-dimensional structure analysis of CCKAR protein chain, we found A5 and L30 were easily to be combined with ligand molecules. In the target-based design on monitoring expression of CCKAR, these active binding sites are meaningful to design drugs for novel pharmacotherapies of AD.
As we know, the best known genetic risk factor is the inheritance of the ε4 allele of the APOE. 21,40 Unfortunately, this gene does not appear in the DEGs in our study. We think there are 2 reasons to explain this. First, this “genetic” effect of APOE is not necessarily purely genetic. Although 40% to 65% of patients with AD have at least 1 copy of the 4 allele, APOEε4 is not a determinant of this disease—at least a third of patients with AD are APOEε4 negative and some APOEε4 homozygotes never develop this disease. For example, certain Nigerian populations have no relationship between presence or dose of APOEε4 and incidence or age-of-onset for AD. 41,42 Second, DNA microarray allows for the monitoring of messenger RNA expression levels of genes. This technology cannot monitor the changes in single nucleotide polymorphisms of APOE. Similarly, APOE was not appeared in the altered expression gene list of a recent study. 29
There are some limitations in our preliminary study. First, the microarray data are not generated by ourselves but from GEO database. Therefore, the diagnostic criteria of AD and MCI were not acquired as well as the selection criteria of NC. Besides, in this study, we used MCI gene expression profiles as if they were unequivocally an early stage of AD. Although some study suggested MCI generally represents early-stage AD, 43 this point is still controversial, because MCI not only develop to AD but also develop to frontotemporal dementia, Parkinson’s disease with dementia, or Lewy body dementia. Second, the sample size for microarray analysis is small and validation of the results in other data sets or samples is lack in this study. Therefore, further experimental studies based on a larger sample size are needed to confirm our results. Validation of results in other samples is a major limitation and might preclude conclusive suggestions.
In conclusion, we have identified a total of 60 DEGs in AD. This set of DEGs might be used as biomarkers for early diagnosis or therapy targets for AD treatment. Biological processes associated with nutrient response and muscle development were significantly dysregulated in patients with AD. In addition, we identified 2 active binding sites (A5 and L30) on CCKAR protein chain for drug design. However, further experimental validation is required since our results were based on microarray data derived from a small sample size.
Footnotes
Declaration of Conflicting Interests
The authors declared no potential conflicts of interest with respect to the research, authorship, and/or publication of this article.
Funding
The authors disclosed receipt of the following financial support for the research, authorship, and/or publication of this article: This study was supported by the National Natural Science Foundation of China (81071003).