
Abstract
Investigators report greater parietal tau deposition and alternate frontoparietal network involvement in early onset Alzheimer’s Disease (EOAD) with onset <65 years as compared with typical late onset AD (LOAD). To determine whether clinical brain MRI volumes reflect these differences in EOAD compared with LOAD. This study investigated the clinical MRI scans of 45 persons with Clinically Probable AD with onset <65 years, and compared them to 32 with Clinically Probable AD with onset ≥65 years. Brain volumes on their T1 MRI scans were quantified with a volumetric program. Receiver operating curve analyses were performed. Persons with EOAD had significantly smaller parietal lobes (volumetric percentiles) than LOAD. Late onset Alzheimer’s Disease had a smaller left putamen and hippocampus. Area Under the Curve was 96.5% with brain region delineation of EOAD compared to LOAD. This study indicates parietal atrophy less than 30% of normal on clinical MRI scans is suggestive of EOAD compared to LOAD.
Introduction
Alzheimer’s Disease (AD) affects nearly 6 million people 65 years of age or older in the United States, or nearly in out of every 10 older persons (Alzheimer Association). 1 Yet, arguably even more devastating is the development of early-onset AD (EOAD) before the age of 65. Understanding EOAD and how it differs from the vast majority of late-onset AD (LOAD) is an increasingly important goal of AD research. Early onset Alzheimer’s Disease is primarily sporadic and comprises 4–6% of those with AD.2,3 Between the ages of 45–64, incidence of EOAD is 6.3 per 100000 per year and prevalence is 24.2 per 100000 per year that translates to as many as 640000 persons with EOAD in the United States. 4 Early onset Alzheimer’s Disease is frequently misdiagnosed in part because in young individuals AD is not an expected etiology for memory loss in their age group. 5 It is critical to recognize EOAD, as these patients and their families need early intervention and support.
An increasing number of studies report differences between patients with EOAD and the large majority of patients with typical late onset AD (EOAD).6,7 Compared to LOAD, EOAD has more non-amnestic presentations, subpopulations varying in apolipoprotein E alleles, relative sparing of the temporolimbic system including hippocampus and default mode network, and greater neocortical pathology involving abnormal tau deposition.8,9 Compared to LOAD, EOAD may have greater involvement of frontoparietal neural networks and posterior cortical regions. 10
These differences are evident, not only on neuropathology but also on special neuroimaging techniques, such as florbetapir positron emission tomography. 11 A variety of research imaging options are available for AD under the amyloid, tau, neurodegeneration (ATN) construct, 12 and these indicate that EOAD is characterized by a loss of posterior cortical thickness. 13 These differences may also be evident on clinically available MRI imaging with clinical tools that allow for actual quantification of brain atrophy. There have been innovations in the past several years with the introduction of clinically available FDA cleared programs for quantitative analysis of MRI scans. 14 One such program, Neuroreader, has demonstrated utility in segmentation of multiple brain structures in AD, 15 as identification of brain atrophy in TBI. 16 The use of quantitative software could facilitate the detection of the differences between EOAD and LOAD, particularly through comparison with a database of normal volumes for different age groups.
The purpose of this work was to therefore evaluate atrophy patterns in EOAD compared to LOAD with a clinical volumetric MR imaging program. A secondary objective of this work was also to see if such volumetric differences could then be used to delineate these 2 groups. Additional goals of this work were to also determine the strength of relationship between brain structure and global cognition in EOAD compared to LOAD.
Methods
Participants
All participants in this study had EOAD and LOAD as determined by standard criteria. Specifically, EOAD is defined as persons diagnosed with AD prior to the age of 65 at time of presentation. Late onset Alzheimer’s Disease persons were identified as those with AD age 65 and older. All participants were recruited with IRB approval (IRB#16-000496, IRB#16-001491, and IRB#10-001097). They had an extensive clinical evaluation in specialty dementia programs, including one focused on early-onset dementias such as EOAD. After assessment, the participants enrolled in this study met Alzheimer’s Association-National Institute of Aging criteria for Clinically Probable AD with no complicating conditions or other disorders.
17
Thus, as part of this NIH funded study, the Inclusion and Exclusion Criteria for Patient Participants in this study applied NIA-AA criteria
17
including the following: I. Meets criteria for dementia and not MCI, that is, cognitive or behavioral symptoms that 1. Interfere with the ability to function at work or at usual activities; and 2. Represent a decline from previous levels of functioning and performing; and 3. Are not explained by delirium or major psychiatric disorder; 4. Cognitive impairment detected and diagnosed through a combination of (1) history-taking from the patient and a knowledgeable informant and (2) an objective cognitive mental status examination or neuropsychological testing. 5. The cognitive or behavioral impairment involves a minimum of two of the following domains: memory, reasoning, visuospatial abilities, language, and/or personality. II. In addition to these Dementia Criteria, inclusion criteria of Probable AD further include 1. Insidious onset over months to years; 2. Clear-cut history of worsening of cognition by report or observation; 3. The initial and most prominent (predominant) cognitive deficits are a. Amnestic presentation. b. Non-amnestic presentations: Language, visuospatial, or executive dysfunction. 4. Exclusion if there is evidence of substantial concomitant cerebrovascular disease, core features of Dementia with Lewy bodies, or prominent features of the frontotemporal lobar degenerations, or evidence for another concurrent, active neurological disease, or a non-neurological medical comorbidity or use of medication that could have a substantial effect on cognition.
Subject Demographics in EOAD and LOAD.

Abbreviations: EOAD, Early Onset Alzheimer’s Disease; LOAD, Late Onset Alzheimer’s Disease; MMSE, Mini-Mental State Exam.
MRI Methods
Brain MRI scan data were analyzed as part of an IRB approved protocol (IRB#16-000496, IRB#16-001491, and IRB#10-001097). 18 Early onset Alzheimer’s Disease research participants underwent brain MRI including a 3D volumetric MPRAGE sequence on a Siemens Scanner with 3T and 1.5T protocols. The 3T protocol was on a Siemens MAGNETOM Trio MRI scanner with acquisition of high-resolution T1-weighted 3D MPRAGE sequences with the following parameters: 192 × 256 matrix and TR = 1900 ms, TE = 4.38 ms, TI = 1100 ms, flip angle 15°, voxel size of 1×1×1 mm3. The 1.5 T protocol was done on a Siemens Avanto scanner on which an MPRAGE was also obtained with the following parameters: T1-weighted sequences (256×256 matrix; TR = 2000 ms; TE = 2.89 ms; TI = 900 ms; flip angle = 40°; voxel size = 1×1×1 mm3). A portion of the LOAD scans were recruited for analysis from Siemens 3T clinical 3D T1 volumetric imaging done at University of California, Los Angeles (IRB#16-001491). MRI field strength of whether a scan was done at 1.5T versus 3T was separately coded for use in analyses. Scans were then analyzed with an FDA cleared volumetric program (Neuroreader) as described in previous work.15,16 With each scan, 45 brain structures were quantified including the hippocampus, lobar structures, subcortical regions (thalamus, caudate, putamen, etc.), ventral diencephalon, midbrain, ventricular, and white matter (WM) volumes with an atlas-based segmentation, also detailed previously. Total gray matter (GM), white matter (WM), and cerebrospinal fluid (CSF) volumes were also calculated. Total intracranial volume (TIV) was calculated from the sum of these 3 volume and regional brain volumes are also generated as a fraction of TIV. The following metrics were consequently derived for each segmented brain structure: (1) Regional brain volume in ml; (2) The ratio of a region of interest volume to TIV; (3) the number of standard deviations from the normative database (NR index); (4) the number for standard deviations from the mean scaled between −2 and +2 (Z-score); and (5) Percentile of comparison to the normative database. All comparisons adjusted for age, gender, and TIV. As Neuroreader has been previously shown to have equivalent accuracy of segmentation on 1.5 versus 3 Tesla 3D T1 scans, 15 harmonization of the MRI scans was not performed.
Statistical Analysis
The statistical analysis of brain structure in EOAD versus LOAD was performed in 2 ways in SPSS Version 26 (IBM, Armonk, New York). First, an independent samples t-test was done to evaluate for statistically significant mean differences in percentiles compared to the normal database and then brain volumes between the 2 groups. Each brain volume compared between EOAD and LOAD was a fraction of TIV so that the comparison of mean differences of brain volumes was adjusted for head size. For statistically significant results, a Cohen’s D statistic was calculated to determine effect size. The interpretation of Cohen’s D statistic was as follows: <.5 is a small effect size, .5 ≤ .8 is a medium effect size and ≥ .8 is a large effect size. 19 Multiple comparisons were accounted for using False Discovery Rate (FDR) of 5%. 20 Second, interaction effects between EOAD versus LOAD status, age, sex, MRI field strength and brain volumes were separately done. A receiver operating curve (ROC) analysis was done in which the segmented brain structure percentiles and volumes were used to determine the accuracy of volumetric quantification alone in distinguishing EOAD from LOAD. This was done from probabilities extracted from a discriminant analysis with leave one out cross validation. An automated linear regression analysis was then performed for feature selection to determine which volumetric structures contributed most to the distinction between EOAD and LOAD. Finally, as an exploratory analysis, the relationship between Mini-mental state exam (MMSE) and brain structure was separately studied in the LOAD and EOAD groups.
Results
Other than age differences and percentage scanned with 3T, (Table 1), both groups were statistically equivalent in terms of gender distribution, handedness, as well as a global level of cognitive impairment as measured by MMSE.
Figure 1 shows bilateral statistically significant areas between LOAD and EOAD that survive multiple comparisons. These include higher lateral ventricle percentiles in LOAD, lower parietal lobe percentiles in EOAD, and lower WM volume percentiles in EOAD. Bilateral statistically significant regional percentile differences between LOAD and EOAD.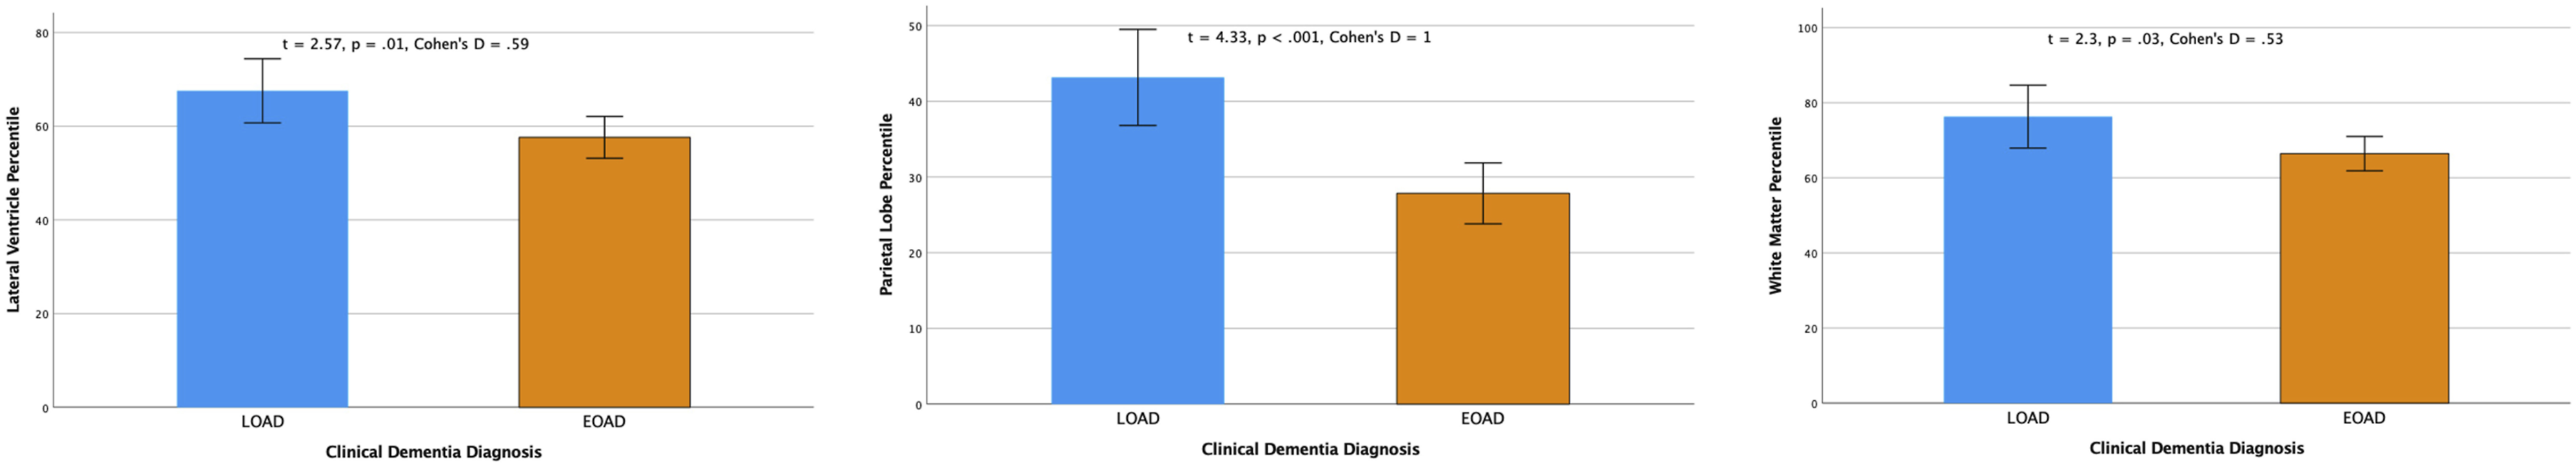
Supplemental Table 1 demonstrates comparisons between Neuroreader percentiles compared to the normal database across EOAD and LOAD groups. Bold areas denote percentiles that survive FDR correction for multiple comparisons.
Overall, we found lower parietal lobe volume percentile comparisons (t = 3.95 for left, 4.16 for right; P < .001, Cohen’s D = .91 for left and .96 for right) in EOAD compared to LOAD. The EOAD group also demonstrated lower total WM volume percentile comparisons (t = 2.3, P = .03, Cohen’s D = .53). The LOAD group, though, had larger total ventricular volume percentiles compared to LOAD (t = 2.54 for left, 2.32 for right; P = .01, Cohen’s D = .59 for left and .54 for right). These results were also replicated when examining the results as volumes as a proportion of TIV. There were no statistically significant differences in hippocampal volumes between the LOAD and EOAD groups.
Figure 2 shows bar charts detailing statistically significant bilateral brain regions that differ between LOAD and EOAD, corrected for TIV. Bilateral statistically significant volumetric difference between LOAD and EOAD.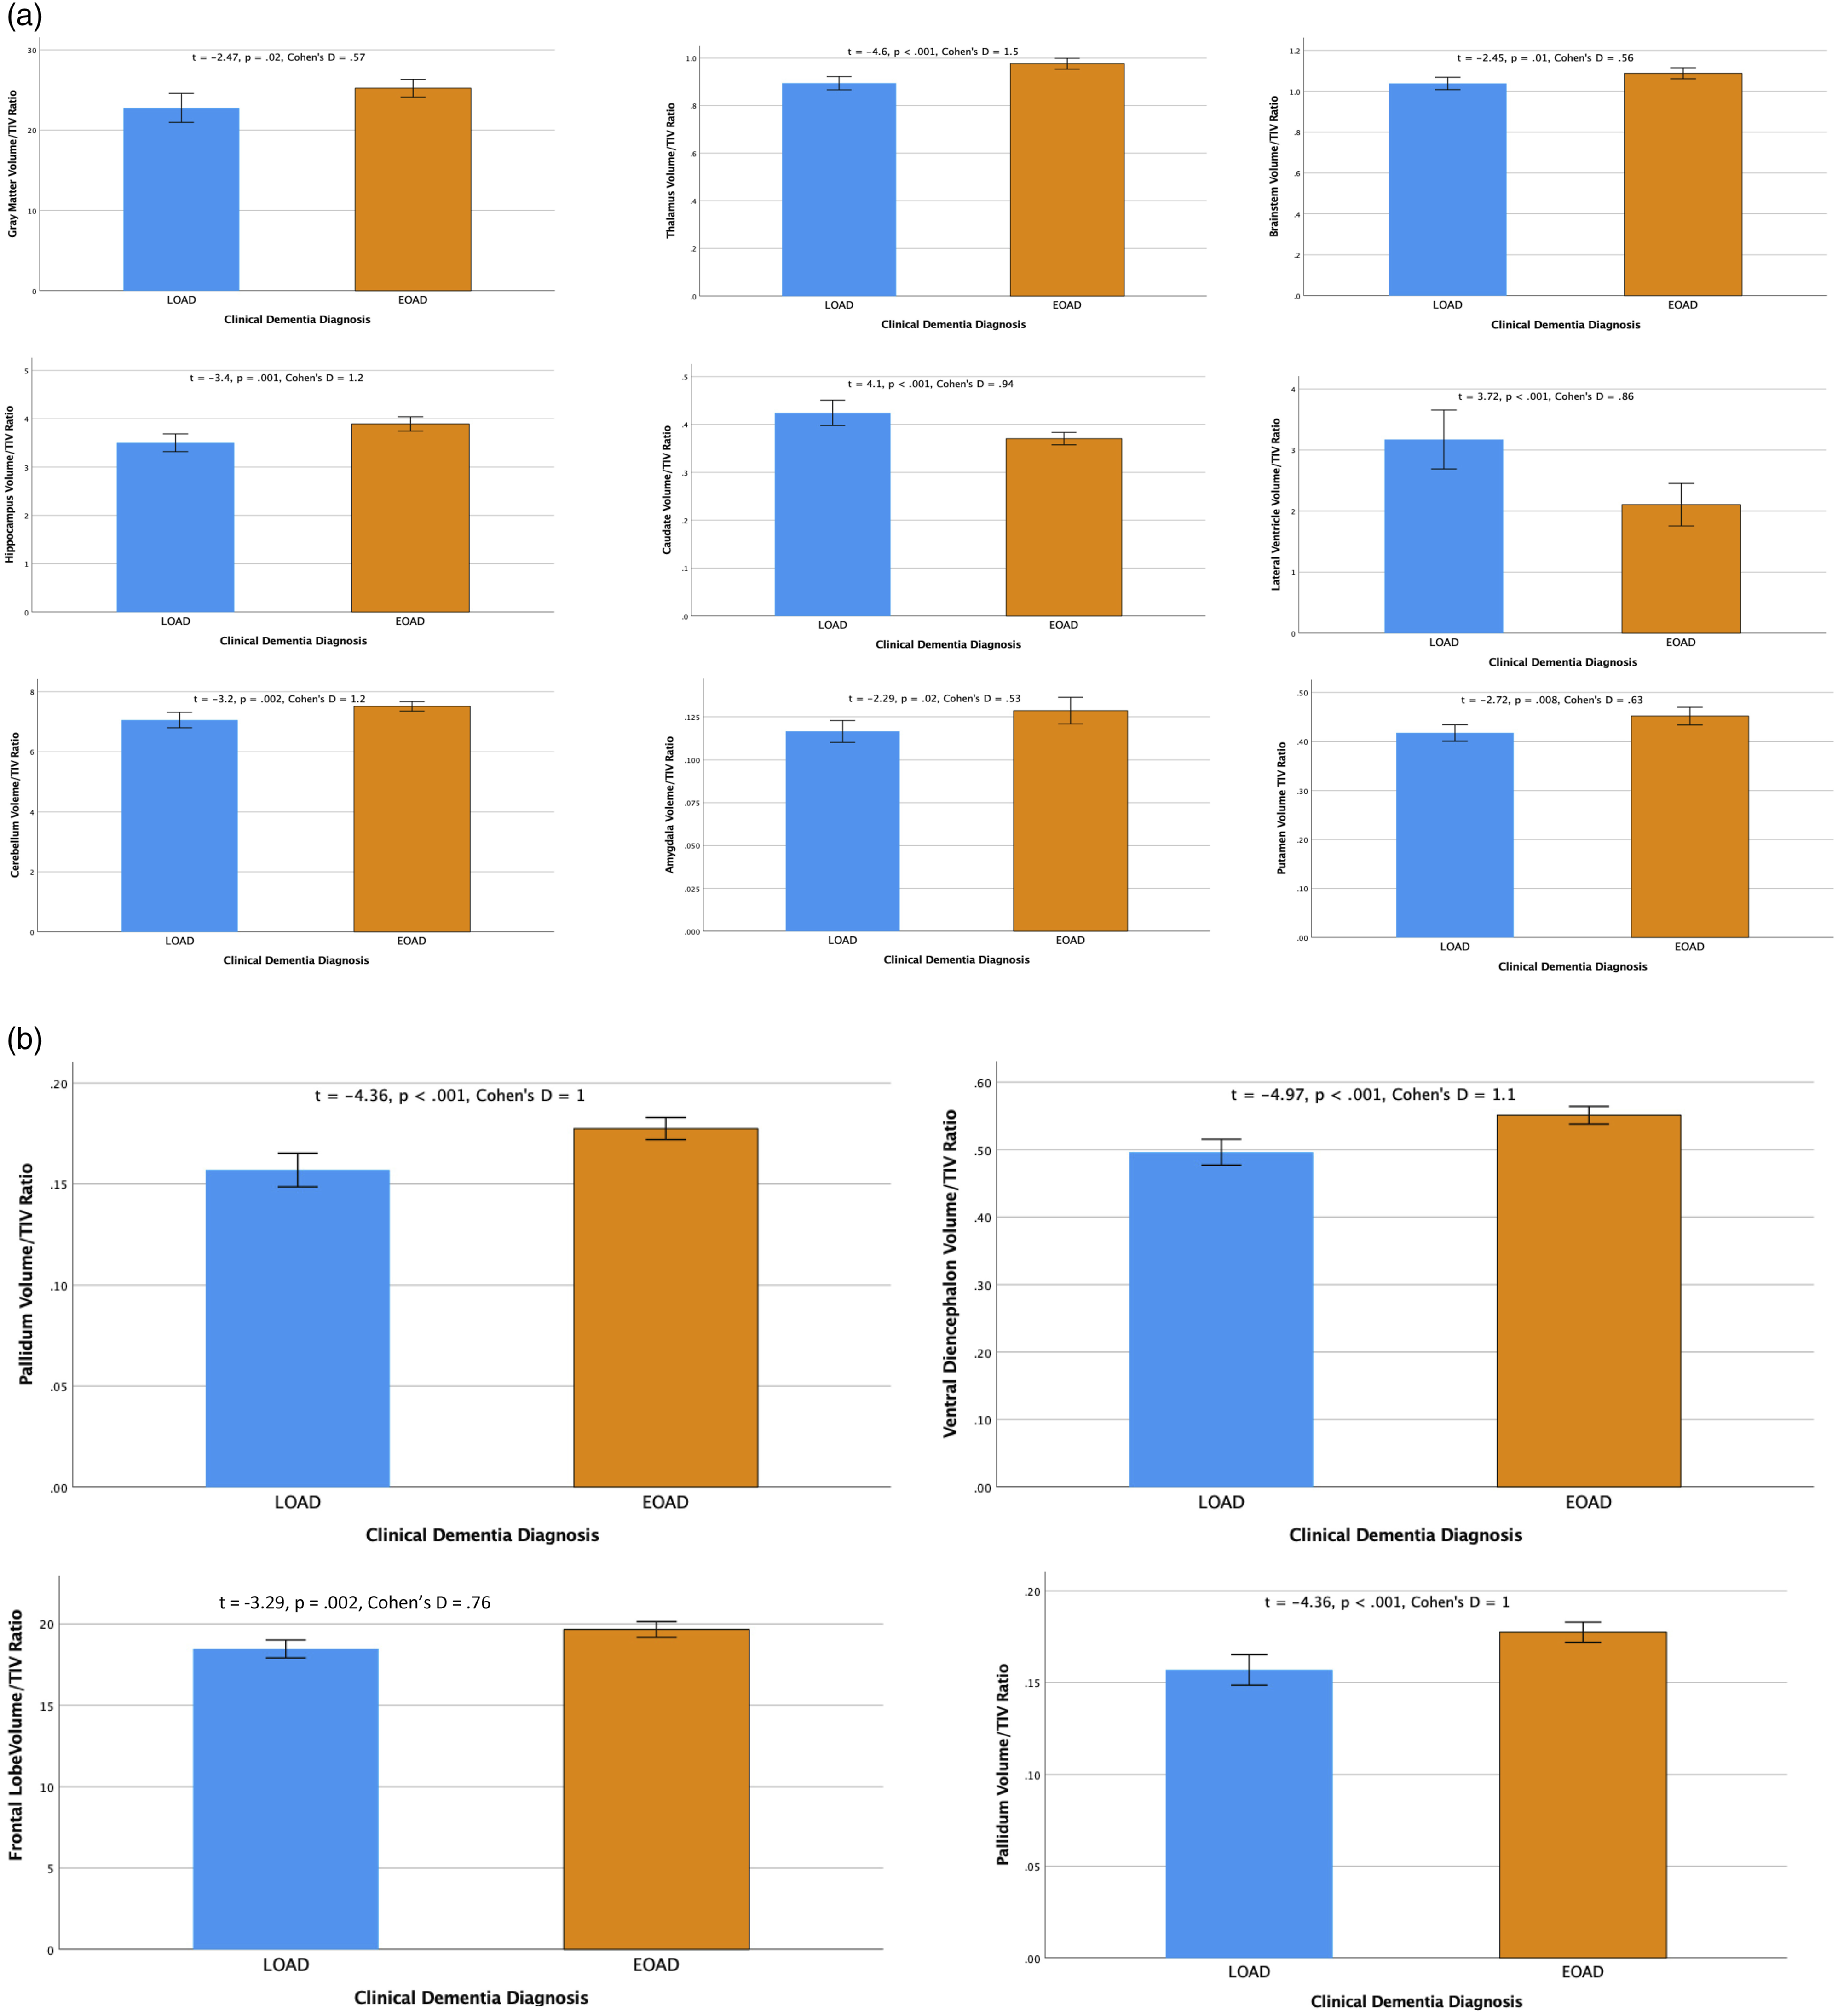
Supplemental Table 2 demonstrates the volumetric differences between EOAD and LOAD. Notably, even given the similar group level of cognitive impairment, LOAD shows the majority of regions being lower in volume compared to EOAD. The parietal lobes are lower in EOAD compared to LOAD and the right parietal lobe trends in statistical significance (P = .06). Areas of different with the largest effect sized include the caudate nucleus, pallidum, and right lateral ventricle. Statistically significant areas remained so after FDR correction for multiple comparisons.
Figure 3A shows the ROC for using Neuroreader derived percentiles to delineate EOAD from LOAD. Area Under the Curve was 96.5%, sensitivity was 95.6% and specificity was 84.4%. The automated linear regression analysis showed that the most predictive percentiles in distinguishing EOAD from LOAD were (i) Left putamen, (ii) Right parietal lobe, (iii) left caudate, (iv) right thalamus, and (v) left parietal lobe. (A) ROC showing use of neuroreader percentiles to distinguish EOAD from LOAD. (B) Area under curve for parietal lobe volumes and percentiles alone to distinguish EOAD from LOAD. (C) ROC curve for MR volumetric quantification (ml/TIV) in distinguishing EOAD from LOAD.
When utilizing parietal lobe volumes and percentiles alone in the discriminative analysis, the area under the curve was reduced yet still high at 86% (Figure 3B) with 81% sensitivity and 67% specificity.
Figure 3C shows results of the ROC analysis in which all Neuroreader segmented brain volumes alone delineated EOAD from LOAD with 98.1% accuracy and 96% sensitivity and 94% specificity. Results of the automated linear regression analysis demonstrated that the volumetric features accounting for the delineation between EOAD and LOAD were (i) right parietal lobe, (ii) right putamen, and (iii) left frontal lobe.
Supplemental Table 3 shows statistically significant or trending correlations between MMSE and Brain Volumes in EOAD and LOAD Adjusting for Age, Gender, TIV, and Handedness. No statistically significant correlation was detected between MRI field strength and MMSE so these variables were not included as co-variates in this model.
There were no statistically significant interactions effects, including for age, sex, symptom duration, or MRI field strength.
Discussion
This study demonstrates greater parietal lobe atrophy and other volumetric differences among EOAD patients compared to those with LOAD using a clinically available volumetric MRI software program. The findings indicate a high degree of accuracy with MRI quantified percentiles and volumetrics alone in delineating EOAD from LOAD. This accuracy persists when using the parietal lobes alone. In addition, the analysis illustrates the relative relationships between brain structure and MMSE in EOAD and LOAD.
The increased parietal lobe atrophy among patients with EOAD was a prominent difference from those with LOAD. This finding is supported by prior literature. For example, one study of 15 EOAD and 10 LOAD showed a greater magnitude of atrophy progression in the parietal lobes with EOAD. 21 Another study found increased FDG-PET hypometabolism in the left parietal lobe with EOAD compared to LOAD. 22 This result, while with a different modality, correlates with our left parietal lobe percentile as one of the top 5 predictive regions in delineating EOAD from LOAD. Other neuroimaging studies using voxel based morphometry or GM measures have also identified parietal lobe atrophy in EOAD particularly in the posterior parietal lobes.23‐25 Our findings thus reflect the ability of parietal lobe volume to delineate EOAD given the posterior pre-dominance of atrophy.26‐28 That this can be done with a clinical volumetric software program highlights a potential application of this approach to the diagnosis of EOAD.
Brain Positron Emission Tomography (PET) scans suggest a higher burden of cortical amyloid and tau deposition, the hallmarks of AD pathology, in EOAD compared to LOAD. 29 Positive amyloid imaging PET is a key feature of AD and predicts progression of the disorder, 30 and in early clinical stages of AD there is a tight link between tau deposition on PET scans and the magnitude of brain atrophy. 31 Our finding of more widespread atrophy in LOAD compared to EOAD may in part be reflected of the older age of this cohort. Conversely, EOAD, compared to LOAD, was related to grater parietal atrophy and, presumably, increased cortical tau deposition in parietal and posterior cortical regions. 32
The volumetric differences between EOAD and LOAD also permitted a high degree of delineation between these 2 groups with ROC analysis. The ability of MRI to be abnormal on a clinical grade volumetric program suggests that utility exists for applying this approach to the EOAD as well as the LOAD population. Brain MRI has the highest magnitude of patient access compared to PET. 33 Additionally, abnormal brain MRI volume loss can be noted 3–5 years prior to onset of memory loss symptoms. 34 Thus, with quantification as demonstrated in this work, there remains potential to extract additional sensitivity from brain MRI in patients with EOAD.
Percentile comparisons to a normal database are a clinically intuitive and usual way of evaluating atrophy by quantitative analysis of clinical MRI scans. For this reason, we focused our analysis on percentiles across EOAD and LOAD. The use of percentiles made the parietal lobe differences statistically significant compared to using normalized volumes while still maintaining high accuracy in the ROC analysis. These findings have implications for defining cut points for volume loss with percentiles in clinical volumetric software programs. The results of this study suggest data driven results that could potentially change and improve the sensitivity of what percentiles could potentially be considered “abnormal” in both EOAD and LOAD.
Another notable finding from this study are the differences in WM percentiles in EOAD versus LOAD. Compared to the patients with LOAD, those with EOAD had lower WM percentiles by approximately 10% with moderate effect size. Several papers have reported distinct patterns of WM abnormalities in EOAD with reduced fractional anisotropy involving the body of the corpus callosum, fornix, and main anterior-posterior pathways. 35 Another WM microstructural study comparing EOAD and LOAD groups found a greater degree of damage in the EOAD group that experienced greater severity and distributed pattern of WM microstructural damage, in particular in the posterior fibers of cingulum and corpus callosum. 36 While preliminary, our results suggest that the lower WM percentile in the EOAD group could be a volumetric correlate of previously reported work.
There are a few other findings from this study that deserve further research. A preliminary finding is the tighter link between MMSE and brain structure in the EOAD group compared to LOAD. The EOAD group had double the number of brain structures with statistically significant correlations between brain structure and MMSE particularly in the lateral ventricles. Overall, these findings suggest that brain structural changes in EOAD are more indicative of decreased MMSE compared to LOAD. Also, the relatively larger ventricles may be a more sensitive indicator of potential cognitive impairment in EOAD compared to LOAD. Longitudinal evaluations will be required to further determine if such relationships are also present in EOAD. 37
This investigation has several advantages and limitations. An advantage is its utilization of an FDA cleared program in EOAD and LOAD populations. This allows for the potential for greater clinical translation and application to these populations. A caveat with the interpretation of our results is the potential under-estimation of the magnitude of volume loss in EOAD with the percentiles due to the younger age on average of EOAD compared to the lower bound age of the normal database. Also, we did not characterize our cohort with CSF or PET biomarkers however we did utilize clinical criteria to determine EOAD and LOAD and this has been done in other studies3,5 and clinical practice. Another limitation of this work is in its cross sectional design that precludes the strength of causality in the interpretation of results. Future studies can not only incorporate longitudinal designs but also more sophisticated volumetric analysis techniques such as hippocampal subfields. 38 However, hippocampal subfield analyses are not currently part of FDA cleared software available for routine clinical use.
In conclusion, quantitative analysis of clinical MRI scans with readily available programs such as Neuroreader can disclose pathognomonic differences in AD subgroups. Specifically, these scans can show the greater parietal lobe atrophy that has been described with research imaging and neuropathology, both in comparison with LOAD and a normative comparison group. Clinicians can use volumetric MR imaging analyses even in AD subtypes such as EOAD with good accuracy; these analyses are sufficiently sensitive to link brain structure with global cognitive function. Given the clinical reality of encountering the “N” or neurodegenerative portion of the ATN system of AD diagnosis,39,40 the use of volumetrics may be valuable for clinically recognizing regional atrophy in EOAD as well as LOAD. Additional work will further refine the abilities and limits of these tools.
Supplemental Material
sj-pdf-1-aja-10.1177_15333175211055325 – Supplemental Material for Quantitative MRI Differences Between Early versus Late Onset Alzheimer’s Disease
Supplemental Material, sj-pdf-1-aja-10.1177_15333175211055325 for Quantitative MRI Differences Between Early versus Late Onset Alzheimer’s Disease by Somayeh Meysami, Cyrus A. Raji, David A. Merrill, Verna R. Porter and Mario F. Mendez in American Journal of Alzheimer's Disease & Other Dementias
Footnotes
Declaration of Conflicting Interests
The author(s) declared the following potential conflicts of interest with respect to the research, authorship, and/or publication of this article: Dr. Raji consults for Brainreader ApS, Apollo Health, and Neurevolution LLC. There are otherwise no potential conflicts of interests related to this work.
Funding
The author(s) disclosed receipt of the following financial support for the research, authorship, and/or publication of this article: This work was Supported by McLoughlin Cognitive Health Gift Fund and the Pituitary Injury Foundation. Dr Raji is supported in his research by grants from the WUSTL NIH KL2 Grant (KL2 TR000450 – ICTS Multidisciplinary Clinical Research Career Development Program), the Radiological Society of North America Research Scholar Grant and the Foundation of the American Society of Neuroradiology Boerger Research Fund for Alzheimer’s Disease and Neurocognitive Disorders. Dr Mendez is PI on US National Institute on Aging Grant 1RF1AG050967.
Supplemental Material
Supplemental material for this article is available online.
References
Supplementary Material
Please find the following supplemental material available below.
For Open Access articles published under a Creative Commons License, all supplemental material carries the same license as the article it is associated with.
For non-Open Access articles published, all supplemental material carries a non-exclusive license, and permission requests for re-use of supplemental material or any part of supplemental material shall be sent directly to the copyright owner as specified in the copyright notice associated with the article.