
Abstract
Objectives:
Micronutrients, especially calcium (Ca) and magnesium (Mg) are reported to reduce preeclampsia events via several factors such as endothelial cell control, optimal oxidative stress and a balanced angiogenic growth mediator. We evaluated the association of micronutrients with oxidative stress biomarkers, and angiogenic growth mediators in early-onset preeclampsia and late-onset preeclampsia.
Methods:
This case-control study recruited 197 preeclampsia (early-onset preeclampsia = 70 and late-onset preeclampsia = 127) as cases and 301 normotensive pregnant women as controls from the Komfo Anokye Teaching Hospital, Ghana. Samples were collected after 20 weeks of gestation for both cases and controls and estimated for Ca, Mg, soluble fms-like tyrosine kinase-1, placental growth factor, vascular endothelial growth factor-A, soluble endoglin, 8-hydroxydeoxyguanosine, 8-epiprostaglandinF2-alpha and total antioxidant capacity.
Results:
Early-onset preeclampsia women had significantly lower levels of Ca, Mg, placental growth factor, vascular endothelial growth factor-A and total antioxidant capacity but higher levels of soluble fms-like tyrosine kinase-1, soluble endoglin, 8-epiprostaglandinF2-alpha, 8-hydroxydeoxyguanosine, soluble fms-like tyrosine kinase-1/placental growth factor ratio, 8-epiprostaglandinF2-alpha /placental growth factor ratio, 8-hydroxydeoxyguanosine/placental growth factor ratio and soluble endoglin/placental growth factor ratio than late-onset preeclampsia and normotensive pregnant women (p < 0.0001). Among the early-onset preeclampsia women, the first and second quartile for serum placental growth factor, first quartile for vascular endothelial growth factor-A and total antioxidant capacity and the fourth quartiles for serum sEng, serum sFlt-1, 8-epiPGF2α and 8-OHdG were independently associated with low Ca and Mg (p < 0.05). Among late-onset preeclampsia women, the fourth quartile for soluble fms-like tyrosine kinase-1 was independently associated with low Ca and Mg (p < 0.05).
Conclusion:
Magnesium and calcium are associated with an imbalance in angiogenic growth mediators and oxidative stress biomarkers among preeclampsia women, particularly early-onset preeclampsia. Serial and routine measurement of these micronutrients would allow the monitoring of poor placental angiogenesis while enabling an understanding of the triggers of increased oxidative stress and reduced antioxidant in preeclampsia.
Keywords
Introduction
Preeclampsia (PE) is a pregnancy-related complication present in approximately 5% of all pregnancies and among the leading causes of maternal-perinatal morbidity and mortality in the world. 1 PE is usually characterised by the inception of hypertension with proteinuria or multiorgan impairment after week 20 of pregnancy. 2 While maternal mortality due to PE is uncommon in the developed world, PE-related mortality remains high in developing countries, including those in Sub-Saharan Africa. The prevalence of PE in Africa ranges from 1.8% to 16.7%, 3 with Ghana documenting a prevalence rate of 7% from 2006 to 2009.4,5
PE has been grouped into two types by the gestational timing of the disease onset: Early-onset preeclampsia (EO-PE) which occurs before the 34th week of gestation and late-onset preeclampsia (LO-PE) which occurs on or after the 34th week of gestation. Although the presenting features of these two diseases overlaps, EO-PE is usually associated with intrauterine growth restriction (IUGR), clear placental pathology with lesions of uteroplacental malperfusion. This is in contrast to LO-PE where the clinical and pathological examinations of the placenta are usually normal. 6
The exact cause of PE remains unclear. Its pathophysiology is believed to occur in two stages. The first stage is presented by syncytiotrophoblast damage and local placental hypoxia, which leads to increased oxidative stress (OS).7,8 This stage is characterised by changes in circulating soluble fms-like tyrosine kinase-1 (sFlt-1) and placental growth factor (PlGF) levels. 6 The second stage involves the synthesis and release of vasoactive factors into maternal circulation, the unusual expression of pro-inflammatory cytokines, dysregulation in angiogenic growth mediators (AGMs) and endothelial cell dysfunction.9,10 Maternal endothelial dysfunction is associated with increased serum levels of soluble endoglin (sEng) and decreased vascular endothelia growth factor (VEGF). 11
AGMs regulate placental angiogenesis and therefore an increase in OS is likely to dysregulate these mediators. 12 Detrimental pregnancy outcomes such as stillbirth, IUGR and post-partum haemorrhage occur in women with PE, and are associated with increased serum levels of sFlt-1, 8-epiprostaglandinF2-alpha (8-epi-PGF2α) and decreased levels of PlGF and total antioxidant capacity (TAC). 10 In a recent repeated measures study, elevated levels of 8-hydroxydeoxyguanosine (8-OHdG) in preeclamptic women were recognised as a marker of OS and DNA damage. 13 To prevent complications of the disease, the World Health Organization recommends that women receive micronutrient supplement during pregnancy. 14 Micronutrients such as calcium, have been hypothesised to reduce the risk and complications of PE due to the role it plays in placental endothelial function, OS and expression of AGMs. 15 In addition, a recent study used serum magnesium and calcium levels to predict and identify normotensive pregnant women who later developed PE in gestation. 16
Unfortunately, micronutrient (calcium and magnesium), OS biomarkers and AGMs are not routinely estimated in the Ghanaian clinical setting, and the potential link between OS biomarkers, AGMs and micronutrients has not been established. For the first time, the present study has evaluated the interplay between OS biomarkers, AGMs and micronutrients in EO-PE and LO-PE in a Ghanaian population.
Materials and methods
Study design and settings
This case-control study was conducted at the Obstetrics and Gynaecology (O&G) Department of the Komfo Anokye Teaching Hospital (KATH), Kumasi, Ghana from May 2015 to February 2016. KATH is the second largest teaching hospital that offers health services to upper and middle regions of Ghana as well as receives referrals from the southern parts of Ghana. The hospital is in the Ashanti region which has a population of 5,432,485 (Ghana Statistical Service, 2021). The O&G unit receives more than 200 pregnant women a day on routine antenatal visits.
Selection of study participants
In this study, 197 nulliparous and multiparous pregnant women of 18–45 years of age with a singleton pregnancy, who were clinically diagnosed with PE (EO-PE = 70 and LO-PE = 127) gave written consent and were recruited as cases. The control group consisted of 301 normotensive pregnant women attending routine antenatal care in the O&G Department of KATH who also consented to participate in the study. Both cases and controls were recruited after 20 weeks of gestation using purposive sampling technique. At the time of recruitment, demographic, obstetric data and blood samplings were collected simultaneously at an average gestational age of 38.7 weeks for controls and 34.2 weeks for cases (32.5 weeks for EO-PE and 36.01 for LO-PE). The clinical diagnosis of participants was further confirmed by an Obstetrician or Gynaecologist before they were included in the study. PE was diagnosed with the presence of proteinuria (⩾1+/0.3 g/l) and hypertension (blood pressure (BP) ⩾ 140/90 mmHg) on two occasions at least 4 h apart, detected after the 20th week of gestation (National High Blood Pressure Education Program, 2000). In the absence of proteinuria, high blood pressure along with multiorgan dysfunction or manifestations such as renal insufficiency, HELLP (haemolysis, elevated liver enzymes and low platelet count) syndrome, pulmonary oedema, oligohydramnios, oliguria and visual or cerebral disturbances supported the diagnosis of PE. EO-PE was defined as PE occurring before 34 weeks of gestation while LO-PE was defined as PE occurring on or after week 34 of gestation. 6 A normotensive pregnancy was defined as a pregnant woman without proteinuria and hypertension (BP ⩽ 140/90 mmHg). Self-structured questionnaire was used to obtain information on sociodemographic characteristics as well as dietary intake supplement usage of participants (Supplemental Material 1). A Cronbach’s alpha coefficient value of 0.85 was found after pre-testing the reliability of the questionnaire among 30 pregnant women in a pilot study at the KATH. Relevant clinical and obstetric data was extracted from the antenatal folder of each participant and the hospital’s archives. Women with twin pregnancies, below 18 years of age, advanced maternal age (>45 years), gestational diabetes, gestational hypertension, obesity, smoking, alcoholism, receiving calcium supplement, receiving magnesium sulphate (MgSO4) treatment, sexually transmitted infections and sickle cell anaemia were excluded from the study.
Sample size justification
The estimated sample size for a case-control study was calculated with a formula as described by Charan and Biswas (2013). 17 Using a 95% confidence level (CI), 80% power chance of detection, unmatched case-control with a 1:3 ratio of case:control, 65% hypothetical proportion of controls with exposure, 80% hypothetical proportion of cases with exposure and a 2.15 least extreme odds ratio for detection, a total of 380 subjects (95 cases and 285 controls) were expected. However, sample size was increase to 498 comprising 197 cases and 301 controls to strengthen the statistical power of the study.
BP measurements
Trained personnel and midwives used mercury sphygmomanometers (Accoson, Irvine, UK) and a stethoscope to measure the BP of participants in accordance with the recommendations by the National High blood Pressure Education Program working group (2000). The procedure was performed twice at 5–10 min intervals for each patient after the first measurement. Average values of both measurements were recorded as the BP.
Urine sample collection and estimation of proteinuria
Participants were asked to provide 10–15 ml of early morning urine in sterile leak-proof containers. Proteinuria was measured using a urine reagent dipstick (a semi-quantitative colour scale on the URIT 2VPG Medical electronic Co. Ltd., Guilin, China). These strips categorise proteinuria as negative, trace, 0.3 g/l, 1.0 g/l or 3.0 g/l, corresponding to negative, trace, 1+, 2+ and 3+, respectively; a positive test was considered to be ⩾0.3 g/l (⩾1+).
Blood sample collection and processing
A 5 ml venous blood sample was collected in the morning hours (8 am–11 am) from each of the 498 participants into vacutainer® plain tubes and the serum was separated into two cryovials and stored at −80°C (Thermo Scientific™ Freezers, Massachusetts, USA) until analysis.
Micronutrients and biochemical assay
Serum calcium and magnesium ions were measured immediately after blood sample collection, using an automated electrolyte analyser (FT-1000 Automated Chemical Analyser, Fortune Company Limited, Chengdu, China). Total protein (TP) and albumin (ALB) were measured using an automatic chemical analyser (COBAS Integra 400 Plus; Roche Diagnostics, Bellport, New York, USA). Albumin-adjusted calcium or corrected calcium (mmol/l) was calculated based on Payne’s formula as follows:
For albumin <40 g/l, corrected Ca = measured total Ca + 0.02 × (40 − serum albumin [g/dl]), where 40 represents the average albumin level.
For albumin >45 g/l, corrected Ca = measured total Ca − 0.02 × (serum albumin [g/dl-45]), where 45 represents the average albumin level. Low magnesium was defined as a level below 0.75 (reference range 0.75–1.05 mmol/l). Low calcium was defined as levels below 2.19 mmol/l (reference range 2.12–2.62 mmol/l). 18
AGMs biomarker assay
Serum concentrations of VEGF-A, sFlt-1, PlGF and sEng were measured in duplicate using competitive Quantikine ELISA kits from R&D System Inc. (Minneapolis, MN, USA). VEGF-A, sFlt-1, PlGF and sEng were measured spectrophotometrically at a wavelength of 450-nm wavelength using a microplate ELISA reader (Bio-Tek ELx808 microplate reader, Hayward, CA, USA). The concentrations of each biomarker were derived from standard curves from a known standard concentration of recombinant factors.
Biomarkers of oxidative stress assay
Following the manufacturer’s instructions, urinary and serum 8-OHdG were analysed in duplicates using highly sensitive and competitive ELISA kits (ab201734; Abcam, Shanghai, China). Serum concentrations were determined by comparison to a standard curve and recorded in ng/l. The intra-and-inter assay coefficients of variation (CV) were 3.5% and 4.5%, respectively. Urinary 8-OHdG concentrations obtained from the standard curves were normalised to creatinine concentrations and recorded as ng/mg Cr.
Serum 8-epi-PGF2α was analysed in duplicate using competitive ELISA kits from Elabscience, Shanghai, China (cat. LogE-EL-0041). The intra-and-inter assay CV were 5.6% and 6.4%, respectively. The absorbance of both 8-epi-PGF2α and 8-OHdG was read at 450 nm on a microplate reader (Bio-Tek ELx808 microplate reader, Hayward, CA, USA).
TAC reagents were obtained from Sigma-Aldrich (Hong Kong, China). Plasma samples were thawed to measure TAC spectrophotometrically at 593 nm using Mindray BA-88A, Wuhan, Hubei, China. The estimation of TAC was based on ferric reducing ability of plasma by following the manufacturer’s instructions. The absorbance was used to obtain the concentrations after comparison to standard curves and recorded in µmol/l.
Ethical consideration
Ethical approval for this study was granted by the Committee on Human Research, Publications and Ethics (CHRPE) (CHRPE/AP/365/14), School of Medical Sciences, Kwame Nkrumah University of Science & Technology (KNUST) and the Research and Development (R&D) Unit of KATH, Ghana. Participants gave written informed consent before they were included in the study.
Statistical analysis
Statistical analysis was performed using the R Language for Statistical Computing version 3.6.0, Vienna, Austria. 19 The Chi squared test was used to assess the significance of association between sociodemographic and clinical characteristics of participants and their PE status. The distribution of AGMs and OS biomarkers were presented with density plots. Hierarchical clustering by Spearman’s correlation was used to assess the relationship between AGMs, OS biomarkers (and their ratios) and micronutrients. p Values were corrected using the Benjamini-Hochberg correction for multiple test comparison. Comparison between EO-PE, LO-PE and normotensive pregnant women was performed using One-Way ANOVA for parametric variable and Kruskal Wallis test for non-parametric variables followed by post hoc multiple comparison test. Data was presented as mean ± standard deviation for parametric variable and median (interquartile range) for non-parametric variables. The binary logistic regression was used to determine the quartiles of AGMs and OS biomarkers associated with low levels of calcium and magnesium. A p-value less than 0.05 was considered statistically significant.
Results
Table 1 displays the sociodemographic and clinical characteristics of study participants. The mean age of participants was 29.01 ± 5.45 years. There was no significant difference between the mean age of normotensive pregnant women compared to EO-PE and LO-PE (p = 0.1474). EO-PE followed by LO-PE women, compared to women with normotensive pregnancies, had significantly higher levels of systolic blood pressure (SBP) (173.3 versus 167.4 versus 112.4 mmHg; p < 0.0001), diastolic blood pressure (DBP) (109.7 versus 108.2 versus 71.07 mmHg; p < 0.0001), gestational body mass index (29.11 versus 28.19 versus 27.82 kg/m2; p = 0.0109) and proteinuria (1.27 versus 0.9 versus <0.3 g/l; p < 0.0001). Conversely, EO-PE and LO-PE women had significantly lower levels of TP (60.3 versus 61.4 versus 62.8 g/l; p < 0.0001) and albumin (31.0 versus 32.0 versus 34.0 g/l; p < 0.0001) compared to normotensive pregnant women, respectively. The mean gestational age of the participants was significantly lower among EO-PE women followed by LO-PE compared to normotensive pregnant women (32.5 versus 36.0 versus 38.7, p < 0.0001).Most participants had completed secondary education (41.8%), were married (83.7%), were the Akans by ethnicity (81.7%), had informal occupation (47.2%), earned low-income monthly salaries (36.7%), were nulliparous (39.4%), were multigravida (70.5%), had no family history of hypertension (77.9%) and no history of spontaneous abortion (73.5%). Across study groups there was a significant association between study participants and levels of education (p = 0.0117), occupation (p < 0.0001) and basic monthly salary (p = 0.0235; Table 1).
Sociodemographic and clinical characteristics of study participants.
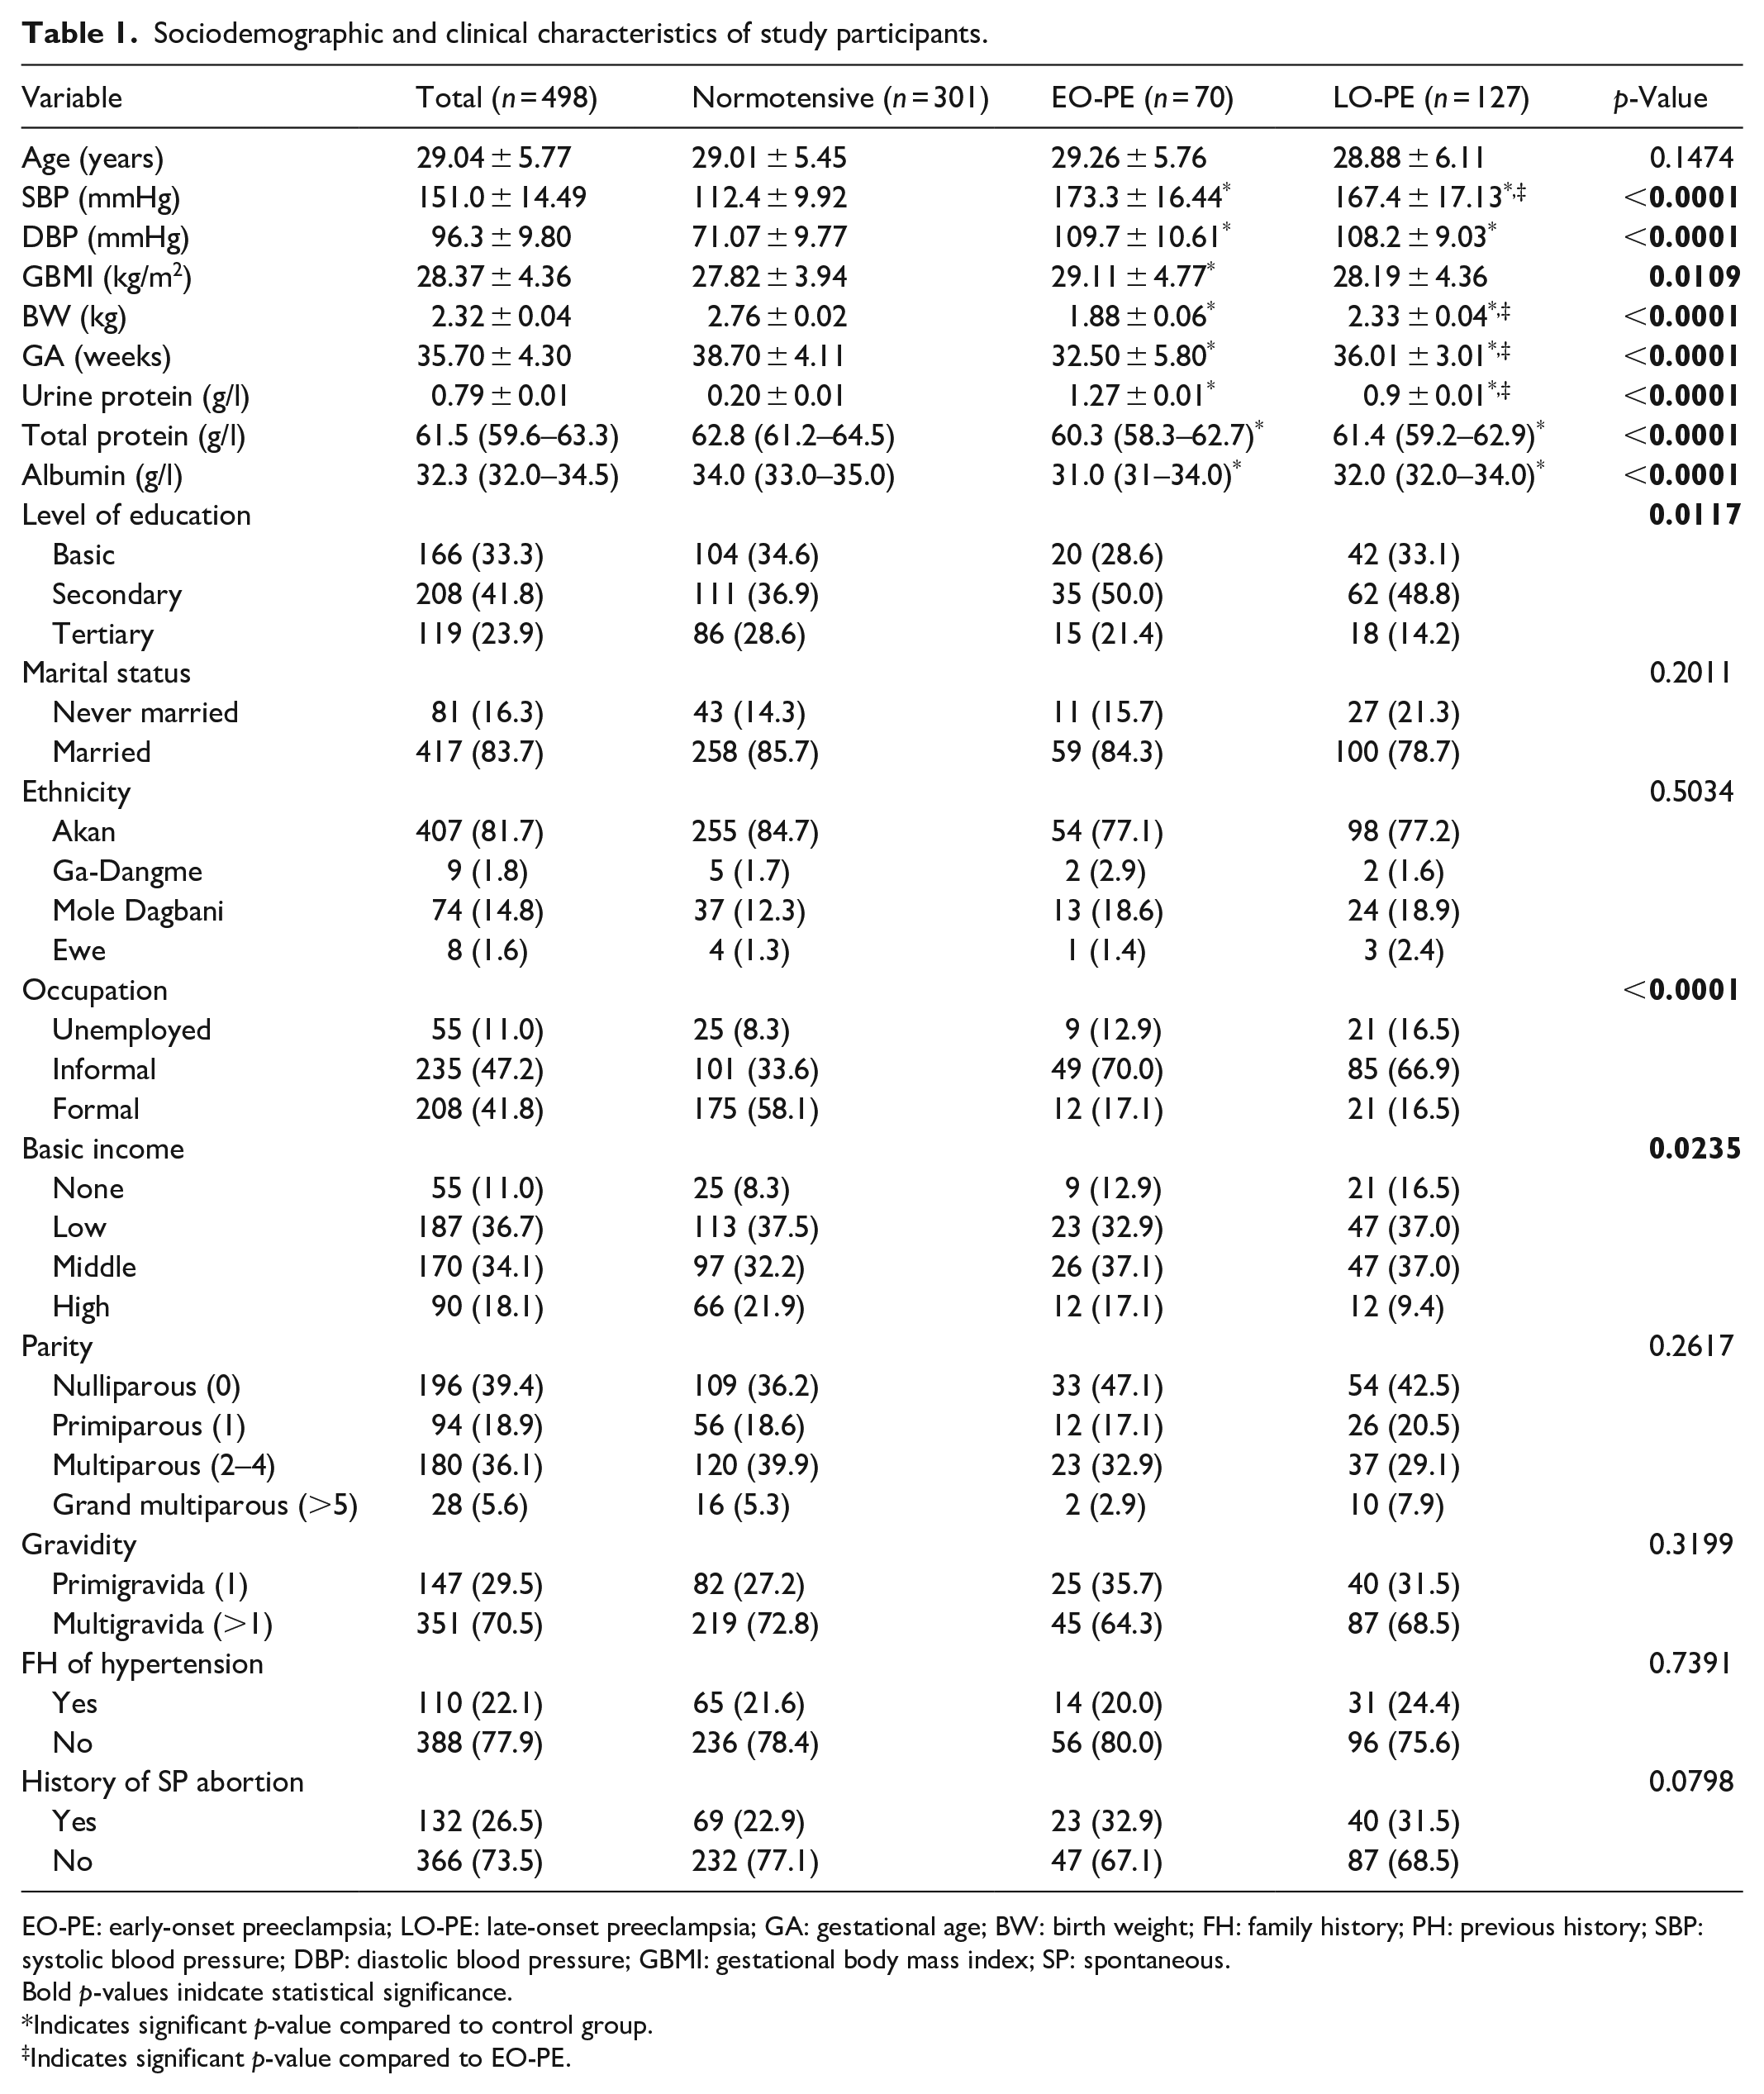
EO-PE: early-onset preeclampsia; LO-PE: late-onset preeclampsia; GA: gestational age; BW: birth weight; FH: family history; PH: previous history; SBP: systolic blood pressure; DBP: diastolic blood pressure; GBMI: gestational body mass index; SP: spontaneous.
Bold p-values inidcate statistical significance.
Indicates significant p-value compared to control group.
Indicates significant p-value compared to EO-PE.
Regarding micronutrients (Figure 1), the EO-PE women had significantly lower levels of magnesium (0.53 versus 1.07 mmol/l; p < 0.0001) and albumin-adjusted calcium (1.73 versus 2.41 mmol/l; p < 0.0001) compared to LO-PE women. Similarly, the LO-PE women had significantly lower levels of magnesium and calcium compared to the normotensive pregnant women (p < 0.0001). Conversely, the EO-PE and LO-PE had significantly higher serum albumin-adjusted calcium:magnesium ratio compared to the normotensive pregnant women (Figure 1).

Distribution and serum levels of micronutrient stratified by study groups. Density plot (a) and violin plot (b) of serum levels of micronutrients stratified by study groups.
Regarding OS biomarkers and AGMs (Figure 2), the EO-PE women had significantly lower levels of PlGF (p < 0.0001) and VEGF-A (p < 0.0001) and significantly higher levels of sEng (p < 0.0001) and sFlt-1 (p < 0.0001) compared to normotensive pregnant women. Similarly, The LO-PE women had significantly lower levels of PlGF (p < 0.0001) and VEGF-A (p < 0.0001) and significantly higher levels of sEng (p < 0.0001) and sFlt-1 (p < 0.0001) compared to normotensive pregnant women. Meanwhile, there was no significant difference in the levels of AGMs in EO-PE compared LO-PE pregnancies (p > 0.05). Also, the EO-PE and LO-PE women had significantly lower levels of TAC (p < 0.0001) and significantly higher levels of 8-epi-PGF2α (p < 0.0001), urinary 8-OHdG (p < 0.0001) and serum 8-OHdG (p < 0.0001) compared to normotensive pregnant women. Again, there were no significant differences in the individual markers of OS among EO-PE compared to LO-PE pregnancies (p > 0.05) (Figure 2).
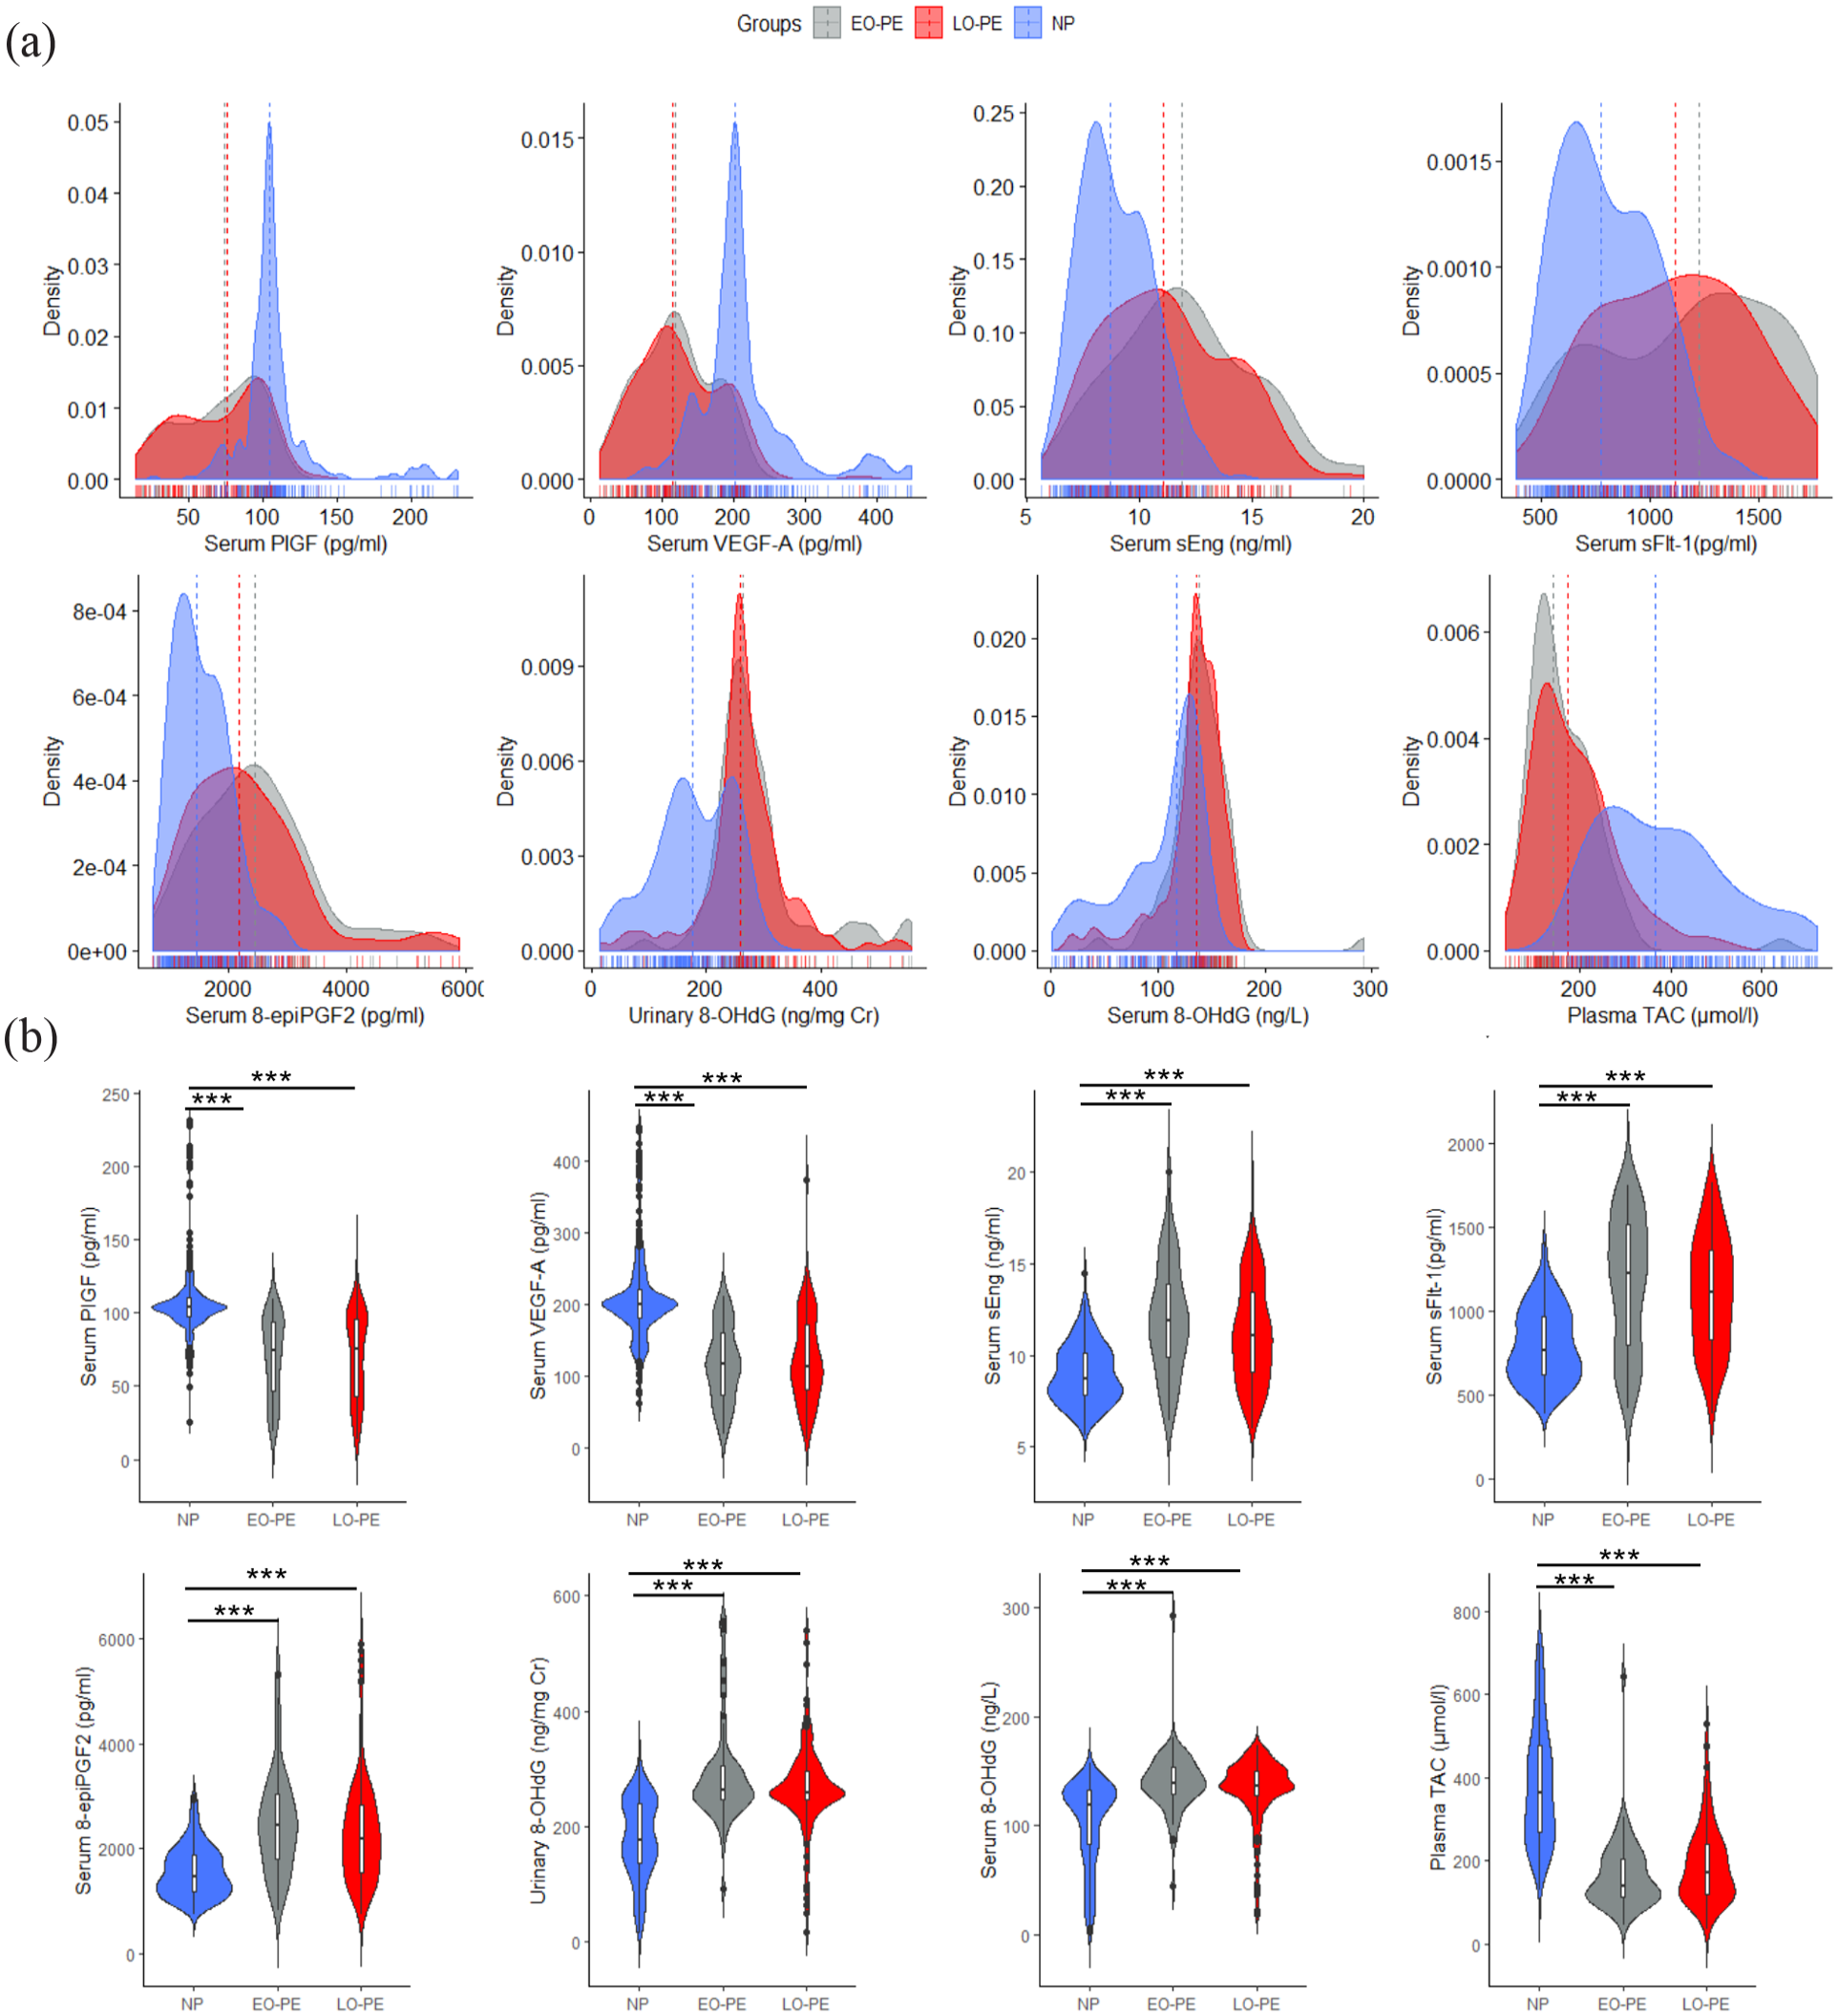
Oxidative stress biomarkers and AGMs stratified by study groups. Distribution (a) and violin plots (b) of serum levels of OS and AGMs stratified by study groups.
Regarding the ratio of OS biomarkers and AGMs (Figure 3), EO-PE and LO-PE women both had significantly higher levels of sFlt-1:PlGF ratio (p < 0.0001) and 8-epi-PGF2α:PlGF ratio (p < 0.0001), 8-OHdG:PlGF ratio (p < 0.0001) and sEng:PlGF ratio (p < 0.0001) than normotensive pregnant women. Again, there was no significant difference in the levels of these combined markers among EO-PE compared to LO-PE pregnancies (p > 0.05) (Figure 3).

Combined ratio of OS biomarkers and AGMs stratified by study groups. Distribution (a) and (b) violin plots of the combined ratio of OS and AGMs stratified by study groups.
As shown in Tables 2 and 3, there was no significant correlation between majority of the individual and combined OS biomarkers, AGMs and micronutrients or clinical profile among normotensive pregnant women except for a positive correlation between urinary 8-OHdG and birth weight (BW) (r = 0.115, p = 0.047), Mg and TAC (r = 0.131, p = 0.023) (Table 2), and a negative correlation between Mg and sFlt-1:PlGF (r = −0.545, p = 0.001) (Table 3) (p > 0.05).
Spearman rho correlation of OS biomarkers and AGMs with micronutrients and clinical profile among normotensive pregnant women.
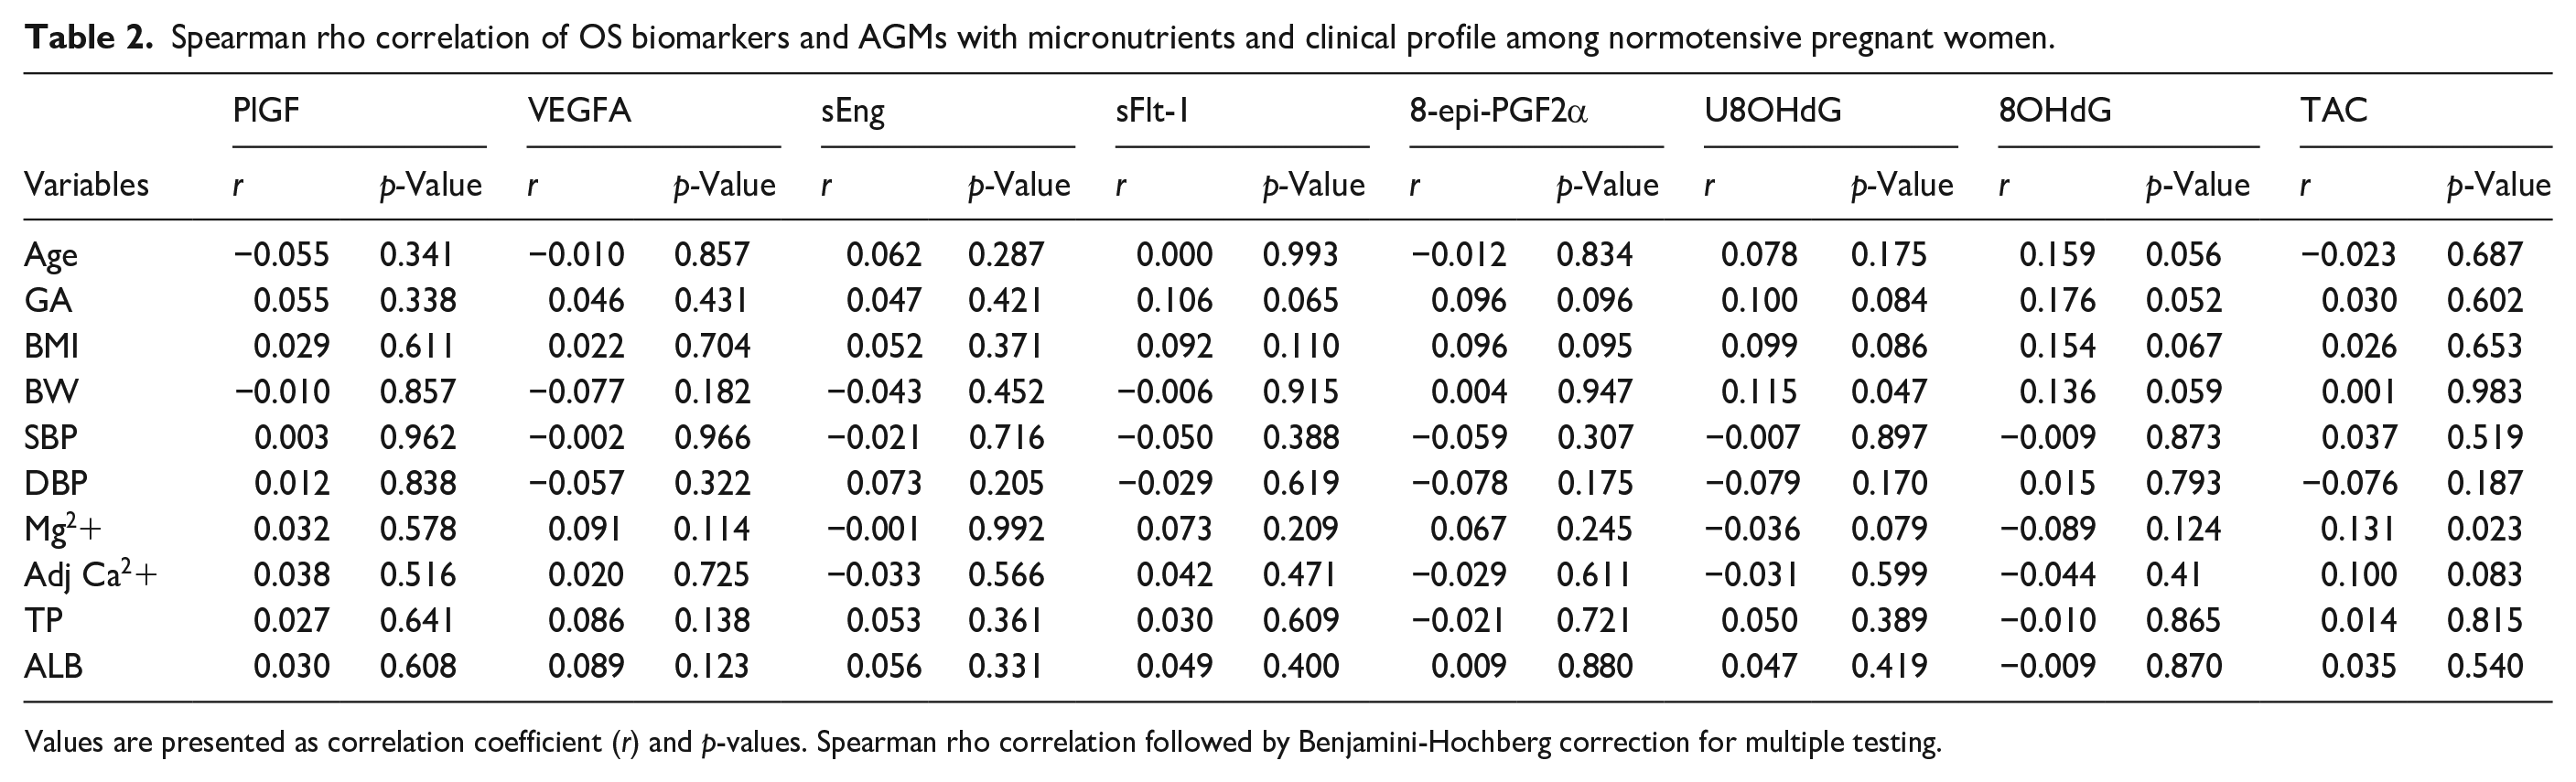
Values are presented as correlation coefficient (r) and p-values. Spearman rho correlation followed by Benjamini-Hochberg correction for multiple testing.
Spearman rho correlation of the ratio of OS biomarkers and AGMs with micronutrient and clinical profile among normotensive pregnant women.
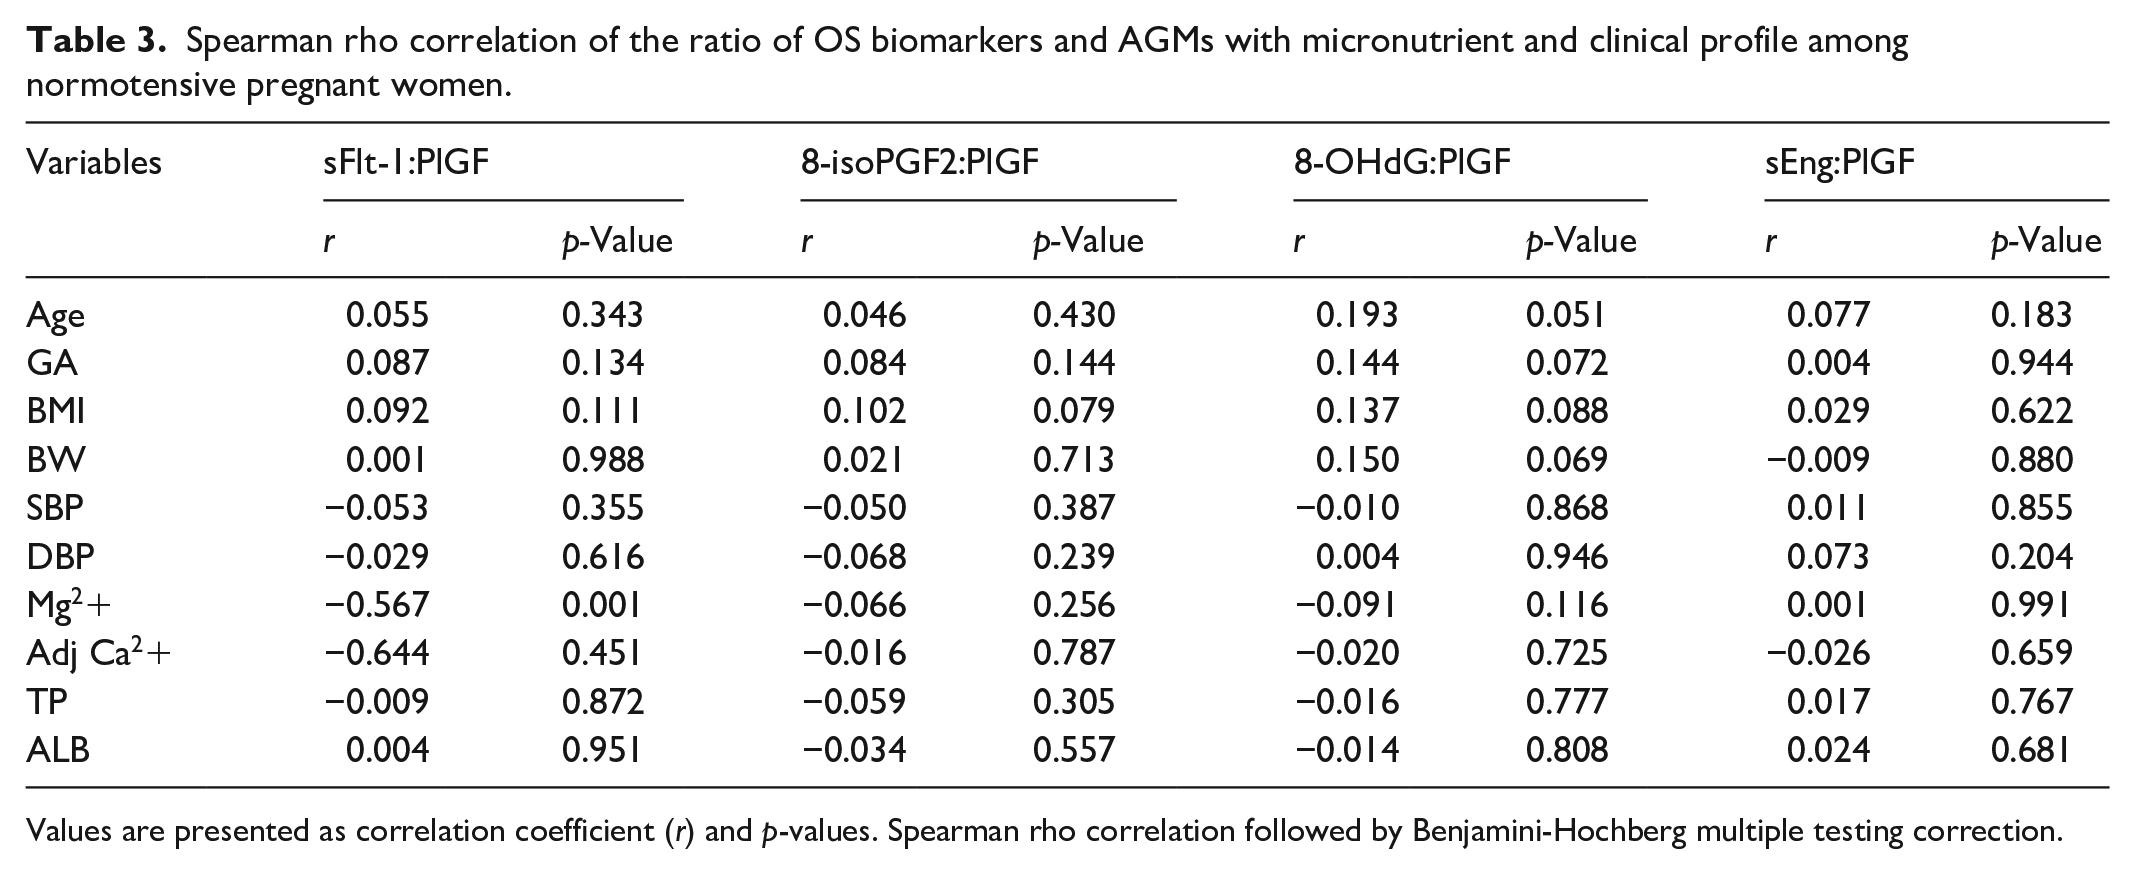
Values are presented as correlation coefficient (r) and p-values. Spearman rho correlation followed by Benjamini-Hochberg multiple testing correction.
Table 4 shows Spearman rho correlations Variables OS, AGMs, micronutrients and clinical profile among EO-PE and LO-PE sting co. Among the EO-PE women, there was a significant positive correlation between PlGF and Mg, Ca, TP and ALB (p < 0.05) and a significant negative correlation between SBP. Also, VEGF-A correlated significantly and negatively with TP and ALB (p < 0.05). sEng was positively correlated with and SBP but negatively with BW, TP and ALB (p < 0.05). Levels of sFlt-1 and 8-epi-PGF2α yielded significant negative correlations with BW, Mg, Ca, TP and ALB and a positive correlation with SBP (p < 0.05). Furthermore, there was a negative correlation between urinary 8-OHdG and TP and ALB (p < 0.05). In addition, 8-OHdG correlated significantly and negatively with Mg, Ca, TP and ALB (p < 0.05). Conversely, there was a positive significant correlation between serum TAC and Mg, Ca, TP and ALB (Table 4).
Spearman rho correlation of OS biomarkers and AGMs with micronutrients and clinical profile among EO-PE women and LO-PE.

Values are presented as correlation coefficient (r) and p-values. Spearman rho correlation followed by Benjamini-Hochberg multiple testing correction. Bold p-values indiciate statistical significance.
Among the LO-PE women, there was no significant correlation between PlGF and micronutrients or clinical profile among LO-PE women (p < 0.05). However, a significant and a negative correlation was observed between VEGF-A and SBP and DBP, but a significant and positive correlation was observed between VEGF-A and BW (p < 0.05). There was a significant and negative correlation between sEng and that of TP, and ALB (p < 0.05). Again, levels of sFlt-1 yielded a significant and negative correlation with Mg level (p < 0.05). There was no significant correlation between 8-epi-PGF2α and micronutrient or clinical profile of LO-PE women. Furthermore, there was a significant and negative correlation between urinary 8-OHdG and TP and ALB (p < 0.05). Similarly, there was a significant and negative correlation between serum 8-OHdG and TP and ALB (p < 0.05). Conversely, there was a significant and positive correlation between TAC and TP and ALB but a negative correlation between TAC and SBP (Table 4).
Table 5 summarises Spearman rho correlations between OS, AGMs, with micronutrient and clinical profile among EO-PE and LO-PE pregnant women. Among EO-PE pregnant women, sFlt-1:PlGF ratio, 8-isoPGF2α:PlGF ratio, 8-OHdG:PlGF ratio and sEng:PlGF ratio were significant and negatively correlated with BW, Mg, Ca, TP and ALB levels but significant positively correlated with SBP.
Spearman rho correlation of the ratio of OS biomarkers and AGMs with clinicobiochemical profile in EO-PE and LO-PE.

Values are presented as correlation coefficient (r) and p-values. Spearman rho correlation followed by Benjamini-Hochberg multiple testing correction. Bold p-values indiciate statistical significance.
Among LO-PE women, there was no significant correlation between sFlt-1:PlGF ratio, 8-isoPGF2α:PlGF ratio, 8-OHdG:PlGF ratio and sEng:PlGF ratio and micronutrients or clinical profile of women (Table 5).
Among the EO-PE women, the first quartile (adjusted odds ratio (aOR) (95% CI) = 3.14 (1.60–7.21), p = 0.0228) and second quartile (aOR (95% CI) = 1.63 (1.16–5.33), p = 0.0373) for serum PlGF, first quartile for VEGF-A (aOR (95% CI) = 2.09 (1.28–4.07), p = 0.0301) and TAC (aOR (95% CI) = 1.50 (1.52–4.77), p = 0.0380) and the fourth quartiles for serum sEng (aOR (95% CI) = 3.86 (2.05–6.89), p < 0.0001), serum sFlt-1 (aOR (95% CI) = 2.64 (1.57–4.19), p = 0.0051), 8-epi-PGF2α (aOR (95% CI) = 1.90 (1.52–5.24), p = 0.0303) and 8-OHdG (aOR (95% CI) = 2.73 (1.26–6.82), p = 0.0010) were independently associated with low calcium levels.
Similarly, the first quartile (aOR (95% CI) = 5.11 (2.42–13.55), p < 0.0001) and second quartile (aOR (95% CI) = 1.93 (1.40–5.93), p = 0.0352) for serum PlGF, first quartile for VEGF-A (aOR (95% CI) = 4.39 (2.60–8.73), p < 0.0001) and TAC (aOR (95% CI) = 2.72 (1.65–4.50), p = 0.0018) and the fourth quartiles for serum sEng (aOR (95% CI) = 4.51 (2.70–8.13), p < 0.0001), serum sFlt-1 (aOR (95% CI) = 5.07 (2.86–11.10), p = 0.0051), 8-epi-PGF2α (aOR (95% CI) = 2.55(1.63–5.81), p = 0.0064) and 8-OHdG (aOR (95% CI) = 2.03 (1.51–5.32), p = 0.0270) were independently associated with low magnesium levels (Table 6).
Multivariate logistic regression of adjusted odds ratios of AGMs and Biomarkers of OS quartile for predicting EO-PE women likely to develop low calcium and magnesium concentrations.
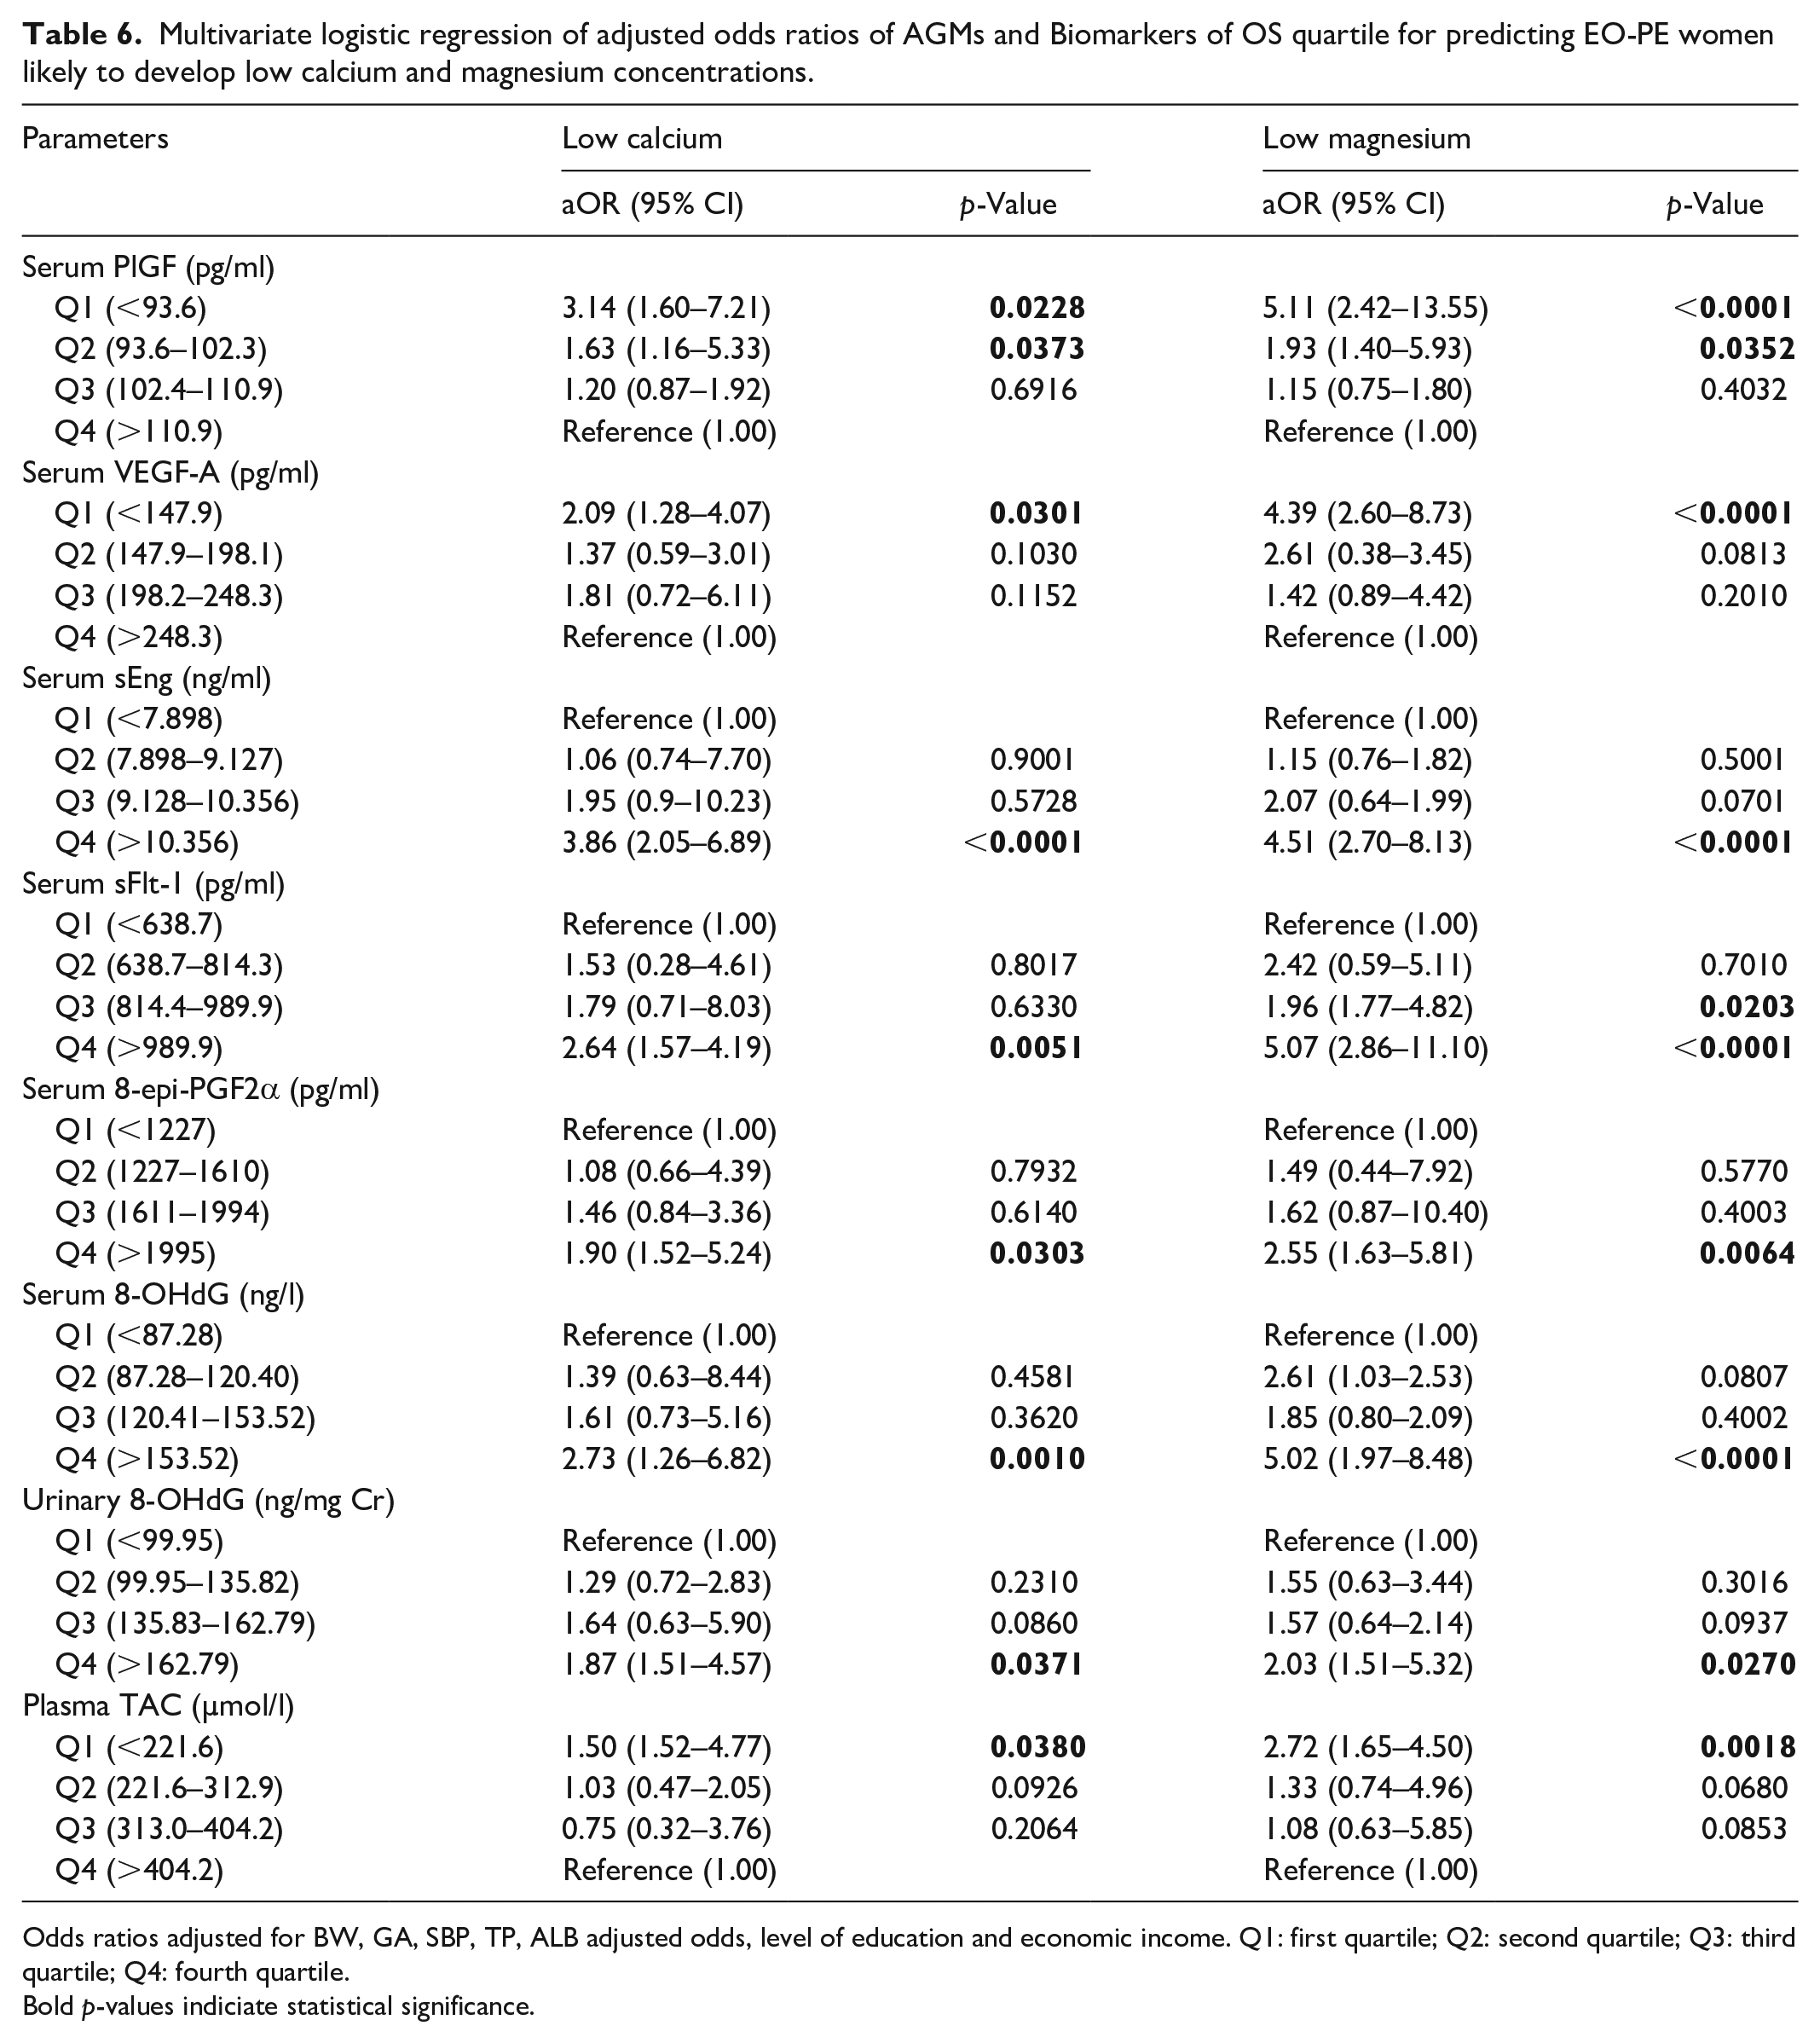
Odds ratios adjusted for BW, GA, SBP, TP, ALB adjusted odds, level of education and economic income. Q1: first quartile; Q2: second quartile; Q3: third quartile; Q4: fourth quartile.
Bold p-values indiciate statistical significance.
Among LO-PE women, only the fourth quartile for sFlt-1 was independently associated with low calcium (aOR (95% CI) = 2.03 (1.35–4.26), p = 0.0246) and magnesium (aOR (95% CI) = 2.19 (1.27–4.32), p = 0.0174) (Table 7).
Multivariate logistic regression of adjusted odds ratios of AGMs and BOS quartile for predicting LO-PE women likely to develop low calcium and magnesium concentrations.

Odds ratios adjusted for BW, GA, SBP, TP, ALB adjusted odds, level of education and economic income. Q1: first quartile; Q2: second quartile; Q3: third quartile; Q4: fourth quartile.
Bold p-values indiciate statistical significance.
Discussion
This study evaluated the levels of OS biomarkers, AGMs and micronutrients in EO-PE and LO-PE and normotensive pregnant women. The study also explored the relationship between OS biomarkers, AGMs and micronutrients in EO-PE and LO-PE. This study found a significant alteration in the levels of OS biomarkers, AGMs and micronutrients in both EO-PE and LO-PE women compared to the normotensive pregnant women. Micronutrients (calcium and magnesium) correlated significantly with individual and combined OS biomarkers and AGMs ratio in EO-PE. Moreover, the imbalanced AGMs and OS biomarkers were independently associated with low calcium and magnesium levels in EO-PE.
In this study of PE, we found an imbalance in AGMs depicted by the significantly lower levels of PlGF and VEGF-A and the corresponding higher levels of sEng and sFlt-1 in both EO-PE and LO-PE women compared to the normotensive pregnant women. Our finding is comparable to a study by Masoura et al. 20 , who reported significantly lower levels of PlGF and VEGF but higher levels of sFlt-1 in women with PE compared to normotensive controls in Greece. A recent study by Alahakoon et al., 21 also found significantly higher plasma sEng, sFlt-1 and lower PlGF in PE compared to normotensive pregnant women in Australia. Studies have highlighted the role of angiogenic imbalance in the pathophysiology of PE.22,23 Our findings support the concept that PE is the result of an imbalance between pro-angiogenic and anti-angiogenic mediators. 24 VEGF-A plays a crucial role in endothelial cell function by inducing angiogenesis, increased vascular permeability, endothelial cell growth and integrity. 25 PlGF is mainly expressed by placental trophoblasts that stimulates angiogenesis under conditions of hypoxia and inflammation. 23 Maynard et al., 26 found that elevated serum levels of sFlt-1 lead to endothelial dysfunction, high BP and proteinuria by antagonising VEGF and PlGF. sFlt-1, expressed from the trophoblast, inhibits angiogenesis by complexing VEGF/PlGF and preventing their interaction with their membrane receptors. Ultimately, SFlt-1 and VEGF complexation result in downstream signalling that led to vasoconstriction and endothelia dysfunction.27,28 This mechanism could explain our finding.
Also, consistent with previous reports, 29 we found that, both the EO-PE and LO-PE women had significantly higher levels of 8-epi-PGF2α, urinary 8-OHdG and serum 8-OHdG, sFlt-1:PlGF, 8-epiPGF2alpha:PlGF ratio, 8-OHdG:PlGF ratio, sEng:PlGF ratio and significantly lower levels of TAC compared to normotensive pregnant women. An increase in OS and reduced antioxidant capacity in PE could explain our study finding.30,31 Another explanation for the imbalanced ratio of AGMs and OS biomarkers among PE women in our study is that increased OS interacts with AGMs and influence changes in placental angiogenesis in PE. 31
Another interesting finding in this study was the significantly lower levels of magnesium and albumin-adjusted calcium in both the EO-PE and LO-PE compared to the normotensive pregnant women. This finding is in harmony with a study by Anto et al., 31 who reported significantly decreased serum calcium among preeclamptic women compared to normotensive controls. Studies by Punthumapol and Kittichotpanich 32 and Ikechukwu et al. 33 also found reduced serum calcium levels among PE women compared to controls in Thailand and Nigeria, respectively. Studies by Idogun et al. 34 and Salve and Rajgire 35 also found significantly lower levels of calcium and magnesium in preeclamptic women compared to healthy women. The agreement between our study finding and the previous studies support the evidence that micronutrients play a significant role in the pathogenesis of PE.35,36 However, studies by Darkwa et al. 18 in Ghana and Punthumapol and Kittichotpanich 31 in Thailand, did not find any significant difference in magnesium levels between PE women and normotensive pregnant women. The observed difference between these findings and the present study could be due to the relatively low sample size in both studies as well as variation in genetic, epigenetic and environmental factors.
Also, in consonance with a study by Sezer et al., 37 we found no difference in the micronutrients, AGMs and OS biomarkers between EO-PE and LO-PE women. The possible explanation is that both EO-PE and LO-PE result from the same challenge and therefore, their outcomes overlap. 6 However, Turpin et al. 10 and Alahakoon et al. 21 found significantly higher angiogenic imbalance and OS among EO-PE women than LO-PE women, suggesting that EO-PE is usually severe with more adverse maternal outcomes than LO-PE pregnancies. 6
An important and novel finding in this study was that calcium and magnesium levels correlated significantly with the single biomarkers and combined ratio of AGMs and OS biomarkers among EO-PE women. However, there was no significant correlation between calcium, magnesium and either the single or combined ratios of AGMs and OS biomarkers among the normotensive pregnancies. This finding is depicted by the significant positive correlation between calcium, magnesium, PlGF and TAC but the significant negative correlation between calcium, magnesium and sFlt, 8-epi-PGF2α, 8-OHdG, sFlt-1:PlGF ratio, 8-epi-PGF2α:PlGF ratio, 8-OHdG:PlGF ratio and sEng:PlGF ratio among the EO-PE women. Moreover, the imbalanced AGMs and OS biomarkers were independently associated with low calcium and magnesium levels in EO-PE. A possible mechanism explaining our study’s findings is that women with sufficient calcium and magnesium have balanced angiogenesis, increased antioxidant capacity and reduced OS. 15 PE women with insufficient calcium and magnesium are associated with increased OS, angiogenic imbalance and reduced antioxidant capacity. 16 The unbalanced AGMs and OS biomarkers and their corresponding association with low levels of magnesium and calcium was more prominent in EO-PE compared to LO-PE. This finding could be explained by the fact that EO-PE is usually severe with more adverse maternal outcomes than LO-PE pregnancies. 6
Despite the interesting findings, our study had a few limitations. This present study was unable to explore the repeated measure of these markers in a longitudinal cohort, hence, we could not observe the pattern of changes in levels of AGMs and OS biomarkers. Again, we could not estimate 24-h proteinuria which could have been a more standardised measure but instead adopted dipstick urine protein. However, this study is novel and the first to be conducted in a Ghanaian population. This is a baseline study; we therefore recommend future studies to explore repeated measure of calcium and magnesium levels across gestation to better understand the causal effect relationship and the exact gestation associated with imbalance of these micronutrients among women who develop PE.
Conclusions
Micronutrients (magnesium and calcium), AGMs and OS biomarkers play an important role in the pathogenesis of PE. Serial and routine measurement of these micronutrients would allow the monitoring of poor placental angiogenesis while enabling an understanding of the triggers of increased OS and reduced antioxidant in PE.
Supplemental Material
sj-docx-1-smo-10.1177_20503121231175759 – Supplemental material for Association between micronutrients, oxidative stress biomarkers and angiogenic growth mediators in early and late-onset preeclamptic Ghanaian women
Supplemental material, sj-docx-1-smo-10.1177_20503121231175759 for Association between micronutrients, oxidative stress biomarkers and angiogenic growth mediators in early and late-onset preeclamptic Ghanaian women by Enoch Odame Anto, Wina Ivy Ofori Boadu, Otchere Addai-Mensah, Yaw Amo Wiafe, William KBA Owiredu, Christian Obirikorang, Max Efui Annani-Akollor, Eric Adua, Michael Appiah, Stephen Opoku, Emmanuel Acheampong, Evans Adu Asamoah, Eddie-Williams Owiredu, Agartha Odame Anto, Augustine Tawiah, Frank Ankobea, Ebenezer Afrifa Yamoah and David Antony Coall in SAGE Open Medicine
Footnotes
Acknowledgements
The authors are grateful to all pregnant women who participated in the study, the staff of Komfo Anokye Teaching Hospital, the O&G unit, for their participation and immense support in making this research a success.
Author contributions
Conceived and designed the experiments: EOA and DAC; Performed the experiments: EOA and AT; Analysed the data: EOA, SO and EWO; Wrote the first draft of the manuscript: EOA and SO; Contributed to the writing of the manuscript: EOA, SO, YAW, OAM, AT, WKBAO, CO, MAA, EA, WIOB, EMA, EAA, EWO, FA, EAY and DAC; Enrolled patients: EOA, AT and FA. Agreed with manuscript results and conclusions: All authors.
Informed consent
Written informed consent was obtained from all subjects before the study.
Declaration of conflicting interests
The author(s) declared no potential conflicts of interest with respect to the research, authorship, and/or publication of this article.
Funding
The author(s) received no financial support for the research, authorship, and/or publication of this article.
Data availability
All the necessary data are included in the manuscript. The raw data are accessible from the corresponding author upon reasonable request.
Supplemental material
Supplemental material for this article is available online.
References
Supplementary Material
Please find the following supplemental material available below.
For Open Access articles published under a Creative Commons License, all supplemental material carries the same license as the article it is associated with.
For non-Open Access articles published, all supplemental material carries a non-exclusive license, and permission requests for re-use of supplemental material or any part of supplemental material shall be sent directly to the copyright owner as specified in the copyright notice associated with the article.