
Abstract
Previously, we described how patients with new-onset Alzheimer’s disease were differentiated from healthy, normal subjects to 100% accuracy, based on the amplitudes of the nonrhythmic back-projected independent components of the P300 peak at the electroencephalogram electrodes and their latency in the response to an oddball, auditory evoked potential paradigm. A neural network and a voting strategy were used for classification. Here, we consider instead the statistical distribution functions of their latencies and amplitudes and suggest that the 2-sample Kolmogorov-Smirnov test based upon their latency distribution functions offers an alternative biomarker for AD, with their amplitude distribution at the frontal electrode fp2 as possibly another. The technique is general, relatively simple, and noninvasive and might be applied for presymptomatic detection, although further validation with more subjects, preferably in multicenter studies, is recommended. It may also be applicable to study the other P300 peaks and their associated interpretations.
Keywords
Introduction
It is important to be able to diagnose new-onset Alzheimer’s disease (AD) sufferers both for their care and their personal planning. Evoked potential analysis might provide a relatively inexpensive, quick, and noninvasive technique for this and has therefore been investigated. A method of distinguishing with 100% accuracy between patients with early-stage AD and normal, healthy subjects (controls) of our data set based upon the nonoscillatory, independent components (ICs) of the P300 peak in the P300 waveform elicited by an auditory oddball paradigm is described in this article. Because averaging is not used, potentially significant components, unsynchronized to the stimulus, are not reduced, and results may be obtained using fewer trials per subject. This method could be a useful tool to aid diagnosis when the selected ICs might be regarded as biomarkers. The method might also be useful for presymptomatic testing for AD.
Since the review and description of work previous to 2011, 1 there have been further publications on the topic in question. In a review of 2011, 2 it was concluded that the sensitivities of a number of Event RelatedPotential (ERP) components have great promise for the detection of the stages of AD. Another review in 2014 3 was focused on the progression from mild cognitive impairment (MCI) to AD. All the studies quoted followed changes in amplitude and latency of the P300 peak, but on an average basis. In reference 4 trial averaging and statistical analysis of the peak ERP amplitudes and latencies derived from a 3-stimulus auditory oddball paradigm showed that the P3a and P3b peaks produced the most sensitive and reliable measures of the cognitive deficits associated with early AD. None of this work 2 -4 addressed the analysis on a single-trial basis as described here. However, Ouyang et al 5 have analyzed single trials by applying the technique of residue iteration decomposition to identify the latencies of the different ERP peaks in different trials. It seems that this technique, though, does require some averaging of trials to obtain the initial most likely latency of the ERP peaks, after which the individual latencies are found by an iterative method. No application which differentiated between different subject groups was presented. By contrast, in our previous work, 6 we derived the individual components of the individual ERP peaks comprising each individual single trial using independent component analysis (ICA) and applied this knowledge to differentiate between controls and ADs. It seems none of the authors 2 -5 were aware of the previous work by both ourselves and those we quoted, 1 although the work of Jung et al using ICA is mentioned in one paper. 5 In another review, 7 it was concluded that patients with MCI had prolonged P300 latencies compared to controls but shortened P300 latencies when compared to patients with AD, meaning that ADs had longer latencies than controls.
We report here on further analysis undertaken subsequent to our earlier work. 6 In that we used an artificial neural network, christened by the Probabilistic Simplified Fuzzy ARTMAP (PSFAM), 8 to classify data input vectors, derived from the ICs of the P300 auditory evoked response, as belonging either to normal (or healthy) participants (controls) or to participants with newly diagnosed AD (patients). These consisted of the back-projected ICs (BICs) at the scalp voltage measurement electrodes and their latencies, which had been derived from the data obtained in further earlier work, which has been thoroughly described in 2 previous publications. 1,9 The PSFAM included a Simplified Fuzzy ARTMAP (SFAM) and a Bayes classifier. We had observed that the SFAM was the more accurate classifier for the normal participants, while the Bayes classifier was more accurate for the AD participants. Using both together with a voting strategy allowed 100% correct classification accuracy. This indicated that the statistical distribution of the BICs in the case of the normal participants was different to that of the AD participants. Thus, we have since investigated these statistical distributions and observed that there are indeed differences, and we have identified the Kolmogorov-Smirnov (KS) 2-sample statistical test of goodness-of-fit 10,11 as a possible biomarker for AD. In this article, we describe the new statistical work and include only a brief outline of the earlier work already described. 1,6,9
The P300 waveform in the electroencephalogram (EEG) is evoked when an experimental participant responds to the occurrence of a known target acoustic tone contained within a string of nontarget tones. This waveform is undulatory, variable from trial to trial, and contaminated by the random EEG. Conventionally, a number of trial waveforms are averaged. This reduces the effect of the EEG. However, averaging may reduce meaningful components which are unsynchronized to the stimulus onset. This is one reason why we avoid averaging and have developed the study of single-trial waveforms. We use ICA to determine the ICs of the waveform, that is, those components produced by independent brain signal sources, which after propagation through the head and superimposed at the scalp electrodes produce the measured P300 waveforms (see Figure 1). The voltages at the EEG electrodes owing to the signal sources are computed and are referred to as BICs. Artefactual signals are removed during this process. The resulting undulatory P300 waveform includes a number of positive and negative peaks. 1 We found that the peaks in the P300 waveform consisted of many short duration, randomly occurring, and randomly positive or negative half-sinusoidal pulses. 1 This is one reason why the P300 waveform is so variable, making analysis based upon it inaccurate. We have therefore investigated these pulses. Attention is focused upon the positive BICs centered on the P300 peak because it occurs at about 300 milliseconds after stimulus onset, because the shape of the peak is primarily determined by these, and the latency of this peak is delayed in ADs compared to controls. 1,7 Also only the P300 peak is nearly always present in the waveform. In particular, the BIC voltages at electrodes fp2 and P3 were examined because patients with AD show more voltage positivity frontally, while normal subjects show more positivity parietally. 9 Therefore, these BICs were deemed most likely to be useful for differentiating between ADs and controls.

(A) A single-trial P300 and (B) the average of 360 trials of the P300 on Cz. The first vertical line indicates the onset of the stimulus S, and the second vertical line marks the upper limit of the interval where the P300 components are likely to occur. The P300 peak is seen at about 950 milliseconds.
Material and Methods
The ICA Theory
The voltage measured at each electrode depends upon the contributions from all the independent cortical signal sources. These depend upon the unknown source signals and their unknown transmission paths from the sources to the electrodes. Fortunately, the individual source signals may be computed from the measured scalp voltages using ICA,
1
where it was explained that if

And

Thus, the estimated source signals (

The BICs are correct in both magnitude and sign and so may be compared.
Kolmogorov-Smirnov Goodness-of-Fit Tests
The KS tests assess the equality of 2 continuous, 1-D probability distributions. They are nonparametric, that is, they are independent of the type of distribution. The 1-sample test quantifies a distance between the empirical distribution function of the sample and the cumulative distribution function of the reference distribution, usually, and here, the normal distribution. The sample here consists of all the latencies, or fp2 voltages, or P3 voltages for all the healthy participants. The 2-sample test quantifies a distance between the empirical distribution functions of the 2 samples. Here, the first sample consists again of all the latencies, or fp2 voltages, or P3 voltages for all the healthy participants. The second sample consists of the latencies, or fp2 voltages, or P3 voltages and the corresponding distribution functions of each individual participant in turn. The largest differences between the 2 cumulative distribution functions in each case are found and compared to the 95% critical value. The null hypothesis for the 1-sample test is that the sample is drawn from the reference distribution, namely, the normal distribution here. The null hypothesis for the 2-sample test is that the samples are drawn from the same distribution. Software functions are available for carrying out these tests in, for example, Excel (with add-on) or MATLAB.
Measurements
P300 data
P300 recordings were performed on 9 healthy controls and 9 confirmed AD participants. Healthy participants (6 males, 3 females) had no history of neurological or psychiatric disorder. They were between 37 and 74 years of age. The patients with AD (2 males, 7 females) were between 57 and 88 years old, all with higher education, and were diagnosed with dementia of the Alzheimer’s type, in the early stage, mild form, by means of psychometric tests and cerebral tomography (CT). They had Mini-Mental State Examination scores ranking from 18 to 29, and CT examination showed cortical or cerebral atrophy. During the clinical diagnosis, all the mentions in the NINCDS were performed. It was not possible to obtain age- and sex-matched healthy controls to all the patients with AD, though it would in any case be difficult to allow for age. This might be a disadvantage if a close comparison were attempted for clinical purposes, but here we are interested in showing that important information may be obtained with our method. A much larger, carefully designed study would be needed for detailed clinical evaluation of the method, but this is beyond the focus of this article.
All the participants provided written consent that their EEG and P300 waveform could be used for research and the recordings were anonymized before they were supplied to the researchers for data processing. As this data recording was done in the multicenter research framework provided by the European Biopattern FP6 program (2003-2008), all the necessary ethics committee approval according to European and national regulations were taken at that time.
P300 EPs were recorded from 27 channels. The electrodes encompassed the largest possible area, recordable from 27 equidistant positions. Linked ears (A1-A2) were used as the recording reference and electrode AFZ was the ground.
The recording cap made by Falk Minow Services, model EASYCAP, and the Large Equidistant 32-Channel Arrangement, montage No. 23, giving interelectrode distances of 43 to 68 mm (for a head circumference of 58 cm) were used. All EEG electrode impedances were lower than 5 kΩ. The recordings were made using the EMS-GmbH model Phoenix Clinical Lab Digital EEG machine.
Following the published standards, 12 signals were digitally sampled at 1024 Hz, with a high-pass filter of cutoff frequency 0.016 Hz, a low-pass filter of cutoff frequency 60 Hz, and a notch filter at 50 Hz (to remove electrical mains contamination). A stimulator provided 40 2-kHz target tones (20%) and 160 1-kHz nontarget tones (80%). The Inter Stimulus Interval was 1.29 seconds. Subjects were seated with closed eyes, were relaxed, and were instructed to listen carefully and press a button immediately they heard the target tone.
A 10-second epoch of EEG only data was recorded for each subject, both before and after the total of 200 tones from the stimulator. A total of 720 target trials were recorded from the controls and the patients, 360 trials each. For each of the target P300s, 599 samples before the stimulus and 700 samples after the stimulus (1300 samples) were taken to form a target single trial P300 lasting 1269.5 milliseconds.
Procedures
The following signal processing was performed as fully detailed before. 1,9 The ICs of the P300 waveforms were obtained by applying principal components analysis first and then ICA. 1 These ICs were then back-projected to the 27 measurement electrodes 6 as the BICs. These were separated into separate bins centered around the P300 peak. The highest variance BICs were selected for further processing. The BICs in each bin were clustered in 2 stages using the k-means clustering algorithm. 1,9 In the primary stage, clustering was by the amplitudes and the latencies at Cz and in the secondary stage by the scalp topographies. 1,9 Noise components were eliminated by filtering out ICs according to the number of zero crossings in their waveform and their largest and smallest amplitudes. 1,9 Within each bin, the peak amplitudes, latencies, and the scalp topographies of the BICs were saved for analysis. 1,9
In the previous paper, 1 the BIC results obtained at this stage of processing were discussed and have also been briefly reviewed in the above Introduction. These data may be requested from the corresponding author. Since it had been established 1 that those positive BICs associated with the P300 peak, and their latencies, were the most significant in distinguishing the 2 classes, the amount of data could be considerably reduced by using only that for positive BICs found close to the P300 peak, that is, those in bin 5. The data spreadsheet was reduced to provide subject details, subject class (AD or normal), trial number, BIC information (which bin, which cluster, amplitude, latency), and the voltages of the BICs at the 27 measurement electrodes used. 6 This spreadsheet was divided into separate spreadsheets for the AD and normal participants. The analysis to be described used this spreadsheet data in which latencies and amplitudes had been normalized to |1|. 6
This investigation of the properties of the statistical distributions of the latencies at Cz and amplitudes of the BICs at the measurement electrodes was undertaken by examining their statistical distributions in the form of histograms (plots of frequency of occurrence of the value versus the value [latency, or Fp2 voltage, or P3 voltage]) and by testing their goodness-of-fit using the KS test. In what follows B5 Ci refers to bin 5, component i, i = 1 to 5.
An example of the data analyzed is given in Table 1. This shows the normalized latency values for component 4 BICs in bin 5 for each of the normal participants as they appeared in the Excel spreadsheet. Similar tables were made for all the BICs in bin 5 for the patients with AD, and the corresponding tables were also made for the voltages at the different electrodes. The Excel histogram facility was used to produce histogram plots for the individuals and also for all the normal participants as a group, and similarly for the patients with AD. Excel was used to find the maximum and minimum values of the data, their range, and the histogram bin sizes, given the range and the number of bins. The number of histogram bins was set to the square root of the number of data in each histogram (or column of the table).
Sample Section of Data Array.

Results
Latencies
First we describe the results for the latencies. The first thing to notice is that the latencies of the components B5 Ci for the patients with AD tend to lag those of the normal participants in a regular manner as illustrated in Figure 2. This suggests that the latency of the component B5 Ci for a normal subject can be meaningfully compared directly with the latency of component B5 Ci for a patient with AD. For example, for the patients with AD, B5C5 clearly lags B5C5 for the normal participants, and the 2 data sets can be compared.
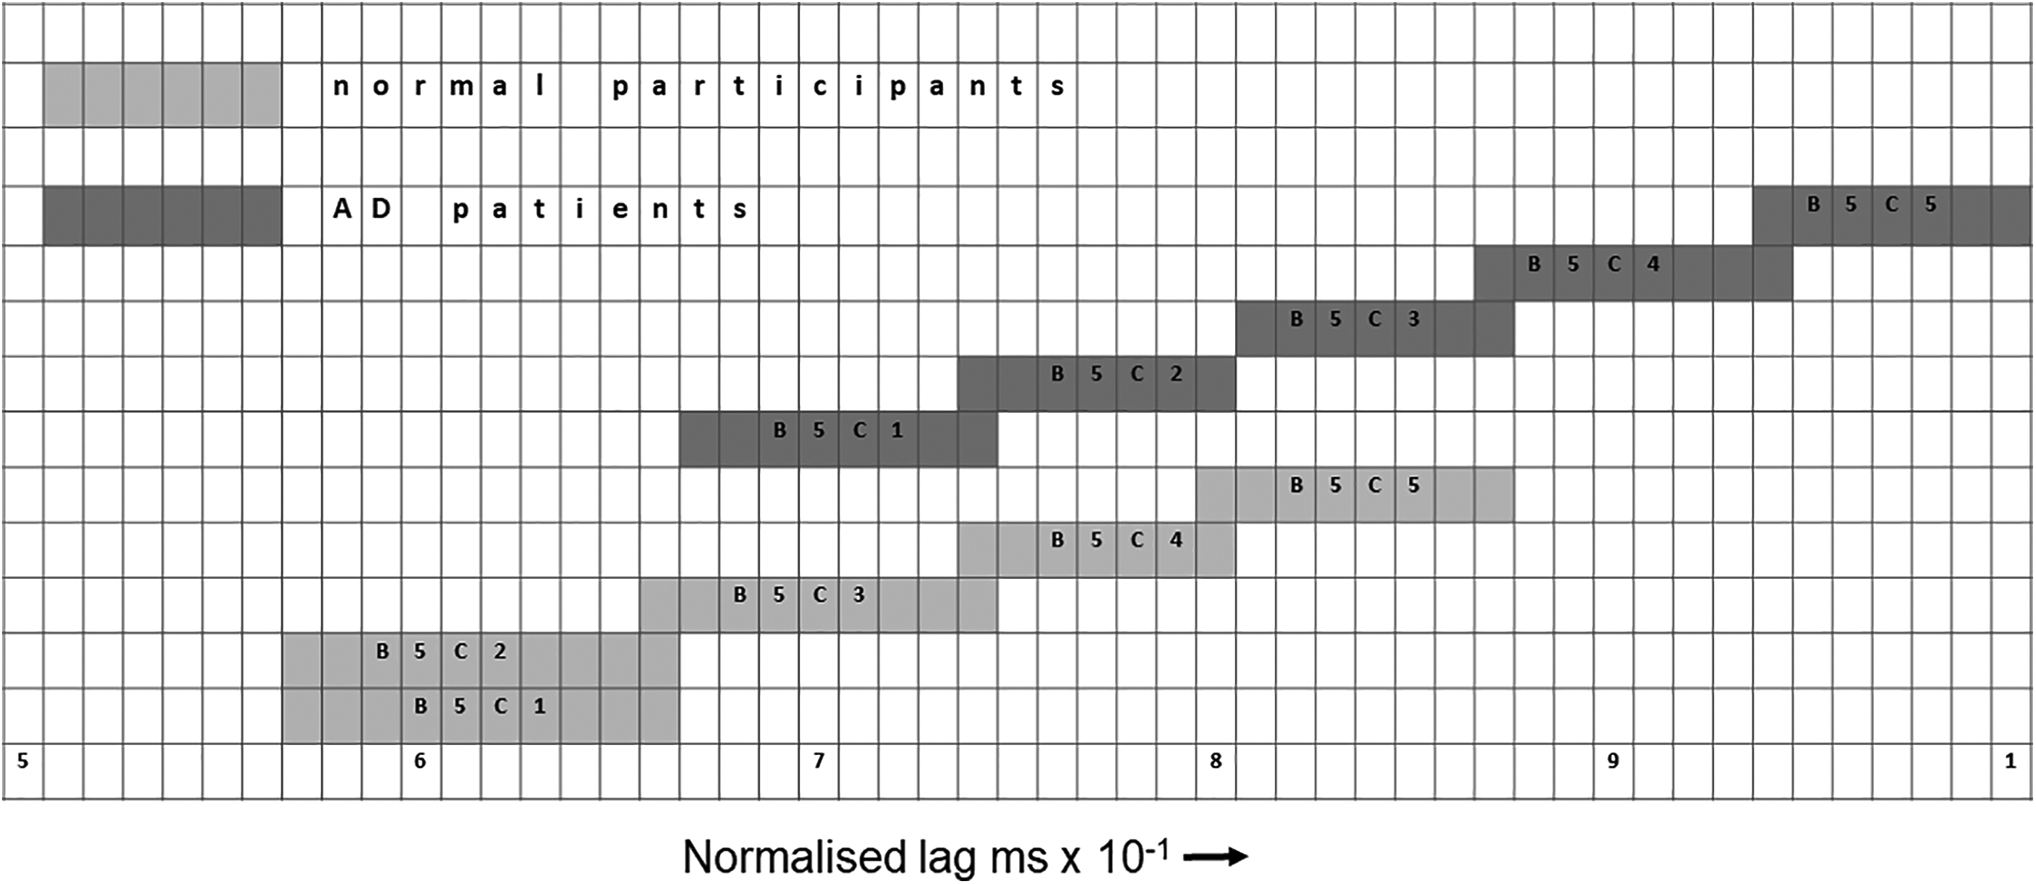
An illustration of how the B5Ci components for the patients with Alzheimer’s disease lag those of the normal participants.
Back-Projected Independent Component Amplitudes at Electrode fp2
In Figure 3, the fp2 BIC voltage histograms for all the normal participants and all the patients with AD are shown. There is clearly a difference between the 2 histograms. That for the normal participants has similarity to a skewed normal distribution (although we do not claim that it is a skewed normal distribution), while that for the patients with AD shows the BIC voltage amplitudes are mainly confined to 2 bins. Owing to the narrow width of the bins, the contents of these 2 bins may represent contributions from one source and would be in the same bin if the bin width had been chosen to be a little wider. It seems the statistical distributions of the BIC voltage at fp2 for the normal and AD participants may be quite different.

Histograms for back-projected independent component voltages fp2 for all normal participants (left) and all patients with Alzheimer’s disease (right).
In Figure 4, the histograms are plotted for some of the individual participants.
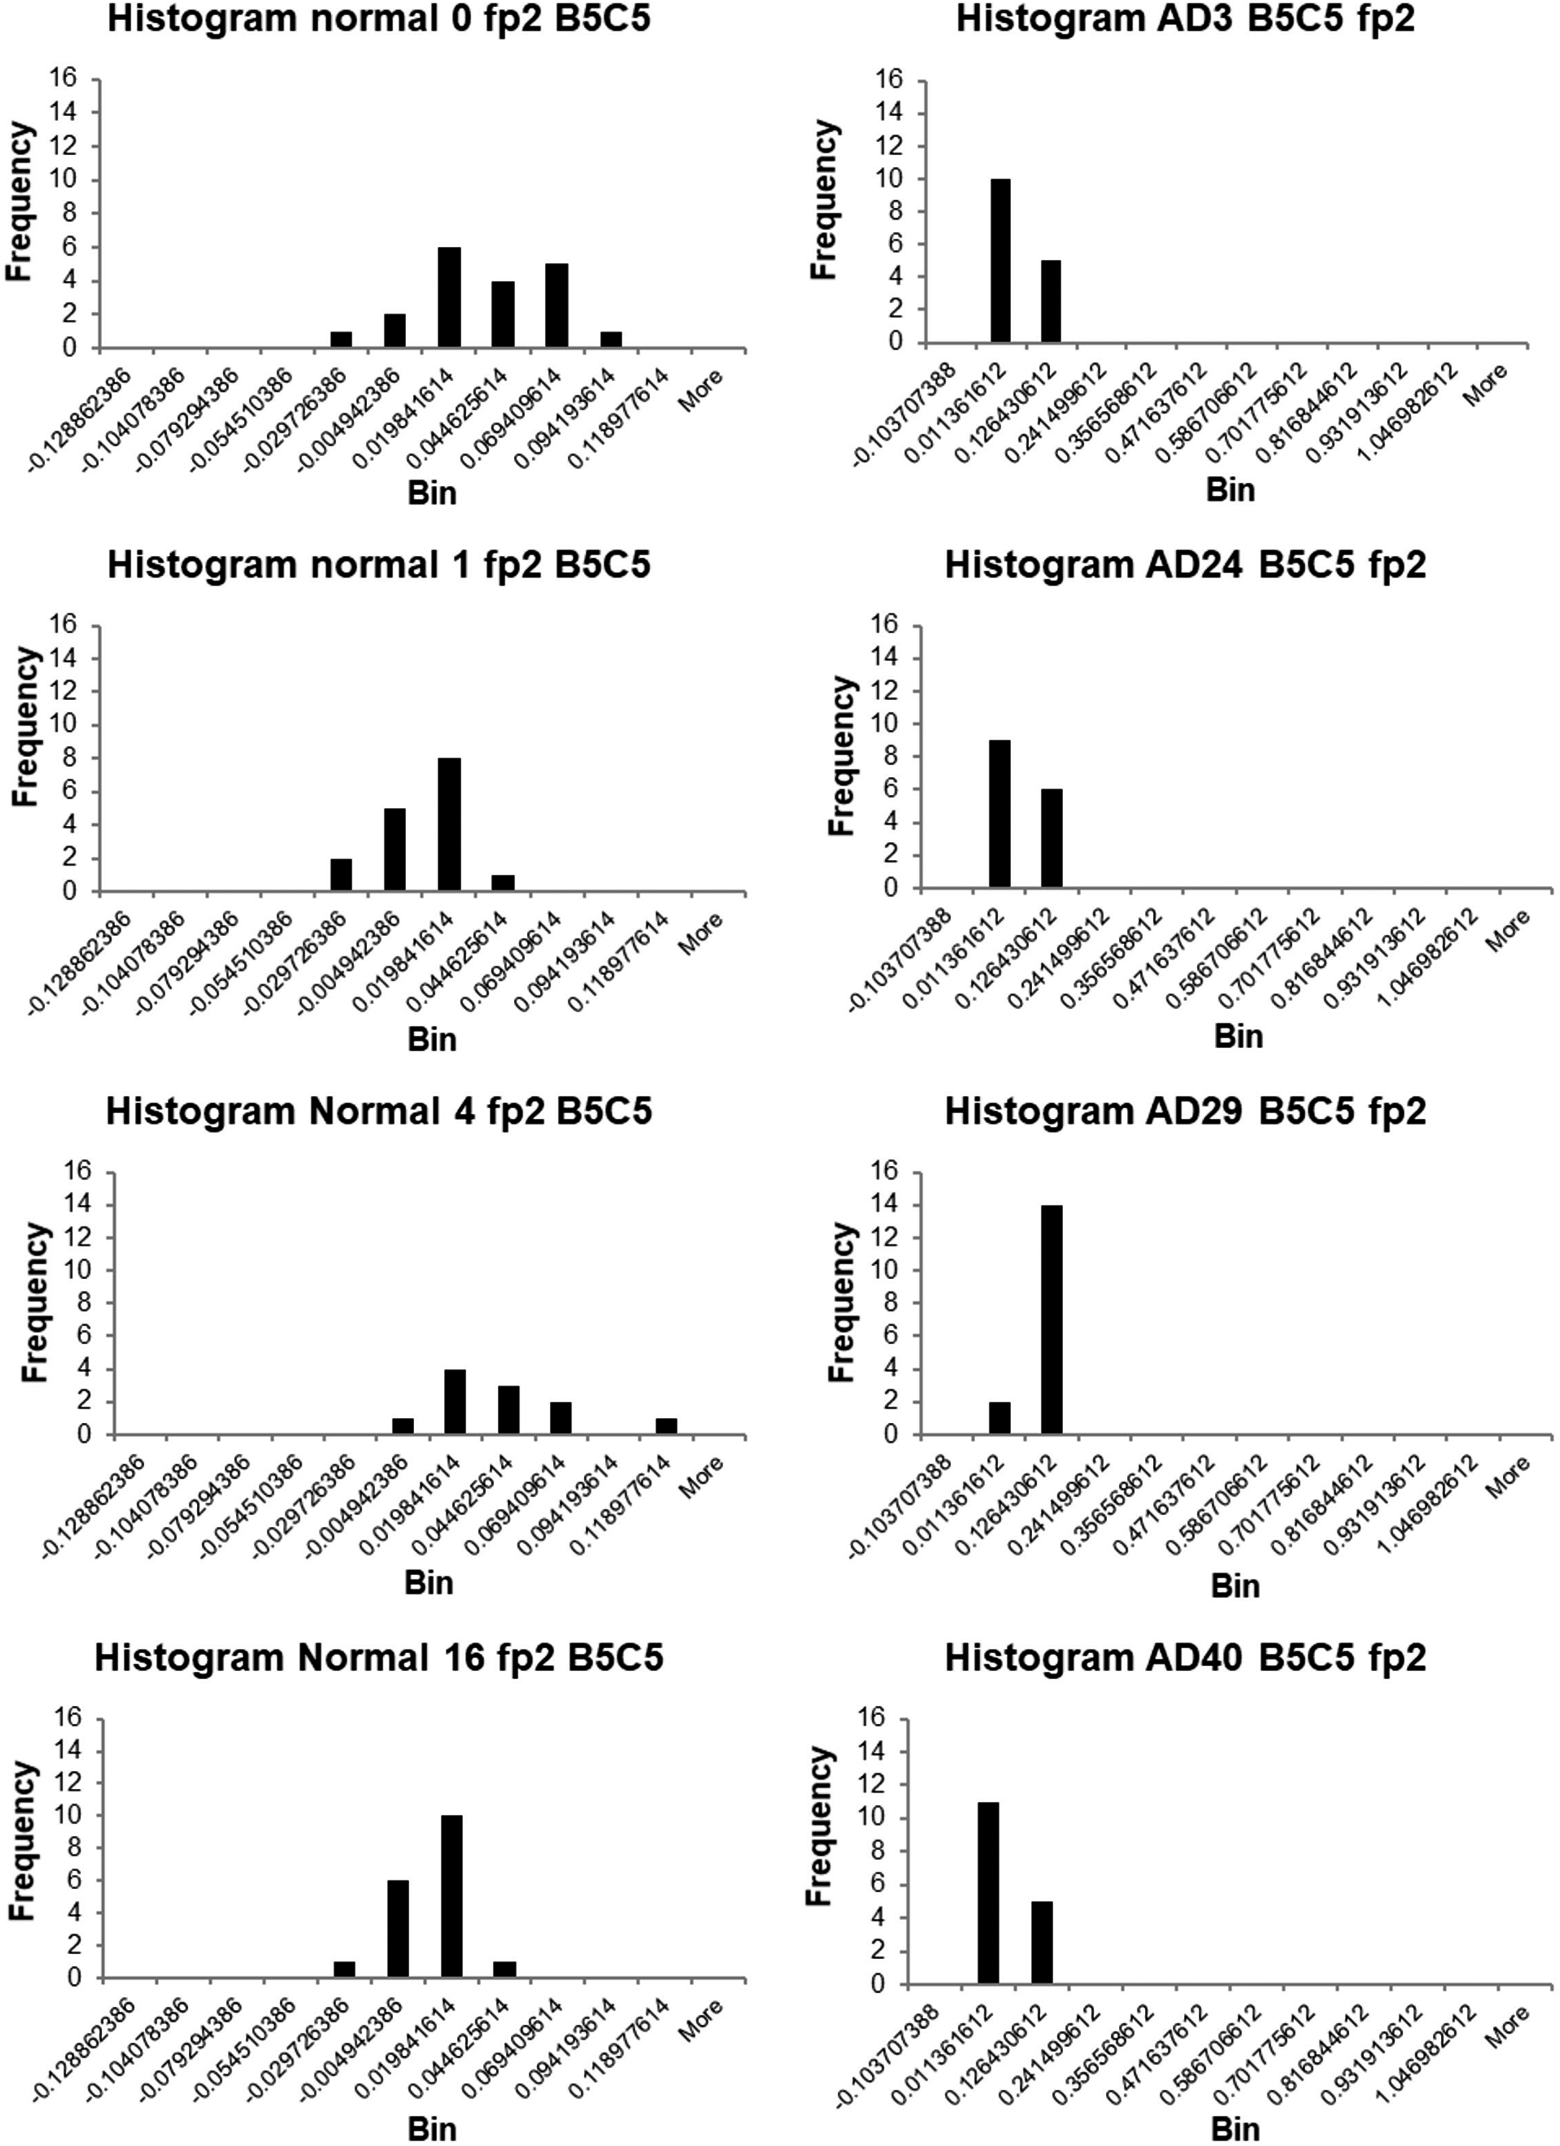
Histograms of the back-projected independent component voltages at electrode fp2 for individual normal participants (left) and individual patients with Alzheimer’s disease (right).
It is noticeable that the distributions are different for the individual normal participants and the individual patients with AD. Those for the latter consist principally of contributions centered on the same 2 (or one) bins, while those for the normal participants are wider. Inspection suggests a tendency for the BIC voltages to be larger for patients with AD than for normal participants. This accords with previous findings, including from electric dipole source modeling, that there is more frontal positivity in patients with AD. 1 It suggests that the response mechanisms in the normal participants and the AD patients differ and that the BIC voltage at fp2 might possibly offer a biomarker for AD. However, more data would be necessary to test this, both to obtain sufficient data for all participants and to test the clinical validity of the method including cases of other types of dementia or disease.
No definite conclusions could be easily drawn from the histograms for the BIC voltages at electrode P3 for the normal participants and patients with AD.
In conclusion for this section, it appears that the BIC voltage distributions of bin 5 at the frontal electrode fp2 might provide a biomarker for differentiating the patients with AD from the normal participants, but further verification and the results from more trials are required. In any case, the need for more trials would be undesirable in clinical practice.
Kolmogorov-Smirnov Tests
These goodness-of-fit tests were applied to seek a quantitative means of differentiating between the normal participants and the patients with AD and hence of identifying a biomarker for AD. They were implemented using MATLAB.
The latency test results are shown for all the BIC components in bin 5 for the normal participants in Table 2. The 0 s indicate the test identified the subject as normal; the 1 s indicate the subject is a patient with AD. The 1-sample KS test was inapplicable in 3 cases owing to insufficient data and falsely classed the remaining normal participants as patients with AD. Its use was, therefore, discontinued. The 2-sample KS test, however, classed all these normal participants correctly.
KS Test Results for Normal Participants.

Abbreviations: Av., average; Inapplic., inapplicable; KS1, 1-sample Kolmogorov-Smirnov test; KS2, 2-sample Kolmogorov-Smirnov test; Lat., latency; Subj., subject; 0, classified as normal; 1, patient with Alzheimer’s disease.
The corresponding results for the AD participants are shown in Table 3, where it is seen that the 2-sample KS test correctly identified all the patients with AD. It is concluded that this test provides 100% accurate differentiation between the normal participants and the AD patients on this data set.
KS Test Results for AD Patients.

Abbreviations: AD, Alzheimer’s disease; Av., average; Inapplic., inapplicable; KS1, 1-sample Kolmogorov-Smirnov test; KS2, 2-sample Kolmogorov-Smirnov test; Lat., latency; Subj., subject; 0, classified as normal; 1, AD patient.
It can be seen from Tables 4 and 5, which show the KS test results for all the participants based upon the BIC voltage at electrode fp2, that neither the 1-sample nor 2-sample KS tests are useful for differentiating the 2 classes on this data set. The same is true for the KS tests using the BIC voltage at electrode P3 (see Tables 6 and 7).
KS Test Results for Normal Participants Based on BIC Voltages at fp2.

Abbreviations: BIC, back-projected independent component; KS, Kolmogorov-Smirnov test; Subj, subject.
KS Test Results for Patients With AD Based on BIC Voltages at P3.

Abbreviations: AD, Alzheimer’s disease; BIC, back-projected independent component; KS, Kolmogorov-Smirnov test; Subj, subject.
KS Test Results for Normal Participants Based on BIC Voltages at P3.

Abbreviations: BIC, back-projected independent component; KS, Kolmogorov-Smirnov test; Subj, subject.
KS Test Results for Patients With AD Based on BIC Voltages at P3.

Abbreviations: AD, Alzheimer’s disease; BIC, back-projected independent component; KS, Kolmogorov-Smirnov test; Subj, subject.
In conclusion for this section, only the latency data of the BICs offer a possible biomarker for differentiating patients with AD from normal participants by applying the 2-sample KS test to its statistical distribution on this data set.
Discussion
It has been clearly demonstrated in this research that the latencies of the positive voltage BICs associated with the P300 peak may provide an excellent biomarker for new-onset AD, since 100% accurate differentiation between patients with new-onset AD and normal participants was achieved by subjecting the distribution functions of their latencies in different participants to the 2-sample KS test. This analysis method provides an alternative to the previous one 6 of analyzing the measurement data with an artificial neural network and Bayes classifier and using a voting strategy. Which is preferred? With the power and speed of modern computing, there is little to choose in this respect. While we had developed our own software for the previous method, 6 others may have to seek it in the market place or commission a good, professional programmer. Software is available for developing the KS tests from MATLAB and Excel (with add-on), and doubtless elsewhere, so this might be the easier route. However, an advantage of the neural network method lies in the requirement for only a relatively small number of patient trials, which itself may be advantageous.
It was also shown that the BIC voltages at the frontal electrode fp2 might provide another biomarker. However, even if validated, this approach would require a larger number of trials, which would be unacceptable in clinical practice.
In a review article, 13 it is claimed that changes in the progression of AD on a group basis can be tracked by the changes in the amplitudes of the P50, N100, N200, N400, and P600 peaks and the latency of the N200 peak. For individual participants, detection accuracies are quoted as at 65% to 91%, according to the specific method. For the oddball P300 test, the accuracy is 65%. Our method applies to individuals and by comparison achieved 100% accuracy. It might also be usefully applied to these other peaks.
The AD detection accuracies based on the EEG are typically up to 90%, although 100% accuracy was claimed using the EEG power density and coherence in a specific circumstance. 12 In comparison, our biomarker based on just the result of the 2-sample KS test or that of the vote in our alternative method 6 yielded 100% accuracy on our data set.
It is quite possible that our methods could indicate AD presymptomatically. This could be tested by making measurements on participants at risk of AD, such as carriers of the apolipoprotein E4 gene with a family history of AD or participants for whom synaptic dysfunction has been detected by elevated cerebrospinal fluid (CSF) phosphor-tau. 2 The technique is noninvasive, is inexpensive, and can be employed in any hospital EEG department. The neural network approach requires a reduced number of trials. Because of the small sample size, validation requires that far more participants be tested and preferably in multicenter studies. The digitized multicenter recordings could be processed centrally to ensure conformity. This validation could take place during the clinical studies. Such studies might also be used to investigate the effects of drug treatment, the comparison of the results to those of similar studies on participants with other dementias and neurological diseases to reduce the risk of misdiagnosis, and the possible usefulness of the BICs associated with other peaks in the waveform. Extension to other conditions such as Parkinson disease and other evoked potentials is also a possibility.
However, there are 2 hindrances to further validation and application of our methods, which are common to all EEG or evoked potential methods. First, the different worldwide and intercountry health authorities have different regulations about permitting research projects and the introduction of new techniques. This is over and above the requirements for ethical approval. For example, while research projects can be set up in the United Kingdom, in some European countries, it is very difficult to obtain permission. This makes it difficult to establish international multicenter cooperation to validate new methods. Second, it has been pointed out that current international guidelines do not endorse the use of EEG biomarkers in clinical trials performed on patients with AD. 12 The Alzheimer’s Association International Society to Advance Alzheimer’s Research and Treatment considers there is ample evidence of the usefulness of EEG and evoked potential biomarkers to justify changing the international guidelines in favor of their use.
Conclusions
Patients with new-onset AD were differentiated from normal participants to 100% accuracy by testing the statistical distribution functions of the latencies of the positive voltage, back-projected, ICs centered on the P300 waveform peak response to an oddball, auditory evoked potential task using the 2-sample KS test at the 95% confidence limit. Thus, this test may constitute a biomarker for AD. Another possible biomarker may be the shape of the histogram of the BIC amplitudes at the frontal electrode fp2 for patients with AD. This method might be implemented relatively easily, but our alternative method using a neural network 6 requires fewer trials. It may also be possible to detect AD presymptomatically, but more preferably multicenter research on more participants, including those with other dementias and diseases, is necessary to validate the technique. Extension to other conditions and evoked potentials is a possibility. International guidelines should be changed to allow the use of EEG and evoked potential methods to be used in clinical trials with patients with AD.
Footnotes
Acknowledgement
The authors wish to thank Dr. A. J. Jervis for producing the final version of the figures.
Declaration of Conflicting Interests
The authors declared no potential conflicts of interest with respect to the research, authorship, and/or publication of this article.
Funding
The authors received no financial support for the research, authorship, and/or publication of this article.