
Abstract
Introduction:
This study evaluates the burden of multimorbidity (MM) across gradients of cognitive impairment (CI).
Methods:
Using data from the 2010 Health and Retirement Study, we identified individuals with no CI, mild CI, and moderate/severe CI. In addition, we adopted an expansive definition of complex MM by accounting for the occurrence and co-occurrence of chronic conditions, functional limitations, and geriatric syndromes.
Results:
In a sample of 18 913 participants (weighted n = 87.5 million), 1.93% and 1.84% presented with mild and moderate/severe CI, respectively. The prevalence of most conditions constituting complex MM increased markedly across the spectrum of CI. Further, the percentage of individuals presenting with 10 or more conditions was 19.9%, 39.3%, and 71.3% among those with no CI, mild CI, and moderate/severe CI, respectively.
Discussion:
Greater CI is strongly associated with increased burden of complex MM. Detailed characterization of MM across CI gradients will help identify opportunities for health care improvement.
Keywords
Introduction
In the United States, nearly 14% of adults aged 71 years or older have dementia, 1 and in this population, the prevalence of cognitive impairment (CI) without dementia has been estimated to be at 22.2%. 2 With the aging of the population in the United States, the number of older adults with CI is expected to increase. 3,4
Previous studies have documented increased mortality associated with both mild CI 5,6 and moderate/severe CI. 6,7 However, little is known about the morbidity burden borne by older adults with CI. While persons with CI are as likely as those without CI to present with complex health care needs, rarely have studies analyzed older individuals’ morbidity profile across gradients of CI. 8 Yet, a detailed examination of the specific conditions that increase in prevalence with greater levels of CI would enhance efforts to develop interventions to reduce disease burden that are adapted to gradients of CI. Thus, studies of this nature could pave the way for the development of personalized health care and end-of-life care for individuals with CI. 9 Such studies are all the more important, given that chronic conditions often present as part of multimorbidity (MM)—a constellation of chronic conditions, functional limitations, and geriatric syndromes that we call complex MM. 10
In order to better inform the development of interventions to manage these individuals’ care and improve their quality of life, it is essential to analyze the MM profile of older adults across gradients of CI in a more comprehensive fashion, rather than focusing on co-occurring chronic conditions alone.
Using data on a US representative sample of older adults, this study aims to characterize older individuals’ MM profile across gradients of CI by examining the prevalence of chronic conditions, functional limitations, and geriatric syndromes and the co-occurrence thereof.
Methods
Our study analyzes data from the 2010 to 2012 Health and Retirement Study (HRS). Since it was limited to the use of publicly available data from the HRS, the study was deemed exempt by the institutional review board of Case Western Reserve University.
Data Source
The HRS is the largest longitudinal study of a US representative sample of older adults aged 50 years or older (n ∼ 30 000). Launched in 1992, the HRS collects a rich array of data from its participants every 2 years, including—but not limited to—income, chronic conditions, functional limitations, geriatric syndromes, and behavioral factors. These conditions are self-reported by 95% of respondents and reported by proxy respondents for the remaining 5% who are unable to respond to the survey.
Study Population
Our study included all participants in the 2010 HRS (n = 20 566). We excluded 1357 people who were dead at baseline (ie, an exit interview conducted by spouse or next of kin). We also excluded 193 people with missing values for CI, 118 who had missing values for any other covariate, and an additional 376 people with a nonpositive sampling weight—meaning that the survey weight for these respondents was negative or missing, leading to the omission of these observations from the analysis. To obtain data on 2-year self-reported worse health and 2-year mortality, we also excluded those who were lost to follow-up by 2012 (6.9%), leaving the study population at 18 913 respondents. The total weighted population—that is, the representative HRS sample extrapolated to the entire US population of adults aged 50 years or older—was 87 478 731.
Variables of Interest
Variables of interest included CI and conditions constituting MM. Cognitive status was assessed using a modified version of the 35-item Telephone Interview Cognitive Status (TICS) 11 developed by Brandt et al. 12 The scale is based on the following items (with total possible points): immediate 10-word recall (10), delayed 10-word recall (10), serial-7 subtraction test (5), counting backward test (2), object naming test (2), recall of the day of the week and the date (4), and naming the president and the vice president (2). Consistent with previous studies by Langa et al, 13,14 respondents were grouped in the categories of no CI (score of 11 or higher), mild CI (score of 8-10), or moderate/severe CI (score of 7 or lower).
When HRS participants were unable to respond, proxy respondents were asked the following questions: (1) “How would you rate [the respondent’s] memory at the present time?” and (2) “How would you rate [the respondent] in making judgments and decisions?” Participants whose memory was assessed as “excellent,” “very good,” or “good” were categorized as no CI, and those whose memory was assessed as “fair” or “poor” were categorized as CI. Those categorized as CI were grouped in the category of mild CI if their judgment was assessed as “excellent,” “very good,” or “good” and in the category of moderate/severe CI if judgment was assessed as “fair” or “poor.” 13
Our complex MM variable was coded as a 4-point composite measure ranging from MM0 to MM3, depending on the occurrence or co-occurrence of self- or proxy-reported chronic conditions, functional limitations, and/or geriatric syndromes. We grouped respondents in the MM0 category if they had no chronic conditions, functional limitations, or geriatric syndromes; in MM1 if they had the occurrence (but no co-occurrence) of chronic conditions, functional limitations, or geriatric syndromes; MM2 if they had co-occurrence of any 2 of chronic conditions, functional limitations, or geriatric syndromes; and MM3 if they had co-occurrence of chronic conditions, functional limitations, and geriatric syndromes. Thus, for example, if an individual reported more than 1 chronic condition but no functional limitations or geriatric syndromes, she or he was coded as MM1. On the other hand, an individual with 1 chronic condition but co-occurring functional limitations and geriatric syndromes was coded as MM3.
Chronic conditions included hypertension, arthritis, heart disease, lung disease, diabetes, stroke, cancer, and psychiatric conditions. We flagged a chronic condition to be “severe” if the respondent reported being on active treatment for that condition, and “mild” otherwise. Functional limitations included limitations in upper and lower body function and strength, activities of daily living (ADLs), and/or instrumental activities of daily living (IADLs). Geriatric syndromes included depressive symptoms (4 or more symptoms from the Center for Epidemiological Studies–Depression scale), urinary incontinence, vision impairment (poor vision even after wearing corrective eyewear as usual), hearing impairment (poor hearing even after using hearing aid as usual), severe pain, persistent dizziness, and falls. Questions pertaining to falls were asked of HRS participants aged 65 years or older.
We also examined self- or proxy-reported health status as excellent, very good, good, fair, or poor; self- or proxy-reported worse health in 2 years (yes/no); as well as the count of chronic conditions, functional limitations, and geriatric syndromes with which individuals presented (e.g., a count of 5 for individuals presenting with hypertension, heart disease, strength limitations, incontinence, and depressive symptoms).
Additional variables included age (grouped in 5-year increments, 50-54, 55-59, 60-64, 65-69, 70-74, 75-79, 80-84, and 85+), sex (male or female), race/ethnicity (non-Hispanic white, non-Hispanic black, Hispanic, and other), marital status (married, divorced, widowed, and never married), income as a percentage of the Federal Poverty Level (<100%, 100%-199%, 200%-299%, and ≥300%), and education, in years (<9, 9-12, 13, 14-16, and 17+). Behavioral factors included smoking status (never smoked, current smoker, and former smoker), alcohol consumption based on average number of drinks consumed per day (none [0], moderate [1-2], heavy [≥3]), vigorous exercise (yes/no, indicated by taking part in vigorous exercise or sports at least once a week), and body mass index (BMI in kg/m2, grouped as underweight for BMI ≤18, normal/overweight for BMI 19-30, obese for BMI >30, and missing).
Analysis
In addition to descriptive analysis reporting the weighted percentage (and 95% confidence interval) of individuals with various sociodemographic characteristics and components of MM across CI levels, we reported the count of conditions with which individuals presented by CI gradient. We also conducted multivariable logistic regression analysis to evaluate the independent association between gradients of CI and each of MM, limitations in ADLs and IADLs, sensory impairment, and 2-year mortality.
We used survey weights to account for the complex stratified sampling strategy in the HRS. SAS version 9.4 (Cary, North Carolina) was used in all of our analyses.
Results
Our weighted sample of 18 913 reflects 87.5 million individuals aged 50 years or older. Of those, 1.93% (approximately 1.7 million) were identified with mild CI and 1.84% (approximately 1.6 million) with moderate/severe CI. The demographic and socioeconomic measures varied markedly across the CI gradients (Table 1). Compared to individuals with no CI (4.5%, 95% confidence interval, 4.0-4.9), a considerably greater percentage of individuals with mild or moderate/severe CI were 85 years or older (19.9 [15.4-24.5] and 35.6 [30.5-40.6], respectively). We also found a larger proportion of racial/ethnic minority individuals in the mild and moderate/severe CI groups, compared to the group with no CI. Under 6% (5.7 [4.7-6.7]) of those with no CI had less than 9 years of education, compared to 28.1% (22.5-33.6) among those with mild CI and 24.7% (19.1-30.2) among those with moderate/severe CI. Conversely, nearly 60% (59.9 [58.1-61.8]) of those with no CI had incomes exceeding 300% of the Federal Poverty Level, compared to 41.5% (35.6, 47.5) of those with mild CI and 38.7% (32.6, 44.8) of those with moderate/severe CI.
Sociodemographic Characteristics and Health Outcomes Among HRS Respondents by Level of Cognitive Impairment.
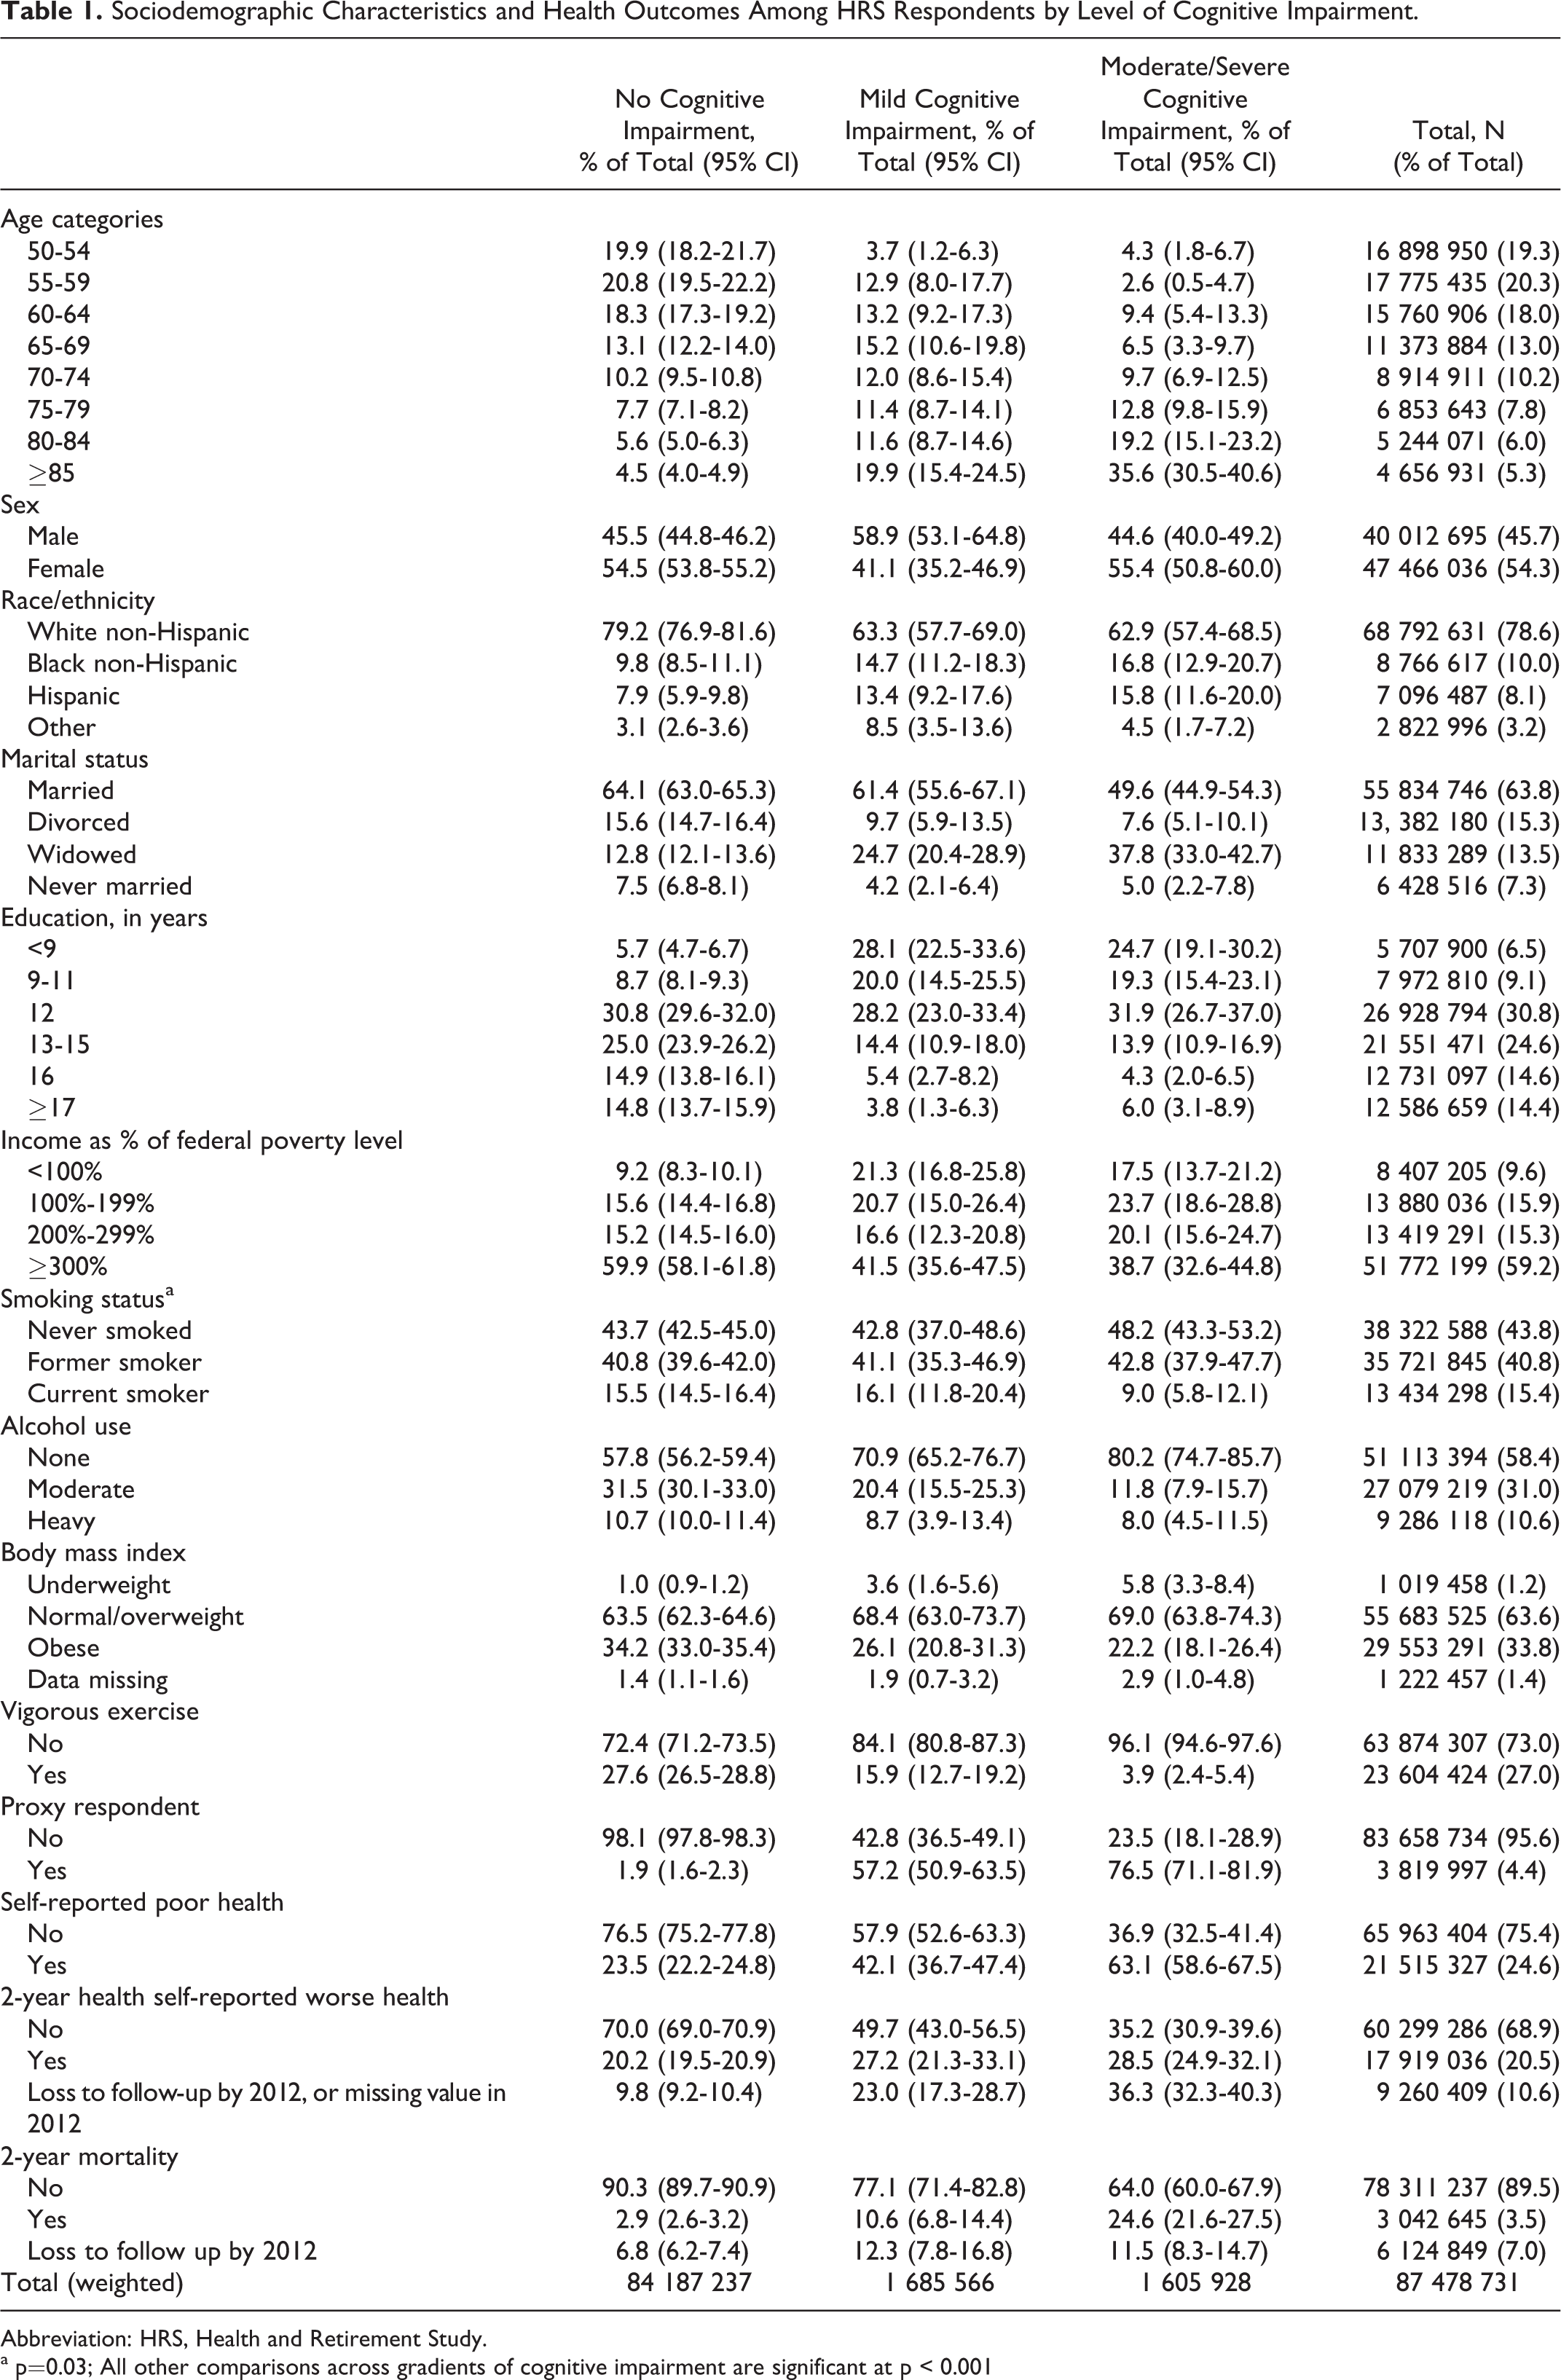
Abbreviation: HRS, Health and Retirement Study.
a p=0.03; All other comparisons across gradients of cognitive impairment are significant at p < 0.001
The most striking differences by gradients in CI were observed in self- or proxy-reported health status: The percentage of individuals with fair/poor health was 23.5% (22.2-24.8) among those with no CI, 42.1% (36.7-47.4) among those with mild CI, and 63.1% (58.6-67.5) among those with moderate/severe CI. Similarly, 2-year mortality increased from 2.9% (2.6-3.2) among those with no CI to 10.6% (6.8-14.4) and 24.6% (21.6-27.5) among those with mild CI and moderate/severe CI, respectively.
The MM profiles by CI gradient are presented in Table 2. With regard to chronic conditions, the most significant increase occurred for mild heart disease, from 17.0% (16.2-17.9) in individuals with no CI to 28.2% (22.5-33.9) and 39.0% (33.0-45.0) in individuals with mild or moderate/severe CI, respectively. Similarly, the percentage of individuals with severe stroke increased from 2.2% (1.9-2.5) to 5.3% (3.3-7.4) and 13.8% (9.6-18.0) across the gradients of CI, respectively.
Prevalence of Chronic Conditions, Functional Limitations, and Geriatric Syndromes Across Gradients of Cognitive Status.
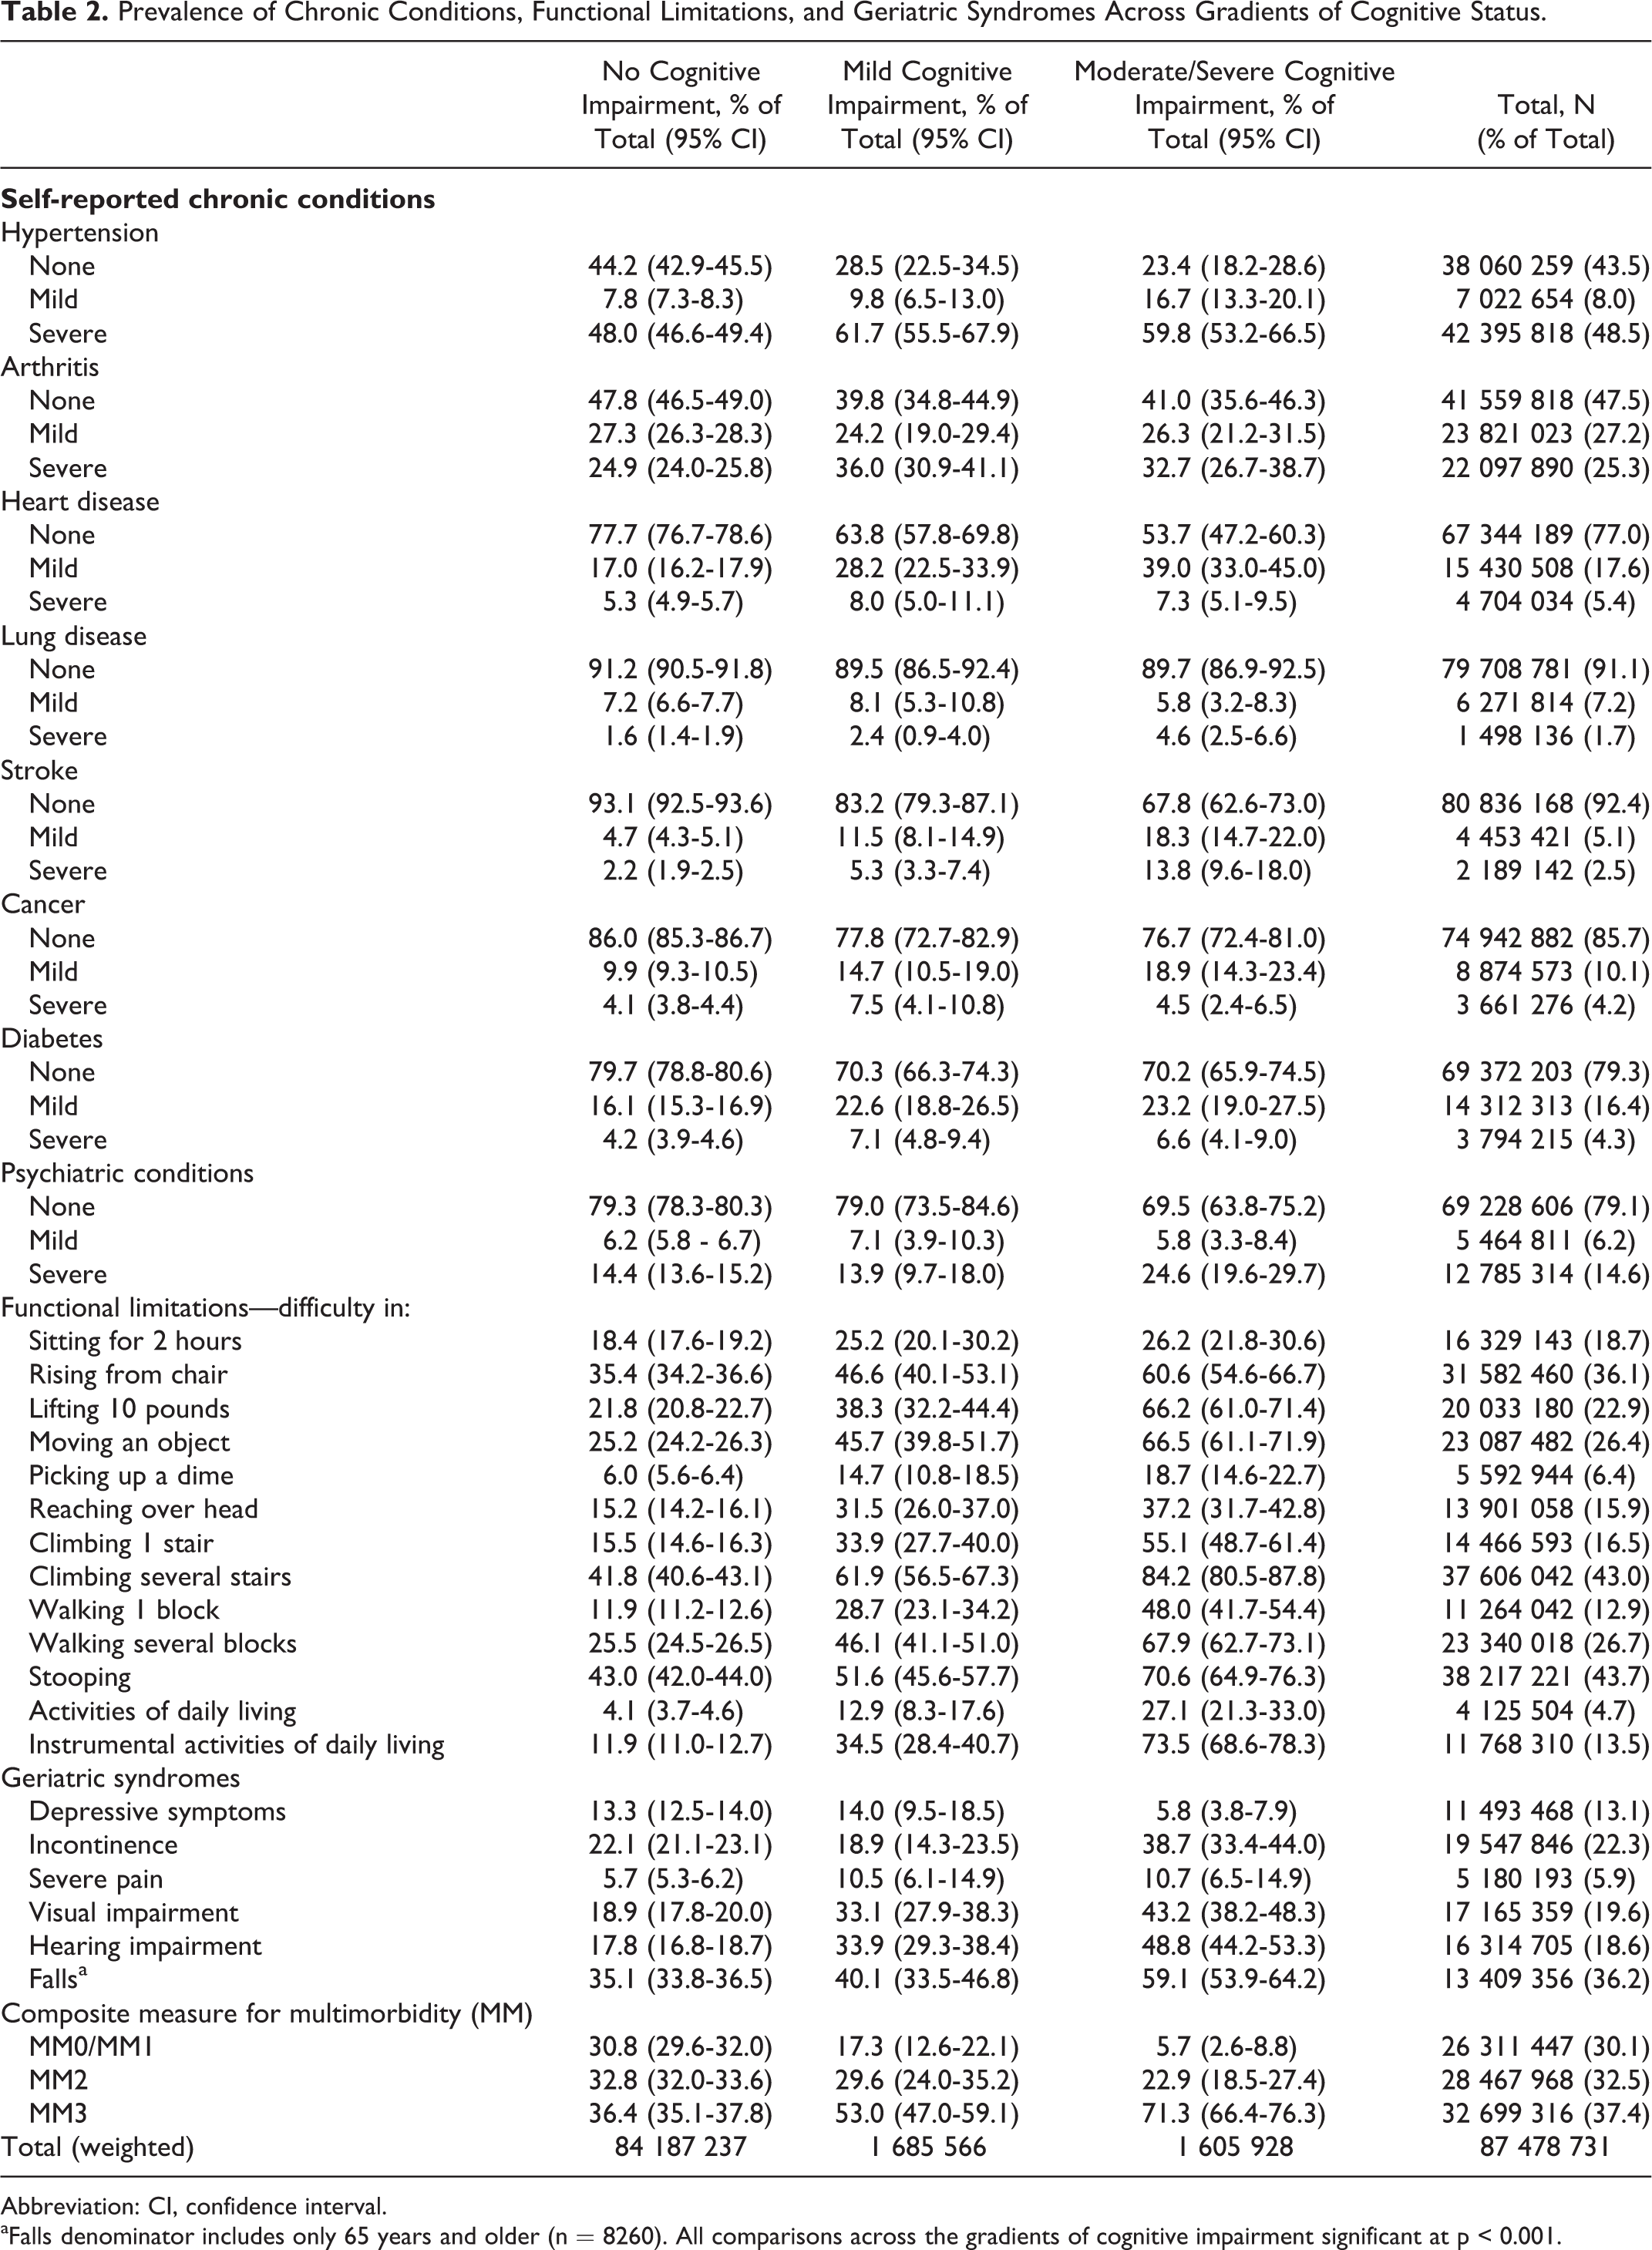
Abbreviation: CI, confidence interval.
aFalls denominator includes only 65 years and older (n = 8260). All comparisons across the gradients of cognitive impairment significant at p < 0.001.
Relative to functional limitations, we observed marked increases in the percentage of individuals presenting with limitations for each of the specific functions as well as for ADLs (4.1% [3.7-4.6], 12.9% [8.3-17.9], and 27.1% [21.3-33.0] across the CI gradients, respectively) and for IADLs (11.9% [11.0-12.7], 34.5% [28.4-40.7], and 73.5% [68.6-48.3]).
Regarding geriatric syndromes, we found increased prevalence of urinary incontinence among those with moderate/severe CI (38.7% [33.4-44.0]), with no difference in prevalence between individuals with no CI and those with mild CI. We also note the marked increase, both across no CI and mild CI groups and across mild CI and moderate/severe CI groups, in the percentage of individuals presenting with visual and hearing impairment as well as in falls, the latter being reported only in individuals aged 65 years or older.
The percentage of individuals presenting with MM3, reflecting the co-occurrence of chronic conditions, functional limitations, and geriatric syndromes, increased from 36.4% (35.1-37.8) among individuals with no CI to 53.0% (47.0-59.1) and 71.3% (66.4-76.3) among those with mild and moderate/severe CI, respectively.
Table 3 shows the distribution of individuals across CI gradients by the combined number of individual chronic conditions, functional limitations, and geriatric syndromes reported (as listed in Table 2). The percentage of individuals with totals of 10 or more was 19.9% (18.9-21.0) among those with no CI, 39.3% (32.7-45.9) among those with mild CI, and 71.3% (65.3-77.2) among those with moderate/severe CI.
Distribution of the Weighted Study Population Across Cognitive Impairment Gradients by the Combined Number of Individual Chronic Conditions, Functional Limitations, and Geriatric Syndromes Reported.
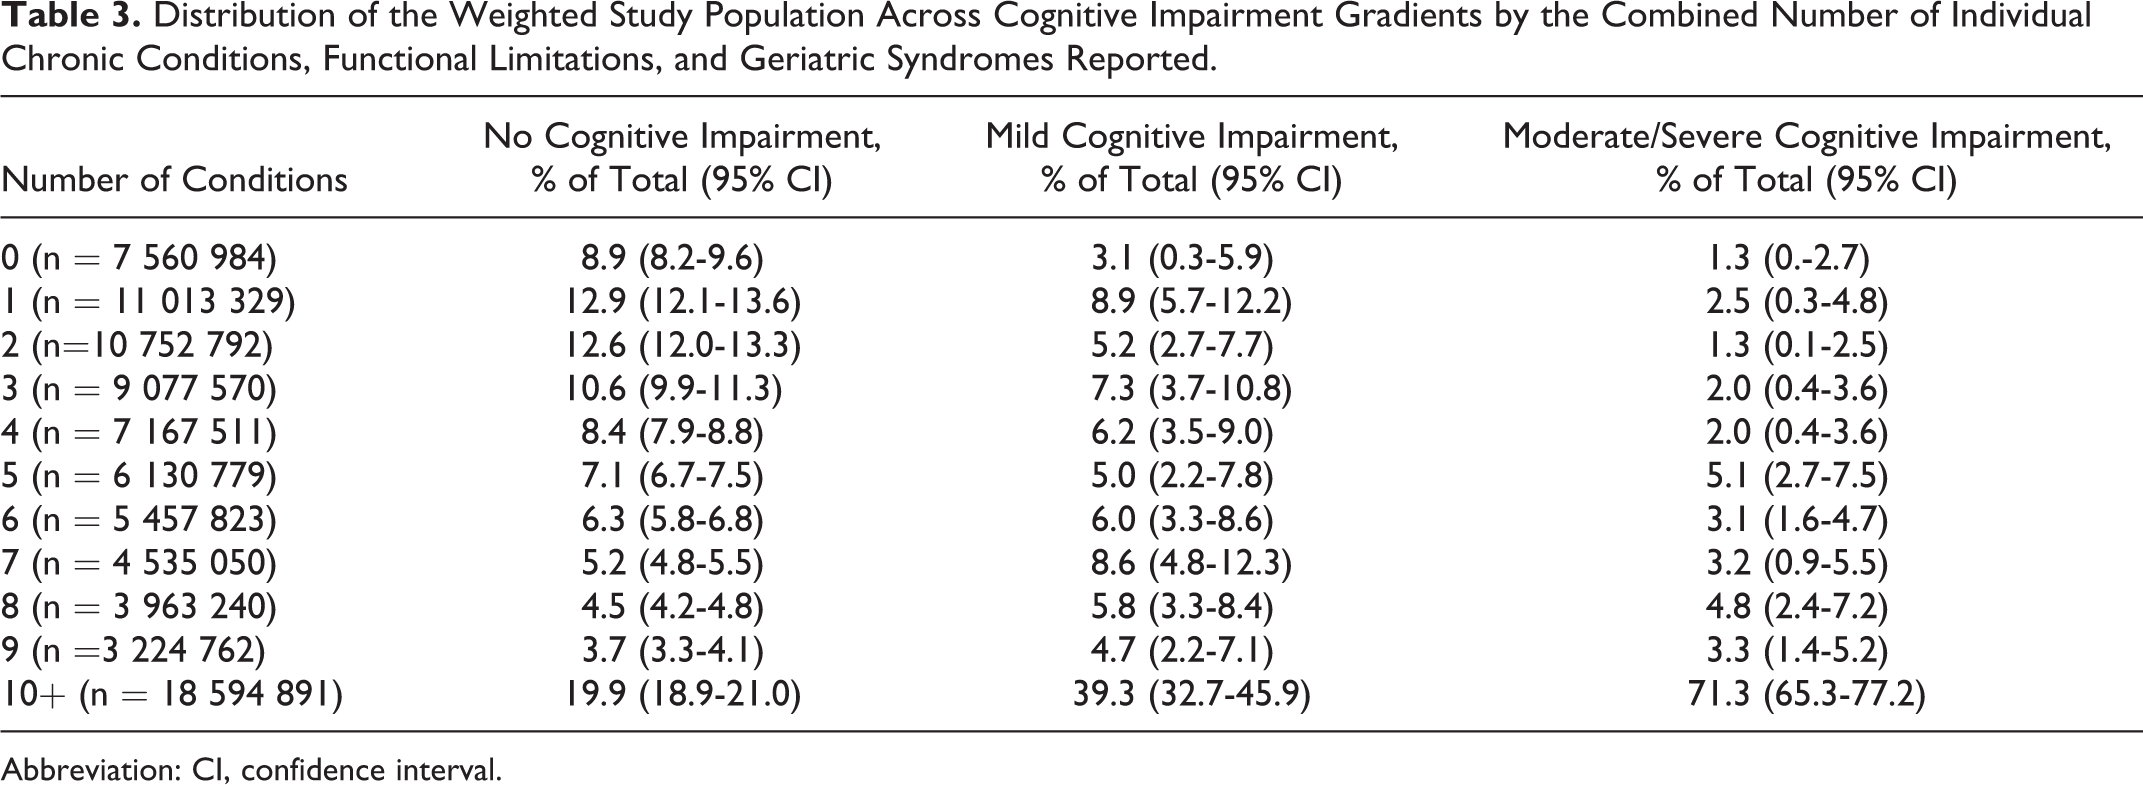
Abbreviation: CI, confidence interval.
Table 4 presents the results from multivariable regression analyses to evaluate the independent association between gradients of CI and each of MM, limitations in ADLs and IADLs, visual and hearing impairment, and 2-year mortality. We observed a dose–response association between greater CI and each of limitations in IADLs and 2-year mortality. Compared to individuals with no CI, those with mild CI had 2.3 higher odds of having limitations in IADLs (adjusted odds ratio [AOR]: 2.30, 95% confidence interval [1.67-3.17]) and those with moderate/severe CI had nearly 15 times higher odds to have such limitations (14.96 [11.33-19.77]). Similarly, compared to cognitively intact individuals, those with mild or moderate/severe CI had nearly twice and 4 times higher odds to die in the next 2 years (AOR: 1.82 [1.15-2.88] and 4.05 [3.17-5.18], respectively). For limitations in ADLs, despite its dose–response association with CI gradients, the AOR for mild CI was only borderline statistically significant (1.59 [1.00-2.54], P = .0519), while the AOR for mild/moderate CI was strong and highly significant (3.66 [2.49-5.37]). As for MM3 and sensory impairment, their association with mild CI did not reach statistical significance; however moderate/severe CI was positively and significantly associated with these outcomes.
Independent Association Between Gradients of Cognitive Impairment and Each of Multimorbidity, Limitations in ADLs and IADLs, Sensory Impairment, and 2-Year Mortality.
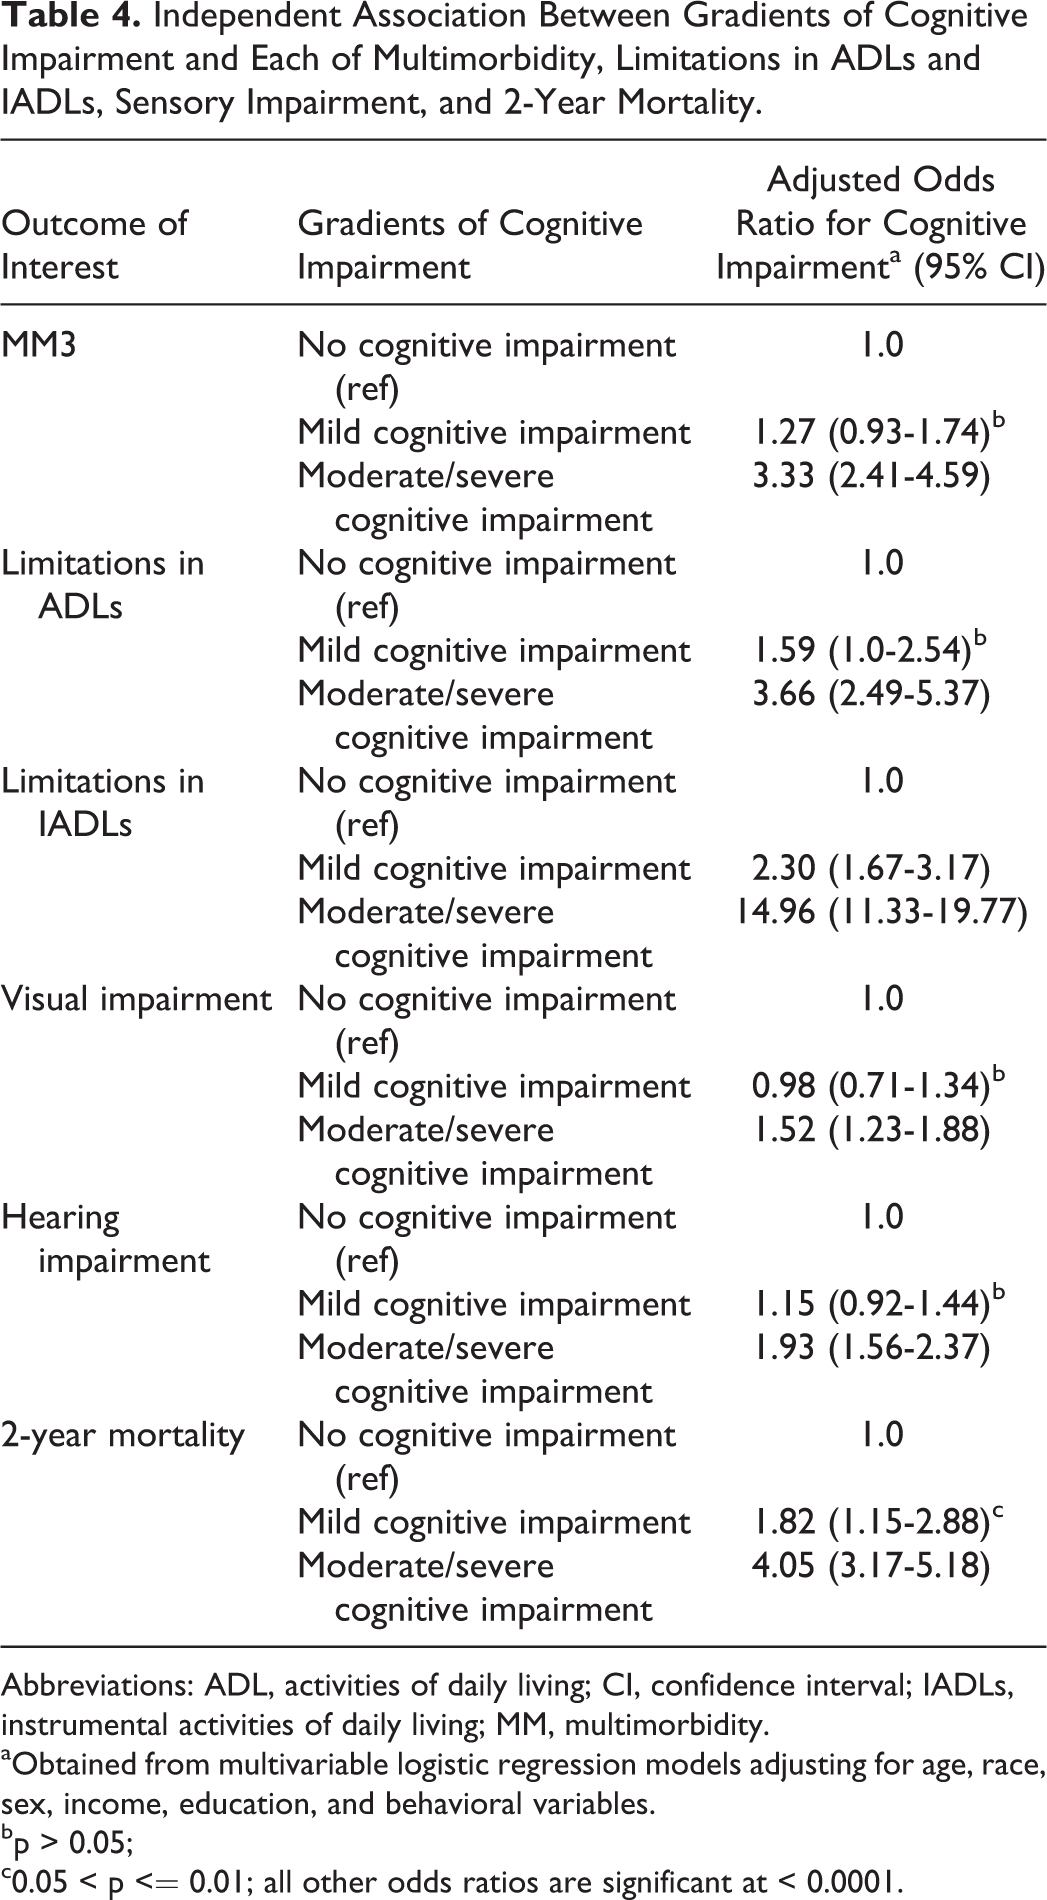
Abbreviations: ADL, activities of daily living; CI, confidence interval; IADLs, instrumental activities of daily living; MM, multimorbidity.
aObtained from multivariable logistic regression models adjusting for age, race, sex, income, education, and behavioral variables.
bp > 0.05;
c0.05 < p <= 0.01; all other odds ratios are significant at < 0.0001.
Discussion
In this study of a US representative sample of older adults, we described the highly complex clinical presentation of individuals with CI and demonstrated a strong dose–response pattern of increased MM burden and mortality across gradients of CI: The greater the level of CI, the higher the complex MM burden and mortality.
These findings highlight the great challenge posed by CI for clinical management, especially for primary care clinicians 15 facing pressures for “productivity” measured as relative value units or patients seen per day, 16 when what is needed to integrate, personalize, and prioritize care 17 for people with complex MM 18 is time 19 and support for coordination of care across multiple health-care professionals and with community resources. 15,20 -22
Increased MM is also associated with decreased continuity of care, increased hospitalizations, more frequent visits to the emergency department, and higher expenditures, 23 posing significant challenges to the health-care system. According to the Alzheimer’s Association Facts and Figures, 24 the costs paid by Medicare and Medicaid are estimated at US$67 billion in 2017, while more than 15 million Americans provided unpaid care for people with Alzheimer’s or other dementias in 2016, accounting for 18.2 billion hours of care and US$230 billion (www.alz.org/facts).
The systems challenges posed by the findings of this research are substantial. The current system fosters fragmentation. 25,26 Too often, we consider diseases as existing alone. We call for a “dementia strategy” or “integrated stroke care.” We build “memory clinics,” which deal with the “dementia” bit but leave the rest of the problems to other clinicians. In contrast, the research results presented here highlight that dementia is a keystone disorder. Chronic disease management and self-care are very difficult in the presence of CI. But these data show that this conundrum is amplified by the burden of comorbidity and geriatric syndromes—by complex MM. 10 The findings of this research argue for systems support for stronger relationships between primary care, specialists (particularly geriatricians), and community resources to proactively realign services to integrate care, foster function, and, when appropriate, to take a more palliative approach. Fortunately, a growing body of research shows how care can be realigned through team approaches that integrate care 27 -29 in ways that result in improved patient and system outcomes. 30,31
We note that our findings may have different implications for individuals with mild versus moderate/severe CI. For those with mild CI, our findings call for close attention to their physical health-care needs, particularly with the intent to preempt physical decline and improve quality of life. In parallel, neuropsychiatric assessment should be a routine part of the diagnostic workup for patients with chronic illnesses (eg, as recommended by others in the case of chronic obstructive pulmonary disease 32 ).
Effective care plans rely on individualized needs assessments that are developed with input from the primary care physician 33 and in coordination with the caregiver or home care provider. Aimed at maximizing independence, these assessments are revised periodically to accommodate the person’s needs, which might change with decline in his or her cognitive functioning. 34 Care plans must ensure that the person can walk, transfer, and perform daily tasks safely, whether by modifying the physical environment or by using adaptive equipment. 34 Finally, care plans should incorporate access to assistance and advice 24/7, 365 days a year. 33
For individuals with moderate/severe CI who are significantly more likely to experience short-term mortality, these findings highlight the needs for palliative care, 35,36 aimed more at ensuring comfort and addressing psychosocial and spiritual needs rather than prolonging life. 36 However, this may prove to be challenging, given that individuals dying with advanced dementia may not be perceived as having a terminal illness, as has been found to be the case with nursing home residents. 37
The findings also highlight the increased burden to family caregivers resulting from MM as CI progresses. Although the burden of caring for family members associated with their CI has been well documented, 38 -41 studies are increasingly examining the incremental burden associated with providing care for chronic conditions in persons with CI. 42,43 There are also implications for institutional care settings in terms of staffing numbers and expertise required to deal with increasing MM in those with advanced CI.
To our knowledge, this is the first study to document increased MM burden in individuals with higher levels of CI and the first to use an expanded definition of complex MM, 10,44 -47 extending beyond chronic conditions and incorporating functional limitations and geriatric syndromes. However, even limiting the definition of MM to chronic conditions, a recent study from Canada reported that MM was the norm, rather than the exception in community-dwelling individuals with dementia receiving home care services. 48
The percentage of HRS respondents with mild or moderate/severe CI in our study (1.9% and 1.8%, respectively) is considerably lower than that reported by Langa et al (3.5% and 5.2%). 13 This discrepancy can be explained by the different HRS study years (2010 vs 2002) as well as the age range of the study population (≥50 years vs ≥70 years of age, respectively). In fact, when using the data from Table 1 to derive the percentage of respondents with mild or moderate/severe CI among those aged 70 years or older, we obtain 3.6% and 4.8%, respectively.
Our findings should be interpreted in light of the following study limitations. First, because of the 2-year follow-up of this study with conditions and CI assessed at baseline, we were unable to establish temporality between some of the conditions of interest and more severe CI. For example, it is important to determine whether cognitive decline occurs as a result of a condition such as stroke, since the percentage of individuals with stroke increases markedly across the gradients of CI. Similarly, it is important to examine the emergence of new chronic conditions as CI worsens. For example, because of shared pathophysiology, disease–disease or drug–disease interactions, and poor self-management of existing conditions—especially among those with mild CI—new conditions may emerge, increasing MM burden (eg, poorly managed diabetes leading to cardiovascular disease). Findings from recent studies highlight the bidirectional nature of the association between CI and MM, showing longitudinal changes in cognitive function and accelerated deterioration in physical health, defined as the faster accumulation of MM over time. 49,50 Second, our study does not account for the care received by individuals with CI for the various conditions. The management of complex chronic conditions is especially important in individuals with mild CI, so they can enjoy a relatively good quality of life, despite their compromised cognitive status. Finally, as noted by Langa et al, 13 our measures of mild or moderate/severe CI, which are based on cut-points in the TICS score, reflect cognitive functioning, rather than a clinical diagnosis of dementia. These cut-points were determined based on how well they correlated with ADLs and IADLs, informal caregiving, and the likelihood of being admitted to a nursing home.
In conclusion, in spite of study limitations, our findings document substantial increases in MM across CI gradients. They suggest the need for person-centered, rather than disease-centric, care that accounts for the interrelatedness of patient’s cognitive status and morbidity profile. Findings call for systems change to support the needed care integration for medical and mental health care 29 and to align health care and community services to deal with the complex needs of patients and caregivers. 18
Footnotes
Authors’ Note
Results were presented in part at Alzheimer’s Association International Conference, July 20, 2015, Washington, DC.
Acknowledgments
The authors are grateful for useful comments and wording from an anonymous peer reviewer that helped to more fully articulate the systems implications of this research.
Declaration of Conflicting Interests
The authors declared no potential conflicts of interest with respect to the research, authorship, and/or publication of this article.
Funding
The authors disclosed receipt of the following financial support for the research and/or authorship of this article: This publication is a product of the Prevention Research Center for Healthy Neighborhoods at Case Western Reserve University, supported by Cooperative Agreement Cooperative Agreement Number, SIP 14-004, U48 DP005030-01S3, under the Health Promotion and Disease Prevention Research Centers Program, funded by the Centers for Disease Control and Prevention. Its contents are solely the responsibility of the authors and do not necessarily represent the official views of the Centers for Disease Control and Prevention or the Department of Health and Human Services. Some of the authors were also supported by a grant from the Agency for Healthcare Research and Quality (R21 HS023113) and the Clinical and Translational Science Collaborative of Cleveland (UL1TR000439) from the National Center for Advancing Translational Sciences (NCATS) component of the National Institutes of Health and NIH roadmap for Medical Research. Its contents are solely the responsibility of the authors and do not necessarily represent the official views of the NIH.