
Abstract
Background:
To assess the relationship between regional neocortical atrophy and psychotic symptoms in adults with mild cognitive impairment (MCI) and Alzheimer’s disease (AD).
Methods:
Rates of change in regional neocortical atrophy as measured by longitudinal magnetic resonance imaging scans and the occurrence of psychotic symptoms and/or the long-term use of antipsychotic medications in 389 outpatients with MCI or AD in Alzheimer’s Disease Neuroimaging Initiative.
Results:
Atrophy rate of 3 specific neocortical regions, lateral frontal, lateral parietal, and anterior cingulate gyrus, was significantly associated with the onset of psychosis including delusions, agitation, wandering, and hallucinations and/or the need for chronic antipsychotic medications. Atrophy rate of the lateral frontal lobe correlated most significantly with onset of psychotic symptoms or need for chronic antipsychotic medications.
Conclusions:
Psychosis was associated with volume loss in specific regions of the lateral frontal and parietal lobes as well as anterior cingulate gyrus.
Objectives
Alzheimer’s disease (AD) is a neurodegenerative disorder characterized by progressive cognitive decline as well as the emergence of various neuropsychiatric symptoms including psychosis. 1,2 Psychosis is frequent in people with AD. 3 One observational study of 329 patients who did not have psychosis at initial evaluation demonstrated an overall incidence of psychosis of 20% at 1 year, 36% at 2 years, and 50% at 3 years. 4 The manifestation of psychosis in dementia can result in significant distress for patients with AD as well as caregivers. 5 These symptoms constitute the primary reason for transfer of patients with dementia from general hospitals to psychiatric hospitals and for their institutionalization out of the community. 6 The most frequently observed psychotic symptoms in Alzheimer’s dementia include agitation, delusions, wandering, and hallucinations. 7
Longitudinal structural magnetic resonance imaging (MRI) allows for the quantitative assessment of the brain atrophy seen in patients with AD. This allows for accurate prediction of cognitive decline based on volumetric analyses of specific brain regions. 8 Frontal lobe atrophy has been associated with the onset of psychosis in schizophrenia 9,10 and has also been associated with the emergence of psychosis in frontotemporal dementia. 11 Psychotic symptoms are correlated with metabolic and perfusion abnormalities in frontal and parietal neocortex in AD. 12 –14 However, longitudinal data on structural correlates to the emergence of psychosis have not been described in the AD literature. Such structural neuroimaging is more readily available than perfusion or metabolic studies of brain function and may represent a practical approach to quantify such changes in the AD brain.
In this article, we looked at longitudinal data from 389 individuals with mild cognitive impairment (MCI) and AD to investigate whether regional neocortical atrophy is associated with psychotic symptoms as identified by reporting of adverse events (AEs), serious AEs, and worsening scores on the Neuropsychiatric Inventory (NPI) or the reported need for chronic antipsychotic medications.
Methods
Alzheimer’s Disease Neuroimaging Initiative Population
Data used in the preparation of this article were obtained from the Alzheimer’s Disease Neuroimaging Initiative (ADNI) database (adni.loni.ucla.edu). The ADNI was launched in 2003 by the National Institute on Aging, the National Institute of Biomedical Imaging and Bioengineering, the Food and Drug Administration, private pharmaceutical companies, and nonprofit organizations as a US$60 million, 5-year public–private partnership. The primary goal of ADNI was to test whether serial MRI, positron emission tomography, other biological markers, and clinical and neuropsychological assessment can be combined to measure the progression of MCI and early AD. Determination of sensitive and specific markers of very early AD progression is intended to aid researchers and clinicians to develop new treatments and monitor their effectiveness as well as lessen the time and cost of clinical trials.
The principal investigator of this initiative is Michael W. Weiner, MD, VA Medical Center and University of California—San Francisco. The ADNI is the result of efforts of many coinvestigators from a broad range of academic institutions and private corporations, and patients have been recruited from over 50 sites across the United States and Canada. The initial goal of ADNI was to recruit 800 adults, aged 55 to 90 years, to participate in the research, approximately 200 cognitively normal older individuals to be followed for 3 years, 400 people with MCI to be followed for 3 years, and 200 people with early AD to be followed for 2 years. For up-to-date information, see www.adni-info.org.
Briefly, screening criteria for entry into the study included the Mini-Mental State Examination score (MMSE), the Clinical Dementia Rating scale, and the Logical Memory subtest of the Wechsler Memory Scale-Revised. All participants were recruited between the age of 55 and 90 years and had at least 6 years of formal education. After the baseline visit, subsequent visits occurred at 6-month or 12-month intervals. Participants who were normal control (NC) or with MCI were followed for 3 years, whereas those with AD were followed for a maximum of 2 years.
Standard Protocol Approvals, Registrations, and Patients’ Consent
The study procedures were approved by the institutional review boards of all participating institutions. Written informed consent to obtain neuropsychological testing and neuroimaging were obtained from all research participants or their representatives.
Study Sample
In this study, we identified 389 individuals who had a diagnosis of MCI or mild AD, with clinical and MRI data at study baseline and 1-year follow-up. For the inclusion criteria, we adhered to the definition from the Diagnostic and Statistical Manual of Mental Disorders (Fourth Edition), which mentions the presence of hallucinations, delusions, wandering, and agitation as the defining features of psychosis. From the total sample, we identified 47 (11.8%) individuals who met the inclusion criteria reported at least 1 AE related to psychosis (ie, delusions, hallucinations, agitation, wandering) and/or reported ongoing use of an antipsychotic medication (Table 1). Patients on antipsychotics at baseline were included in the analysis. We excluded patients who had 1-time psychosis or use of antipsychotics in the inpatient setting, in the context of a medical illness.
Demographics and Baseline Neuropsychological Assessments.
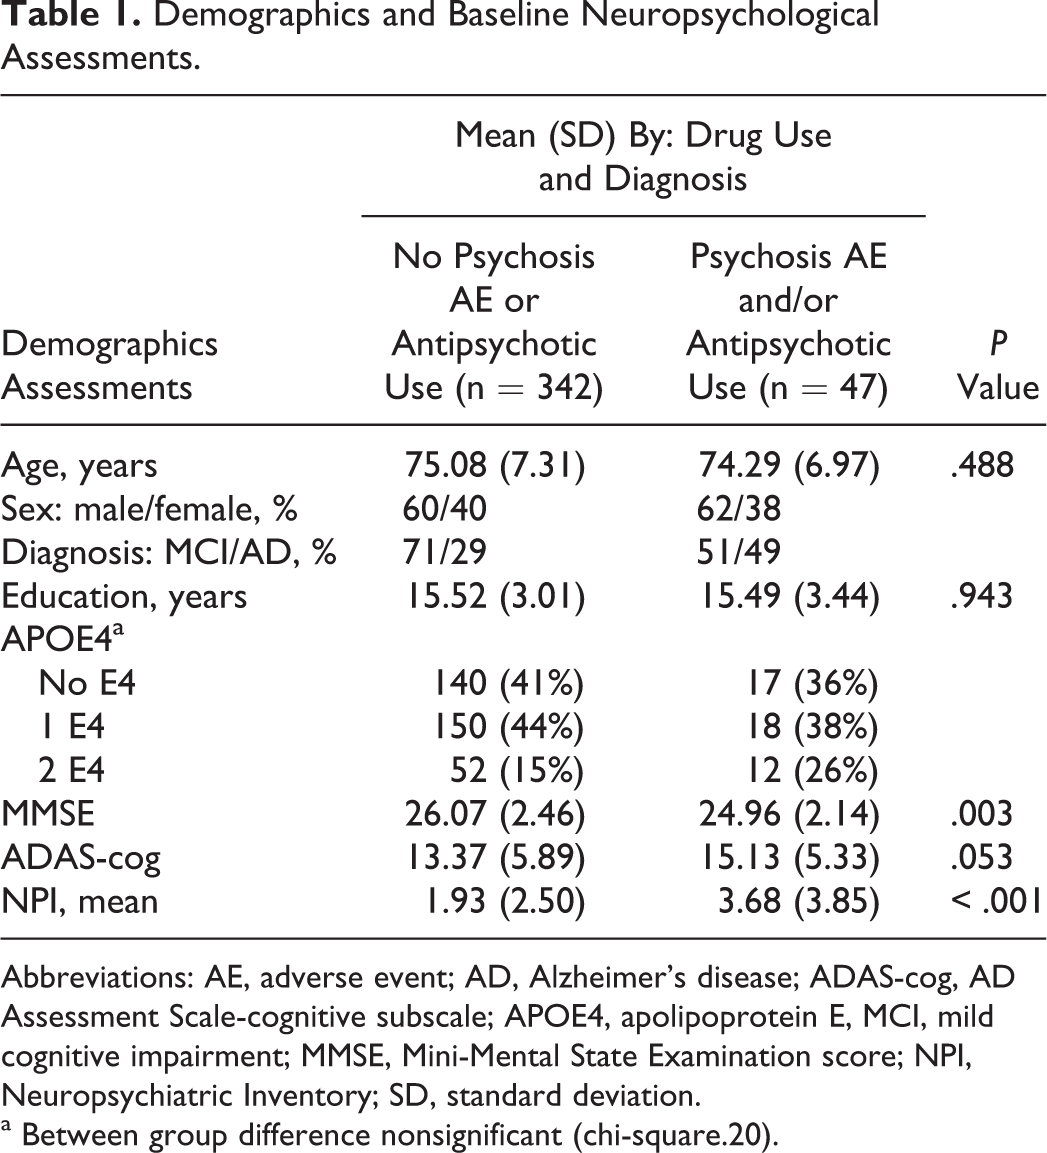
Abbreviations: AE, adverse event; AD, Alzheimer’s disease; ADAS-cog, AD Assessment Scale-cognitive subscale; APOE4, apolipoprotein E, MCI, mild cognitive impairment; MMSE, Mini-Mental State Examination score; NPI, Neuropsychiatric Inventory; SD, standard deviation.
a Between group difference nonsignificant (chi-square.20).
Genetic Marker
Blood samples at baseline were collected, and genotyping of the E4 allele of apolipoprotein E (APOE4) was performed at the University of Pennsylvania AD biomarker laboratory in Philadelphia. The APOE4 gene carriers were participants who had at least 1 APOE4 allele.
MRI Preprocessing and Neocortical Parcellation
The 1.5-T MRI protocol, which was described elsewhere, 15 was standardized across all sites: 2 T1-weighted MRI scans, using a sagittal volumetric magnetization-prepared rapid gradient echo sequence, with an echo of 4 milliseconds, a repetition time of 9 milliseconds, a flip angle of 8°, and an acquisition matrix size of 256 × 256 × 166 in the x, y, and z dimensions with a nominal voxel size of 0.94 × 0.94 × 1.2 mm. A quality control center was designated to exclude scans with serious motion artifacts. The images were downloaded from the public ADNI Web site (http://www.loni.ucla.edu/ADNI/Data/index.shtml) and, locally, MRI data were reviewed for quality, automatically corrected for spatial distortion due to gradient nonlinearity 16 and B1 field inhomogeneity, 17 and registered, and the 2 volumes per patient were averaged to improve the signal-to-noise ratio. Neocortical surface reconstruction 18,19 and parcellation 20 were performed using a locally optimized version of the FreeSurfer software package (http://surfer.nmr.mgh.harvard.edu) to obtain neocortical regions of interest (ROIs). 20
Evaluation of Longitudinal Change on Structural MRI
All image processing and analyses occurred at the Multimodal Imaging Laboratory at the University of California, San Diego. Longitudinal change was quantified using a recently developed automated image analysis methodology. 21,22 Briefly, to obtain 12-month change, follow-up images were fully affine-registered to the baseline images and corrected for intensity nonuniformity. Nonlinear registration was then used to align voxel centers in the baseline with the appropriate location in the follow-up scans, and a volume-change field was calculated. This field was averaged over each FreeSurfer-derived ROI to compute the percentage change from baseline. The volume-change field within this ROI allows an estimation of the atrophy that has occurred in the interim. Because the ROI was derived from the baseline neocortical parcellation, its extent is unchanged between scans, and neocortical thinning is the primary basis of the measured volume change. This method has been validated to be inverse consistent 22 using scan–rescan data and validated for accuracy using models where amount of change was known and where noise was added to approximate that seen in human brain imaging of patients with dementia.
Consolidation of MRI Data
The technique described earlier provided volume change data (12-month postbaseline) for 36 unique neocortical regions. To minimize multiple comparisons, a select number of neocortical regions were evaluated (right and left hemisphere averaged). These included (1) medial orbitofrontal cortex, (2) entorhinal cortex, (3) lateral occipital cortex, (4) anterior cingulate cortex (statistical average of rostral and caudal anterior cingulate cortex), (5) posterior cingulate (statistical average of posterior and isthmus cingulate cortex), (6) lateral parietal cortex (statistical average of inferior parietal lobule and supramarginal), and (7) lateral frontal cortex (statistical average of superior frontal gyrus, rostral middle frontal cortex, caudal middle frontal cortex, pars opercularis, pars orbitalis, pars triangularis, and lateral orbitofrontal cortex).
Assessment of Cognitive Function
The Alzheimer's Disease Assessment Scale-cognitive subscale (ADAS-cog) score was used as a baseline selection criterion and as a dependent measure of cognitive change at 1 year. This test contains 11 items covering language, memory, praxis, and comprehension function. The total score ranges from 0 to 70, with higher scores being indicative of poorer cognitive function. 23 Baseline and multiple follow-up ADAS-cog assessments were available for all the participants.
Assessment of Behavioral Symptoms
The NPI was used as a baseline selection criterion and as a dependent measure of neuropsychological symptoms at 1 year. This test contains 12 items covering delusions, hallucinations, agitation/aggression, depression/dysphoria, anxiety, elation/euphoria, apathy/indifference, disinhibition, irritability/lability, aberrant motor behavior, sleep disturbance, and appetite disturbance. 24 The NPI scoring method that was used in this study involved multiplication of the severity by the frequency score and then summed for subscales or the total.
Statistical Analyses
Data were analyzed using SPSS (19.0) statistical software (IBM, SPSS, Chicago, Illinois). Between-group differences were measured using independent samples t tests, linear analysis of covariances (ANCOVAs), multiple linear regressions, and chi-square (χ2) analysis. Degrees of association between variables were calculated using Pearson’s correlations.
Results
The demographic features of the participants are summarized in Table 1. The samples did not significantly differ on age (P = .488), education (P = .943), or baseline ADAS-cog score (P = .053).The distribution of APOE4 was not significantly related to group status (χ2, 2 degrees of freedom, P = .640). However, the 2 groups differed significantly on MMSE at baseline (P = .003). Given this difference, plus the near-significant difference in ADAS-cog, later analyses incorporated ADAS-cog as a covariate or regression factor in order to help control for group differences associated with cognitive performance (eg, memory and attention).
Between-group differences were measured on the NPI data collected at baseline and at the 1-year follow-up. For the patients without psychotic symptoms, or antipsychotic medication use, the mean NPI score increased from 1.93 (standard deviation [SD] 2.50) at baseline to 3.03 (SD 3.62) 1 year later. The patients with psychosis symptoms and/or antipsychotic medication use increased from 3.68 (SD 3.85) at baseline to 5.68 (SD 5.68) 1 year later. The 2 groups had significantly different NPI scores at baseline (1.93 vs 3.68) and at 1 year (3.03 vs 5.68).The between-group differences were statistically significant both at baseline (P = .004) and at the 1-year time point (P = .003).
For the patients without psychosis symptoms, or antipsychotic medication use, the mean ADAS-cog score increased slightly from 13.37 (SD 5.89) at baseline to 14.83 (SD 8.07) 1 year later. The patients with psychosis symptoms and/or antipsychotic medication showed an increase from a mean score of 15.13 (SD 5.33) at baseline to 20.06 (SD 10.50) 1 year later. The between-group difference in mean ADAS-cog scores was nonsignificant at baseline (P = .053), but at 1 year it was statistically significant (P = .002).
The patients with psychosis symptoms and/or antipsychotic medication use increased from 3.68 (SD 3.85) at baseline to 5.68 (SD 5.68) 1 year later. The 2 groups had significantly different NPI scores at baseline (1.93 vs 3.68) and at 1 year (3.03 vs 5.68).The between-group differences were statistically significant both at baseline (P = .004) and at the 1-year time point (P = .003). Within group t tests indicated that both groups showed significantly increased scores from baseline to 1 year (both P < .004).
Neuropsychiatric Symptoms and Regional Neocortical Atrophy
Independent samples t tests were performed on annualized change scores calculated at the 1-year time point. Of the 7 ROIs (anterior cingulate, entorhinal, lateral frontal, lateral occipital, lateral parietal, medial orbitofrontal, and posterior cingulate), 5 showed significant between-group differences. Specifically, all but the entorhinal and posterior cingulate regions showed significantly greater atrophy in the group with psychotic symptoms and/or antipsychotic medication use (all P values < .05). It should be noted that although the groups had dissimilar sample size, 6 of the 7 comparisons showed homogeneity of variance according to the Levene’s test for equality of variances. For the sixth (lateral parietal), an adjusted P value was calculated and interpreted.
As mentioned before, the authors wanted to control for variance potentially associated with preexisting cognitive differences. Therefore, a linear ANCOVA was calculated to test group differences on each of the 7 ROIs. The covariate was ADAS-cog performance from the screening visit. Of the 7 ROIs, 2 (lateral frontal and lateral parietal) showed significant between-group differences (P < .001 and P = .018, respectively). Even controlling for baseline ADAS-cog performance, greater lateral frontal and lateral parietal atrophy at 1-year postbaseline was seen in patients with psychotic symptoms and/or antipsychotic medication use. A visual representation of these differences can be seen in Figure 1.
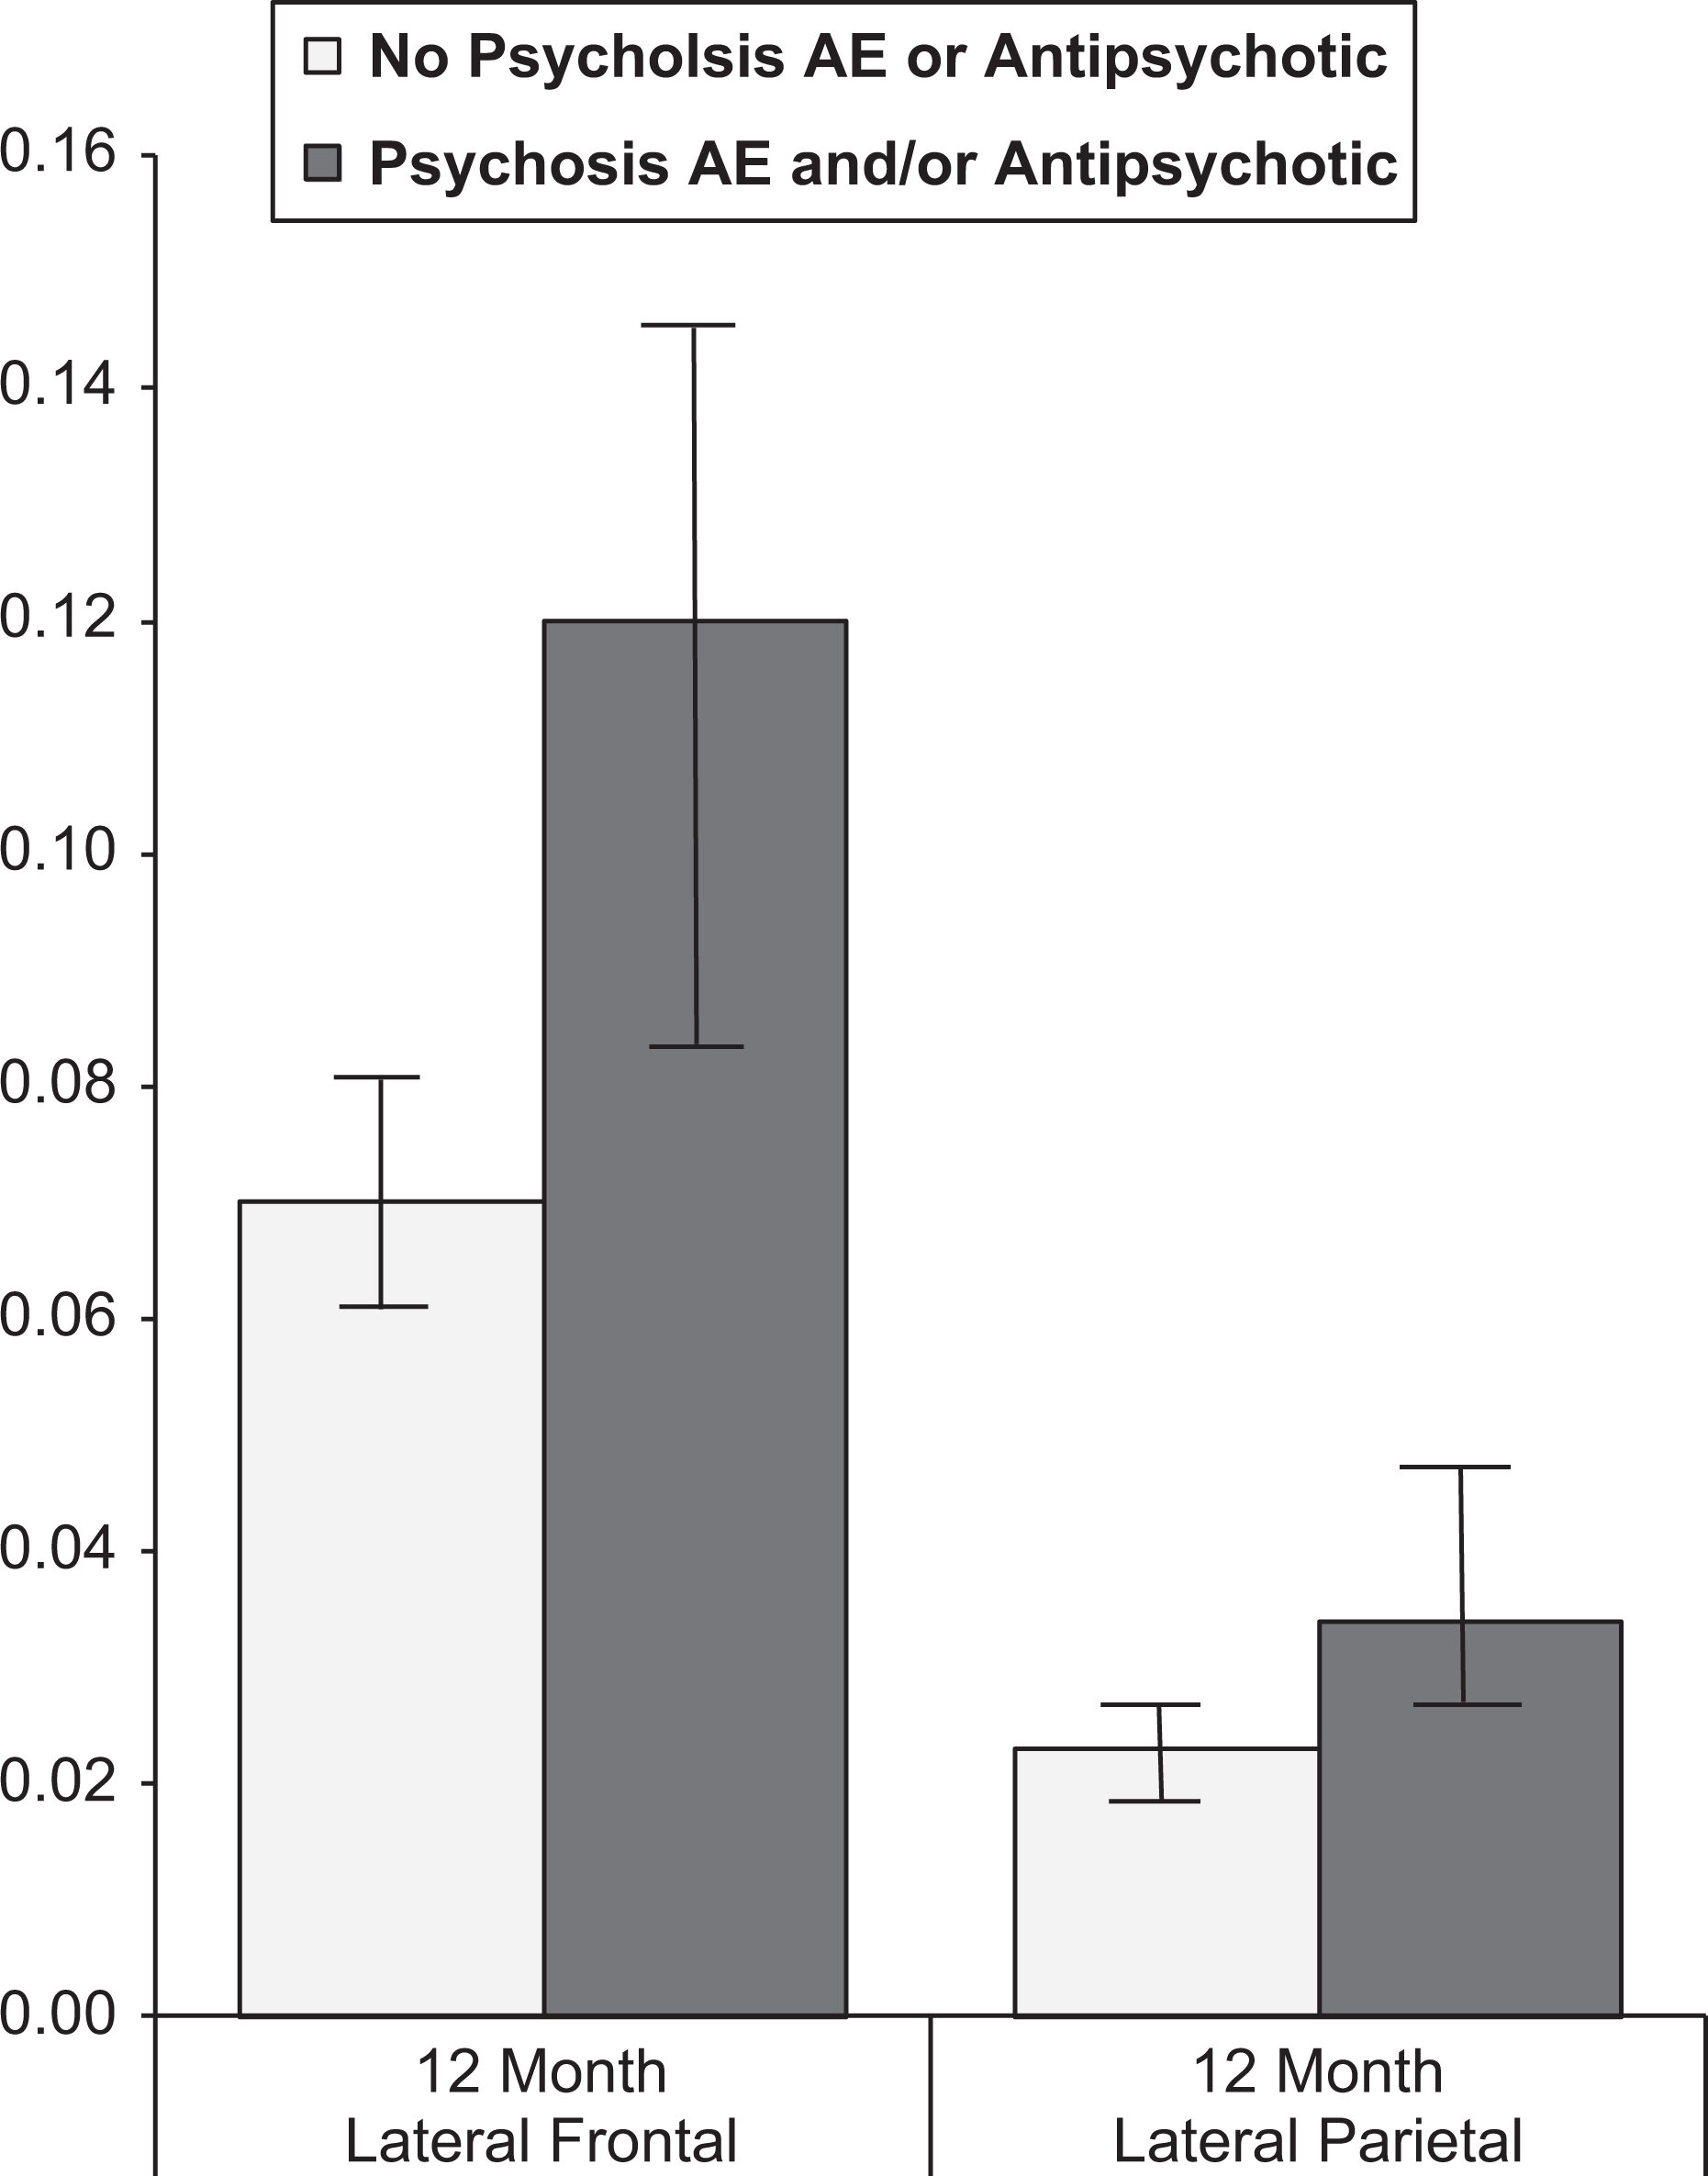
Group differences in lateral frontal and lateral parietal neocortical volume change at 1 year.
The APOE4 Status and Regional Neocortical Atrophy
As Table 1 illustrates the distribution of APOE4 alleles was similar between the 2 groups. We conducted a 1-way analysis of variance (ANOVA) to determine the effect of APOE4 status (no E4, 1 E4, or 2 E4) upon change in neocortical volume at 1-year postbaseline. Of the 7 ROIs, 4 showed a statistically significant relationship between the number of E4 alleles and change in neocortical volume. Greater loss at 1 year in the entorhinal, lateral occipital, lateral parietal, and posterior cingulate regions was associated with having a greater number of E4 alleles (all P values < .01).
Based upon these results regarding APOE4 status, a set of 7 multiple linear regressions were conducted, each to predict 1-year change in 1 of the 7 aforementioned ROIs. The regression factors entered simultaneously were age, ADAS-cog from screening, number of APOE4 alleles, sex, and group (psychosis AEs and/or antipsychotic medications vs no psychosis AEs or antipsychotic medications). The results of these analyses were consistent with what was seen with the aforementioned ANCOVA analyses. In predicting lateral frontal change at 1-year postbaseline, all of the aforementioned factors except APOE emerged as statistically significant factors, including group (all P values < .05). In predicting lateral parietal change at 1-year postbaseline, all of the aforementioned factors emerged as statistically significant factors, including group (all P values < .05). So even when accounting for variance associated with age, baseline ADAS-cog performance, APOE status, and sex, group status was a significant predictor of both lateral frontal and lateral parietal change at 1 year.
Performance on NPI and Regional Neocortical Atrophy
As discussed in the Introduction section, previous studies have described relationships between areas of neocortical atrophy and specific neuropsychiatric symptoms. For the 342 individuals without psychosis-related AEs or antipsychotic medication use, there were only weak correlations between specific NPI subscores and 1-year changes in the 7 ROIs. Specifically, no correlations were identified with an absolute value of .20 or greater. By contrast, the 47 individuals who reported psychosis-related AEs and/or antipsychotic medication use showed a general pattern of stronger correlations between NPI scores and subscores with 1-year change in the 7 ROIs. In this group, 5 of the 7 ROIs showed statistically significant correlations with NPI total score at 1 year. Pearson correlations with NPI total score ranged from −.29 (P = .046) for lateral frontal to −.49 (P < .001) for posterior cingulate. In addition, subscores such as hallucinations and delusions had Pearson correlations with an absolute value of .35 or greater with multiple areas. A greater NPI hallucination score at 1 year was correlated with greater decreases at 1 year in anterior cingulate (−.36, P = .012), lateral frontal (−.35, P = .017), medial orbitofrontal (−.34, P = .019), and posterior cingulate (−.42, P = .004). A greater NPI delusion score at 1 year was correlated with greater decrease at 1 year in anterior cingulate (−.47, P = .001), entorhinal (−.36, P = .013), lateral frontal (−.32, P = .029), medial orbitofrontal (−.31, P = .034), and posterior cingulate (−.43, P = .003).
In this group, using a Spearman’s correlation instead of Pearson’s correlation 5 of the 7 ROIs showed statistically significant correlations with NPI total score at 1 year. Spearman’s correlations with NPI total score ranged from −.31 (P = .037) for lateral frontal to −.47 (P < .001) for posterior cingulate. In addition, subscores such as hallucinations and delusions had Pearson’s correlations with an absolute value of .30 or greater with multiple areas. A greater NPI hallucination score at 1 year was correlated with greater decreases at 1 year in anterior cingulate (−.31, P = .033), lateral frontal (−.32, P = .029), and posterior cingulate (−.32, P = .029). A greater NPI delusion score at 1 year was correlated with greater decreases at 1 year in anterior cingulate (−.39, P = .007), entorhinal (−.34, P = .020), lateral frontal (−.29, P = .047), and posterior cingulate (−.40, P = .005).
Conclusions
This study has established that some of the neuropsychiatric symptoms seen in MCI and mild AD are associated with atrophy of specific brain structures. We found a significant relationship between accelerated atrophy in the lateral frontal lobe and lateral parietal lobe with either reported neuropsychiatric symptoms of delusions, hallucinations, wandering, and agitation or the need for chronic medication to treat such symptoms.
Previous work has demonstrated that atrophy of the frontal lobe is linked to behavioral changes including the onset of psychotic symptoms. 25 In addition, a meta-analysis of studies in patients with psychosis demonstrated reduced neural activation in areas within the left frontal lobe and the left anterior cingulate gyrus. 26 Previous single-photon emission computed tomography data demonstrated lower perfusion in the left dorsolateral frontal and left anterior cingulate gyrus in patients with AD with psychotic symptoms. 27
In this study, we also found that greater atrophy of the anterior cingulate gyrus correlated with an increase in NPI scores for both hallucinations and delusions, respectively. The anterior cingulate gyrus and frontal regions are, in fact, part of a well-known corticosubcortical network, which is involved in the control of complex human behaviors. The anterior cingulate gyrus represents a key structure of a network connecting several association areas involved in behavior. 28 The most specific function of the cingulate gyrus is the regulation of intentional and motivated behaviors. 29 The frontal gyri are implicated in executive functions (ie, planning, attention, strategy, problem solving, and judgment). Disinhibition and related psychiatric symptoms have been clearly demonstrated in patients with disruption of these circuits, most notably in the frontotemporal dementias. 30 The frontal neocortical networks, in conjunction with the anterior cingulate gyrus, subserve many of the functions that seem to disintegrate with increasing psychotic symptoms. These same regions have been implicated in previous studies 27 as well as in this study.
Interestingly, of 47 individuals with psychosis, 24 had 1 or more psychosis-related AEs only (no antipsychotic use), 10 confirmed use of at least 1 type of antipsychotic medication (no psychosis-related AE), and 13 had both (ie, at least 1 psychosis-related AE and ongoing use of antipsychotic medication).
It is interesting to note that the average ADAS-cog scores for the psychotic group worsened at a rate of 5 times the rate of nonpsychosis patients. There is a substantial body of literature providing evidence that patients with psychosis of AD show a more rapid cognitive decline than patients with AD without psychosis but who have similar cognitive deficits. 31,32 This dramatic worsening in cognition may reflect an accelerated pathological process occurring in those patients with neuropsychiatric symptoms, as we corrected for baseline cognitive status in this study.
One limitation of this study is the combining of patients with MCI and AD. In the ADNI sample, MCI is in fact amnestic MCI, and thought to represent prodromal AD, presenting within 3 years of progression to dementia. 33 Most cases of amnestic MCI as defined in ADNI have AD pathology. This allows for a broader spectrum of AD pathology to be studied, including its earliest stages. Neuropsychiatric symptoms are common features of MCI and similar to those of AD and have helped identify a subgroup of patients with MCI with prodromal AD. 34
In conclusion, this study has identified a number of associations between certain foci of neocortical atrophy and the onset of psychotic symptoms as well as the need for medications to control such symptoms. Correlations of this kind may help to identify specific brain circuits involved in the control of complex behaviors as well as their dysfunction and will guide more rational psychopharmacological and behavioral interventions to alleviate these distressing symptoms.
Footnotes
Authors’ Notes
Data used in preparation of this article were obtained from the AD Neuroimaging Initiative (ADNI) database (adni.loni.ucla.edu). As such, the investigators within the ADNI contributed to the design and implementation of ADNI and/or provided data but did not participate in analysis or writing of this report. A complete listing of ADNI investigators can be found at: ![]()
Declaration of Conflicting Interests
The authors declared no potential conflicts of interest with respect to the research, authorship, and/or publication of this article.
Funding
The authors disclosed receipt of the following financial support for the research, authorship and/or publication of this article: This study was supported by grants AG010483 (PSA) from the National Institute on Aging. Data collection and sharing for this project were funded by the Alzheimer’s Disease Neuroimaging Initiative (ADNI; National Institutes of Health Grant U01 AG024904). ADNI is funded by the National Institute on Aging, the National Institute of Biomedical Imaging and Bioengineering, and through generous contributions from the following: Abbott; Alzheimer’s Association; Alzheimer’s Drug Discovery Foundation; Amorfix Life Sciences Ltd; AstraZeneca; Bayer HealthCare; BioClinica, Inc; Biogen Idec Inc; Bristol-Myers Squibb Company; Eisai Inc; Elan Pharmaceuticals Inc; Eli Lilly and Company; F. Hoffmann-La Roche Ltd and its affiliated company Genentech, Inc; GE Healthcare; Innogenetics, N.V; Janssen Alzheimer Immunotherapy Research & Development, LLC; Johnson & Johnson Pharmaceutical Research & Development LLC; Medpace, Inc; Merck & Co, Inc; Meso Scale Diagnostics, LLC; Novartis Pharmaceuticals Corporation; Pfizer Inc; Servier; Synarc Inc; and Takeda Pharmaceutical Company. The Canadian Institutes of Health Research is providing funds to support ADNI clinical sites in Canada. Private sector contributions are facilitated by the Foundation for the National Institutes of Health (www.fnih.org). The grantee organization is the Northern California Institute for Research and Education, and the study is coordinated by the Rev August 16, 2011 Alzheimer’s Disease Cooperative Study at the University of California, San Diego. ADNI data are disseminated by the Laboratory for NeuroImaging at the University of California, Los Angeles. This research was also supported by NIH grants P30 AG010129, K01.