
Abstract
Low level of vitamin B12 and folic acid has been reported to play an important role in the pathogenesis of Alzheimer’s disease (AD) and vascular dementia (VaD). Serum folic acid and vitamin B12 were assayed in 80 AD and 50 VaD cases and in 120 healthy controls. The reduced folate carrier (RFC1) gene, rs1051266, which encodes the RFC 1, protein was analyzed for polymorphism by polymerase chain reaction–restriction fragment length polymorphism. It was observed that the patients having folic acid <8.45 ng/mL had 2.4 (95% confidence interval [CI]: 1.4-4.5) times higher odds of having AD and 2.1 (95% CI: 1.1-4.2) times higher odds of having VaD than patients having folic acid
Introduction
Vitamin B12 and folic acid are important in a number of metabolic pathways involving the central nervous system (CNS), serving to generate methyl groups for production of essential substances such as monoamine neurotransmitters and phospholipids. Folate acts as a donor of methyl groups in a reaction catalyzed by the enzyme methionine synthase to produce methylcobalamin needed for methylation of homocysteine to methionine. The most common findings among vitamin B12- and folate-deficient patients are peripheral neuropathy, demyelination, depression, and dementia. 1 Folate deficiency impairs DNA repair in neurons and sensitizes neurons to oxidative damage and toxicity of amyloid beta-peptide (Aβ). 2
Some authors have reported low serum or cerebrospinal fluid (CSF) vitamin B12 levels in patients with Alzheimer’s disease (AD) and have suggested that, in turn, the patients with AD are particularly prone to vitamin B12 deficiency 3,4 because of their altered dietary behavior. Other investigators have found a low vitamin B12 level in CSF but normal levels of serum vitamin B12 in patients with AD. 5 These results have not been corroborated by many other studies that fail to find any consistent correlation between B12 levels and AD. 6,7 Dietary deficiency of folate has been postulated in contributing to the etiology of both AD and vascular dementia (VaD). In several observational studies, low serum folate levels have been associated with AD and also with other types of dementia. 8 –15 It has been noted that low serum folate levels were associated with atrophy of the cerebral cortex 16 and with impaired specific cognitive functions such as recall and recognition. 17,18
The reduced folate carrier (RFC1) gene that is located on chromosome 21q22.3 encodes the RFC 1 protein, which actively transports dietary folate across the cell membrane. 19 This is the reason for choosing RFC1 gene for investigation of polymorphism like several other investigators. 20 –22 . A missense mutation in the RFC1 gene (G80A; R27H, rs1051266) has been reported by Chango et al. 23 The G variant of rs1051266 has been correlated with lower plasma folate and higher homocysteine levels in healthy persons. 24 A study from Chinese population showed that G allele and GG genotype increased the risk of having AD. 25
In the present case–control study in the Indian population, we have analyzed the impact of the rs1051266 polymorphism on AD and VaD in patients reporting to the cognitive disorder clinic at All India Institutes of Medical Sciences (AIIMS), New Delhi, India. We have also measured the serum vitamin B12 and folic acid level and examined the effect of rs1051266 polymorphism on the biochemical parameters.
Materials and Methods
Study Participants
The study population consisted of 80 AD, 50 VaD, and 120 healthy controls (HCs) participants. This study was conducted during November 2007 to April 2010. Participants were recruited from the cognitive disorder clinic at AIIMS, New Delhi, India, after obtaining informed written consent from the participants. The healthy attendant of patients, patients’ friends, or genetically unrelated relatives of the patients and otherwise healthy patients who were admitted for surgery of their senile cataract were taken as control. The study was approved by the institute’s ethics committee. Patients having dementia were defined by Diagnostic and Statistical Manual of Mental Disorders (Fourth Edition; DSM-IV) or Mini-Mental State Examination (MMSE) score
Estimation of Vitamin B12 and Folic Acid
Serum levels of vitamin B12 and folic acid were assayed in an auto-analyzer (IMMULITE 1000; Siemens Healthcare Diagnostics: Los Angeles, USA) according to manufacturer’s protocol. Principle of vitamin B12 assay was solid phase competitive chemiluminescent enzyme immunoassay and that for folic acid was competitive immunoassay.
Genotyping of rs1051266
Genomic DNA isolation was done from EDTA blood by the standard salting out method. 26 Isolated DNA was processed for further genotyping of rs1051266. The master mix was prepared by adding 8.5 µL of autoclaved distilled water, 12.5 µL of Go Green Taq master mix (Fermentas; Vilnius, Lithuania), and 1.0 µL (20 pmol) of each primer (sense: TGTCACCTTCGTCCCCTC and antisense: CGCCATGAAGCCGTAGA). 27 Genomic DNA (100 ng/µL) was added to each tube to make a final volume of up to 25 µL. Each sample was subjected to a 3-minute initial denaturation (94°C), followed by 35 amplification cycles of denaturation at 94°C for 60 seconds, annealing at 66°C for 50 seconds, extension at 72°C for 60 seconds, and final extension at 72°C for 7 minutes. After completion of PCR, the amplified product was checked by electrophoresis in 2% agarose and further genotyping was done by HhaI (NEB; Massachusetts, USA) restriction enzyme. The variant G allele produced 123 bp and 37 bp fragments while wild allele (A) remained undigested.
Statistical Analysis
Statistical analysis was carried out using Stata 11.0 (College Station, Texas). Data were presented as percentage, mean, or median as appropriate. The chi-square test was used to find out the association between demographic data, biochemical parameters, and genetic polymorphism in AD and VaD as compared to HCs. Biochemical parameters were categorized using median value of the parameters in the HCs, which were taken as the cutoff for finding the association. To determine the interrelation between serum vitamin B12 and folic acid levels, Spearman (nonparametric) rank correlation formula was used since the data were not normally distributed. The biochemical parameters were also compared across the genotype groups using Kruskal-Wallis test since the data did not follow normal distribution. The effect of genetic polymorphisms on AD and VaD as compared to HCs adjusting for demographic and biochemical parameters was found out by using logistic regression analysis. The results were reported as odds ratio ([OR] 95% CI). The P values of less than .05 were considered as significant.
Results
Because the HCs were age matched, no statistically significant difference (AD: P = .50 and VaD: P = .26) was observed in the age distribution between the patient groups (AD: 66.3 ± 8.9 and VaD: 65.4 ± 9.0) and HC group (63.8.0 ± 8.2). Following categorizing of study participants into 2 groups, those <60 years and those ≥60 years of age, the rate of having AD tended to be high (77.5%) in participants ≥60 years as compared to the HCs (70.0%), although the result was not statistically significant (P = .24). In case of patients with VaD, the frequency was similar (72.0%) in participants less than and more than 60 years (P = .79). With regard to the gender-wise distribution of the total 250 study participants, 74 (29.6%) were female participants of which 35 (29.2%) were HCs, 26 (32.5%) had AD, and 13 (26.0%) belonged to the VaD group. No statistically significant difference was observed in the gender-wise distribution between the patient groups and HC group (AD: P = .47 and VaD: P = .15; Table 1).
Association of Demographic Parameters in Patients and Controls.
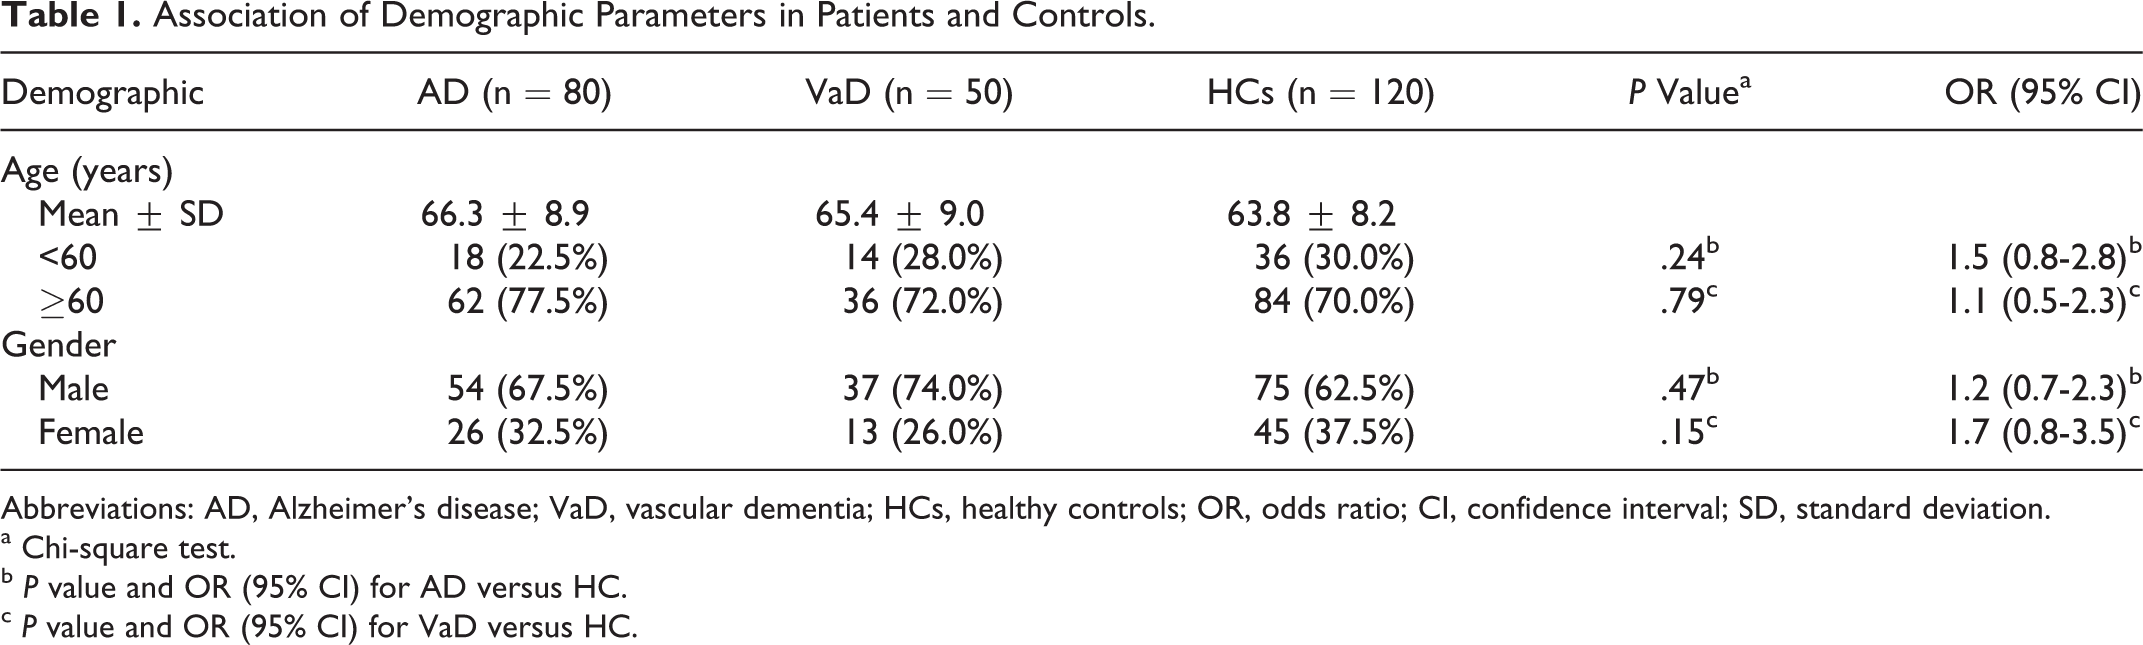
Abbreviations: AD, Alzheimer’s disease; VaD, vascular dementia; HCs, healthy controls; OR, odds ratio; CI, confidence interval; SD, standard deviation.
a Chi-square test.
b P value and OR (95% CI) for AD versus HC.
c P value and OR (95% CI) for VaD versus HC.
Serum vitamin B12 and folic acid was measured in all 3 groups. The mean ± standard deviation (SD) value of serum vitamin B12 levels in AD, VaD, and HC groups were 368.4 ± 218.6, 378.6 ± 185.4, and 412.1 ± 237.6 pg/mL, respectively. Wilcoxon rank sum test did not show any statistically significant difference in vitamin B12 levels between the patient and control groups (AD: P = .15 and VaD: P = .75). In the whole study, only 8 samples (6 in the AD group and 2 in the VaD group) had low levels (<150.0 pg/mL) of serum vitamin B12. The mean ± SD value of serum levels of folic acid in AD, VaD, and controls groups were 7.3 ± 3.5, 7.6 ± 2.6, and 8.8 ± 3.6 ng/mL, respectively. Wilcoxon rank sum test showed statistically significant difference in serum levels of folic acid in patients with AD (P = .005) as well as in patients with VaD (P = .048) as compared to the HC groups (Table 2).
Association of Biochemical Parameters in Patients and Controls.
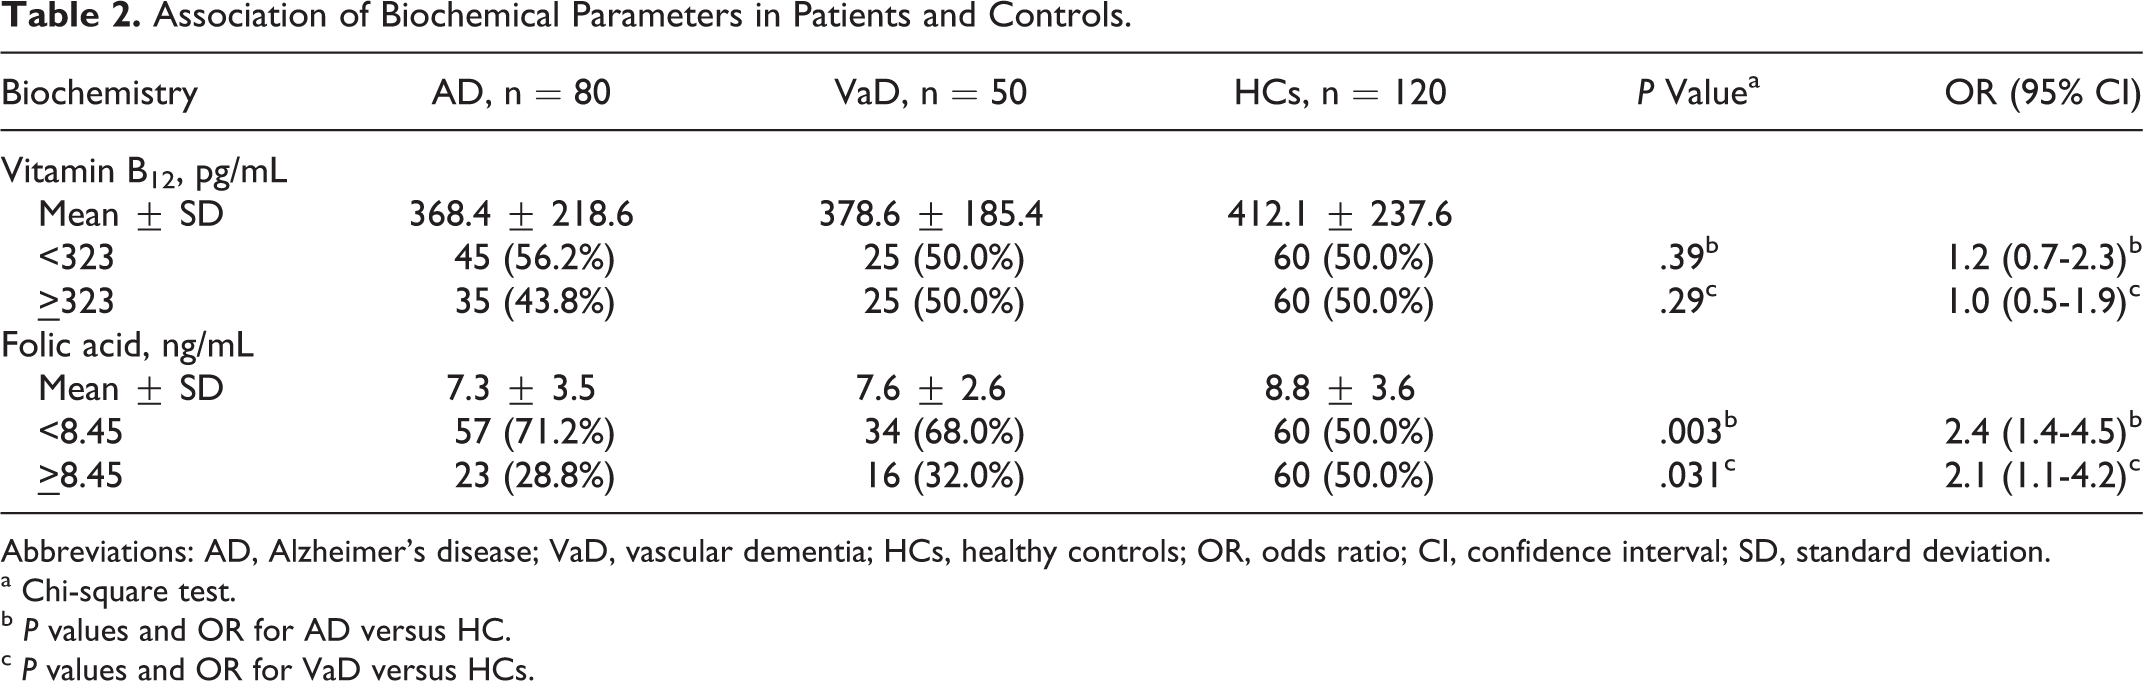
Abbreviations: AD, Alzheimer’s disease; VaD, vascular dementia; HCs, healthy controls; OR, odds ratio; CI, confidence interval; SD, standard deviation.
a Chi-square test.
b P values and OR for AD versus HC.
c P values and OR for VaD versus HCs.
Taking the median of vitamin B12 and folic acid level in HC as the cutoff value, frequency of number of AD and VaD patients above and below this level was examined (Table 2). With adopted cutoff value of serum levels of vitamin B12 as 323 pg/mL, there was a difference in the number of cases with AD (45 cases, 56.2%) having vitamin B12 <323 pg/mL and AD having vitamin B12 ≥323 pg/mL (35 cases, 43.8%) and HC (50.0%). This difference (bivariate analysis), however, was not statistically significant (P = .39) when compared with HC. No such difference was observed in cases with VaD (50.0%) and bivariate analysis had a P value of .29.
Interestingly, folic acid, as a categorical variable with the cutoff of 8.45 ng/mL, revealed that the difference in proportions (having 8.45 ng/mL) among the 3 groups was statistically significant (AD: P = .003 and VaD: P = .031). In case of AD, low level of serum folic acid increased the odds of having disease by 2.4-fols (95% CI: 1.4-4.5), whereas in case of VaD by 2.1-fold (95% CI: 1.1-4.2). The interrelation between vitamin B12 and folic acid was not statistically significant (r = .072 with P = .434).
No significant difference in the distribution of wild (A) allele was observed in patients with AD (41.2%) and in patients with VaD (38.0%) as compared to HCs (48.3%; Table 3). Frequency of the variant G was also compared between patients of AD (P = .16) and VaD (P = .08) and HCs. However, it was observed that the frequency of the G allele was highest in the patients with VaD (AD: 58.8%, VaD: 62.0%, and HC: 51.7%).
Genotype and Allele Frequencies of rs1051266 Polymorphism in Patients and Controls.a
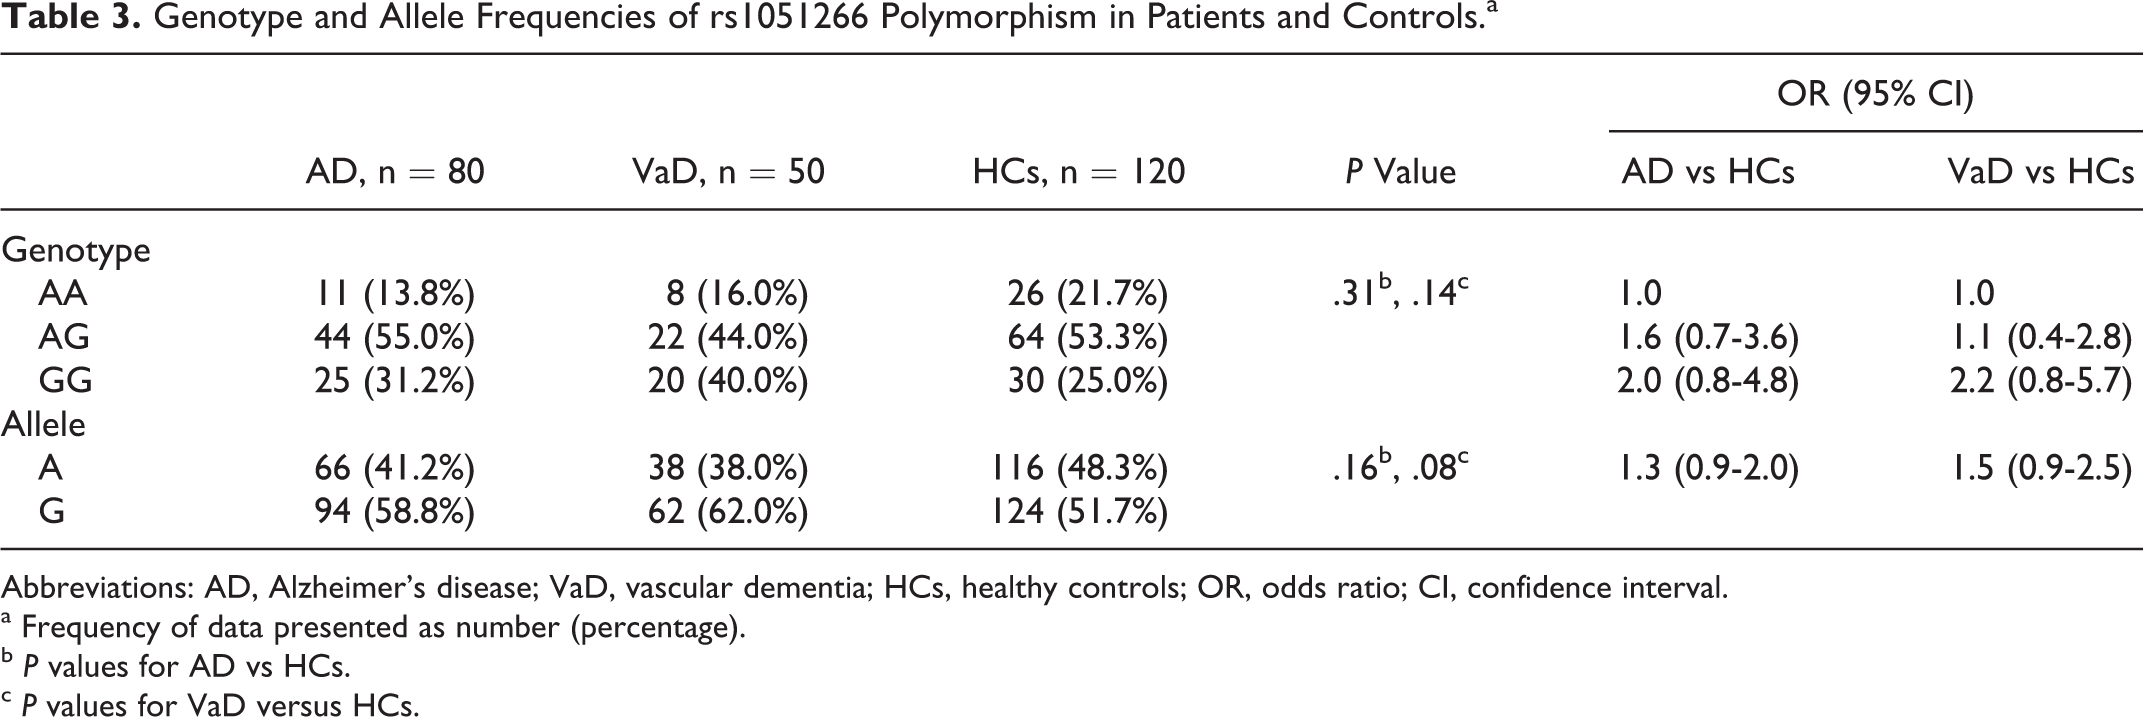
Abbreviations: AD, Alzheimer’s disease; VaD, vascular dementia; HCs, healthy controls; OR, odds ratio; CI, confidence interval.
a Frequency of data presented as number (percentage).
b P values for AD vs HCs.
c P values for VaD versus HCs.
In distribution (Table 3) of the 3 genotypes (AA, AG, and GG), AA was least frequent in AD (13.8%; wild homozygous) as compared to HC (21.7%) and VaD (16.0%). Heterozygous (AG) genotypes was frequent in all 3 groups (AD: 55.0%, VaD: 44.0%, and HC: 53.3%). The GG (variant homozygous) genotypes were most frequent in cases with VaD (40.0%) as compared to cases with AD (31.2%) and HC (25.8%) groups. No statistically significant difference was observed between diseased (AD: P = .16 and VaD: P = .08) and HC group. When these data were adjusted for age and gender, no effect of age and gender was observed in this combination.
The association of the genetic polymorphism and biochemical levels of the parameters was examined by categorization of the participants on the basis of presence or absence of polymorphism against the respective biochemical parameters. Table 4 shows the median (range) of serum folate levels in the 3 genotype subgroups of RFC A80G for HCs, AD, and VaD. When compared as AA versus AG and as AA versus GG, no statistically significant difference was found between the groups.
Serum Folate (ng/mL) Levels in 3 Genotype Subgroups of RFC A80G in Healthy Control (n = 120), AD (n = 80), and VaD (n = 50).a
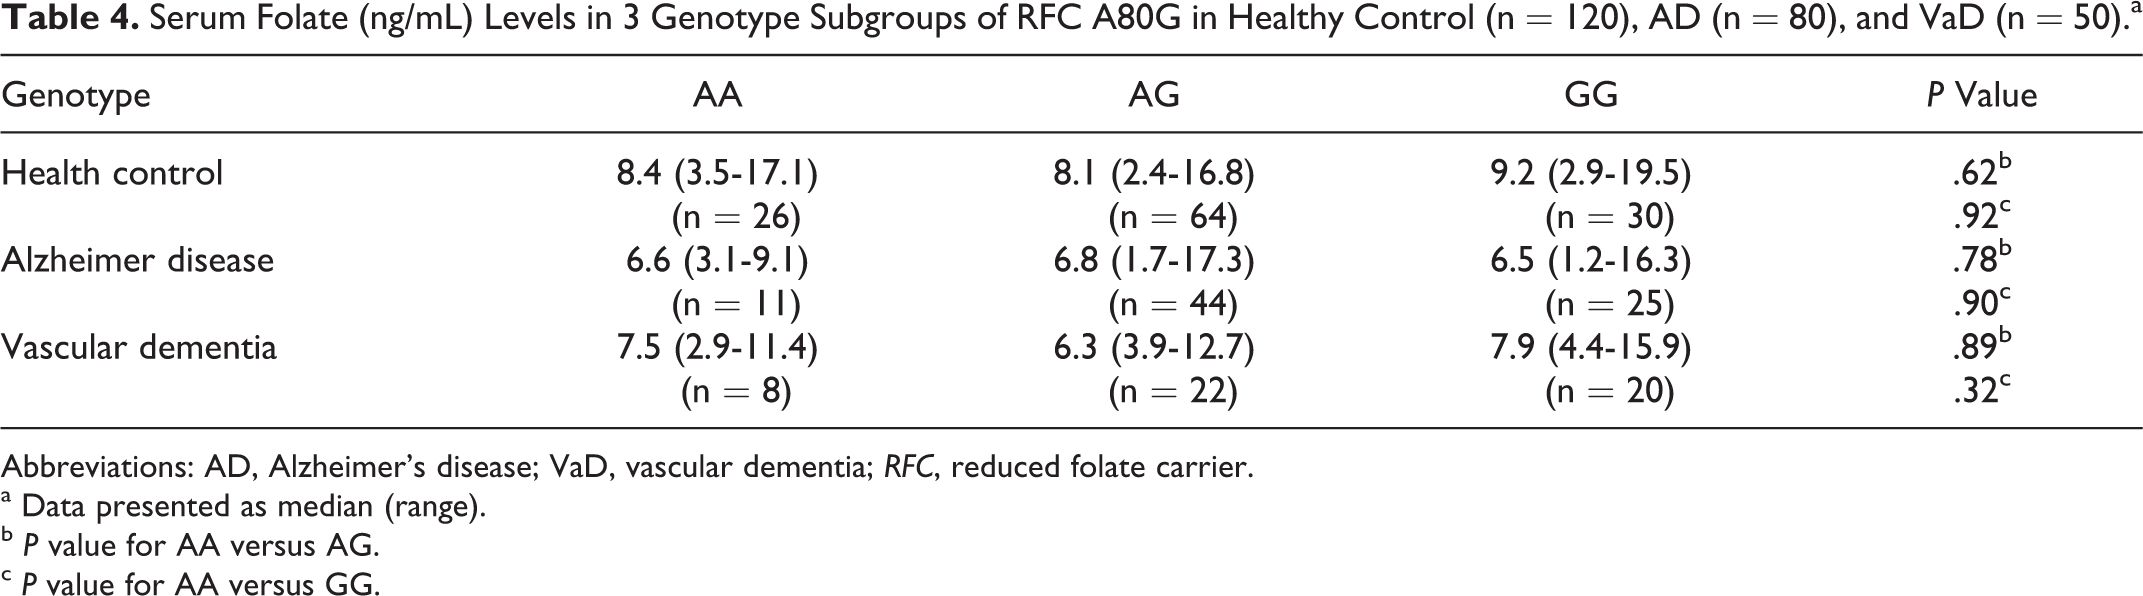
Abbreviations: AD, Alzheimer’s disease; VaD, vascular dementia; RFC, reduced folate carrier.
a Data presented as median (range).
b P value for AA versus AG.
c P value for AA versus GG.
Discussion
Even with limited sample size, the present study has shed light on certain demographic aspects of 2 predominant dementias, AD and VaD, diagnosed clinically and confirmed with the help of CT and/or MRI at AIIMS. We observed that most of the cases are over 60 years (AD = 62/80 and VaD = 36/50), which gives strength to the hypothesis that advanced age is a definite risk factor for dementia 28,29 for both AD (OR = 1.5; 95% CI: 0.8-2.8) and VaD (OR = 1.1; 95% CI: 0.5-2.3). According to Dementia in the Asia Specific Region (2006) report, women are more likely to develop AD than men do (another possible risk factor). In this study too, we observed that women were at higher risk to develop AD (OR = 1.2; 95% CI: 0.7-2.3) and VaD (OR = 1.7; 95% CI: 0.8-3.5). However, among the participants recruited for this study, the number of males exceeded that of females, in both the AD and VaD groups (males vs females in AD: 54 vs 26 and in VaD: 37 vs 13).
There are conflicting data of different cross-sectional and prospective studies on the association of vitamin B12 and folate with dementia and impaired cognition. 6,11,12,30 –33 We did not observe any statistically significant difference in vitamin B12 levels between patient and control groups, when vitamin B12 was taken as a categorical variable with the cutoff of 323 pg/mL. However, as mentioned in the result for folic acid, our data show a positive correlation between low serum folic acid level and frequency of VaD and AD. Several reports showed concurrence with our findings 11,34,35 for vitamin B12 and folic acid, whereas some studies obtained no such difference, 31,36 –38 while a few studies observed that both low folic acid and vitamin B12 are significantly associated with AD 39,40 as compared to control participants.
Older people with low folate status are more likely to be demented, institutionalized, and also depressed. 12 A correlation has been reported between low serum levels of folate and specific cognitive functions such as recall and recognition. 17,18 Older people with low levels of folate are twice as likely to develop AD as compared to those with normal levels. 41 After a 4-month folic acid–deficient diet, insomnia, fatigue, and forgetfulness were reported by Herbert. 42 Higher dietary folate intake results in a lower stroke risk. 43 Many studies have shown that low level of serum folate, but not of other vitamins, may increase the risk of AD, 8 –10 as also seen in our study.
However, such findings need to be corroborated with the dietary intake of vitamin B12 and folic acid by the participants. A diet rich in meat has higher vitamin B12 content, whereas a diet rich in vegetables has higher folate content. 44 The explanation for a higher folate intake and a lower AD risk could be confounded by the socioeconomic or lifestyle factors. Persons who take vitamin supplements are better educated, and therefore education in turn is related to a lower risk of AD. 45 The limitation of the vitamin B12 and folate data in our study is that we do not have the details of dietary intake of vitamin B12 and folate in HCs and patients. Indians, although, predominantly consume vegetarian diets, deficiency of folic acid and vitamin B12 can occur due to “Indian dietary paradox” like prolonged cooking and frying of food, which can destroy up to 90.0% of folate content.
In investigation of polymorphism of RFC1 gene as an extension of effort to find out connection between genetics, folic acid, and AD, no association of variant (G) allele and genotype of rs1051266 was observed in both AD and VaD. However, a study in Chinese population by Bi et al 25 showed that both allele and genotype increased the risk of AD. To the best of our knowledge, no such report is available in the literature for patients with VaD. The result may be attributed to high frequency of the variant genotype (GG) in the present study, 75 in 250 participants, that is, 30.0%, as also reported in earlier study from India (27.0%). 46
Dufficy et al, 47 Gellekink et al, 48 and Yates and Lucock et al 49 report that transport of folate into red blood cell (RBC) is negatively associated with RFC1G allele and as a result there is low serum folate and high homocysteine level. The result for the latter is often inconsistent. Conflicting data exist on the effect of this genetic polymorphism on the plasma or RBC folate and homocysteine levels. 24,48,50 –52 Although we did not observe the effect of polymorphism on folic acid, however Bi et al 25 observed a trend of lower folate levels in the participants with GG genotypes than that in the participants with the GA + AA genotypes but not statistically significant. There could be several possible explanations for this. One of them is that the polymorphism does not change the function of RFC1 function significantly. It is also possible that the RFC1 80 gene itself is not actively functional and some other unidentified gene in strong linkage disequilibrium with RFC1 80 might be responsible for the association between the RFC A80G and plasma folate levels and thereby related to the risk of AD. Other single nucleotide polymorphisms in different genes may also play a role in this mechanism. Another possibility could be that the altered function of this polymorphism gets balanced by dietary folate intake.
Conclusion
A salient finding of the study was the significant difference in the proportion of folic acid among the 3 study groups (AD: P = .003 and VaD: P = .031). For AD it increased the odds of having the disease by 2.4-fold (95% CI: 1.4-4.5), while for VaD it was by 2.1-fold (95% CI: 1.1-4.2). We did not observe any association of variant (G) allele and genotype of rs1051266 in both AD and VaD. No effect of the gene polymorphism on folic acid level was also observed. The study has its own limitation. The study was carried out in a single tertiary care hospital in Delhi and in a limited sample size. The estimated power of the study was very meager. We did not have information on dietary intakes of vitamins B12 and folic acid in any participants. Our findings need to be replicated in a large number of participants and in different ethnic groups by combining several centers to provide correct inference toward the hypothesis.
Footnotes
Acknowledgment
The authors are grateful for the financial support from the Indian Council of Medical Research (ICMR), New Delhi, India.
Declaration of Conflicting Interests
The authors declared no potential conflicts of interest with respect to the research, authorship, and/or publication of this article.
Funding
The authors disclosed receipt of the following financial support for the research, authorship, and/or publication of this article: The study was financially supported by the Indian Council of Medical Research (ICMR), New Delhi, India.