
Abstract
Background:
To assess the influence of body mass index (BMI) on the progression of dementia.
Methods:
Sixty elderly outpatients with untreated dementia followed for 12 months. All patients underwent clinical, cognitive, functional, and nutritional assessment at the baseline and after 12 months. Patients were divided into 2 groups by baseline BMI (< or ≥25 kg/m2).
Results:
Participants with a baseline BMI ≥25 kg/m2 had significantly higher Mini-Mental State Examination (MMSE) scores (21 ± 5.1 vs 15.9 ± 5.5; P < .001), while clinical dementia rating (CDR) and multidimensional prognostic index (MPI) scores were similar in the 2 groups. After 12 months, the MMSE score decreased significantly in both groups compared to the baseline, while the CDR and MPI scores increased significantly for patients with a baseline BMI <25 kg/m2.
Conclusion:
A BMI cutoff of 25 kg/m2 could be useful for identifying frail patients with dementia who will experience a more rapid global impairment, which could be assessed adequately using multidimensional evaluation tools.
Keywords
Introduction
Dementia is one of the most common health problems in the elderly individuals, causing disability and increasing mortality. 1 Patients with dementia often have nutritional problems that can strongly influence the disease: they should be identified and treated because they may be partially reversible. In a previous work, 2 a body mass index (BMI) ≥25 kg/m2 identified elderly participants with dementia in good global health and with a better cognitive performance than patients whose BMI was <25 kg/m2. A poor nutritional status has also been associated with a higher incidence of dementia 3 and a faster progression of cognitive decline. 4 Dementia progression generally coincides with functional impairment 5,6 that may be accentuated by an inadequate nutritional status. 7 These findings suggest that monodimensional scales (eg, the Mini-Mental State Examination [MMSE]) are not enough to assess patients with dementia. Comprehensive geriatric assessment (CGA) has proved effective in providing a global picture of the elderly patients; taking an interdisciplinary approach, it explores clinical, functional, cognitive, nutritional, and social domains. Among the multidimensional scales, the Multidimensional Prognostic Index (MPI) has also been validated for hospitalized patients with dementia 8 and should be considered when assessing outpatients. It has proved to be a reliable clinimetric tool for identifying frail participants at higher risk of morbidity and mortality. The aim of this study was to assess the influence of BMI on the progression of dementia using the CGA tools. We hypothesized that multidimensional tools, including a nutritional assessment, would be more sensitive than monodimensional scales in detecting different rates of dementia progression in patients with different BMI.
Participants and Methods
Participants
Patients over 65 years attending the Alzheimer's Assessment Unit at the Geriatrics Division of Padua University, with dementia and at least a 12-month follow-up were eligible for this study. We decided to analyse untreated patient to assess the natural development of dementia. The patients were untreated because they had contraindications or were intolerant to cholinesterase inhibitor or suffered of mixed or vascular dementia. Dementia was diagnosed according to the National Institute of Neurological and Communicative Disorders and Stroke and the Alzheimer's Disease and Related Disorders Association (NINCDS-ADRDA) criteria 9 for Alzheimer’s disease (AD), and the National Institute of Neurological Disorders and Stroke and Association Internationale pour la Recherché et l'Enseignement en Neurosciences (NINDS-AIREN) clinical criteria 10 for vascular dementia. Mixed dementia was diagnosed as AD with concomitant vascular lesions. The exclusion criteria were severe heart failure, kidney or liver diseases, neoplastic diseases, present or past medical/psychiatric conditions capable of causing cerebral dysfunction, major disabilities, or bedridden status. Among 82 patients, 72 met our criteria and 60 completed the study; 9 dropped out for personal reasons, 2 died and 1 refused the 12-month follow-up. Females accounted for 22% of the population; 92% of the sample lived at home, the other 8% lived alone. This study was designed in accordance with the Helsinki Declaration, and all participants were fully informed about the study’s nature, purpose, and procedures, and gave their written informed consent.
Methods
Patients underwent the following tests at the baseline and after 12 months:
functional assessment based on the activities of daily living (ADLs) 11 and instrumental activities of daily living (IADLs) 12 indexes. Given the traditionally different role of the 2 genders in Italian families, 3 items (preparing meals, doing housework, and doing laundry) were not applied to men. To make the values comparable, the IADL scores were calculated as percentages of the maximum value;
cognitive assessment using the MMSE 13 and the Short Portable Mental Status Questionnaire (SPMSQ); 14
the extended Clinical Dementia Rating (CDR) scale 15 , which evaluates memory, orientation, judgment and problem solving, community affairs, home and hobbies, and personal care;
the Cumulative Illness Rating Scale (CIRS); 16
pressure sore risk assessment using the Exton-Smith Scale (ESS); 17
nutritional assessment using the Mini-Nutritional Assessment (MNA) questionnaire; 18
the MPI 19 was calculated by aggregating the total scores in 8 domains (ADLs, IADLs, SPMSQ, CIRS-CI, MNA, ESS, number of drugs used, and living arrangements). The MPI ranges from 0 to 1, with an MPI ≤0.33 indicating a low risk, values between 0.34 and 0.66 a moderate risk, and >0.66 a severe risk of adverse outcome;
body weight and height, measured to the nearest 0.1 kg and 0.1 cm with a standard balance and stadiometer (Seca Germany) with participants wearing light clothing and no shoes. The BMI was calculated as the weight in kilograms divided by the square of the height in meters;
bioelectrical measurements (resistance and reactance) at a standard frequency (50 kHz and 800 μA; BIA 109 Akern-RJL), according to the method proposed by Lukaski. 20 Fat-free mass (FFM) was calculated using Lukaski’s equation 21 and fat mass (FM) was obtained as the difference between the weight and the FFM.
Statistical Analysis
Statistical analyses were performed using the SPSS for Windows, version 17.0 (SPSS Inc, Chicago, Illinois). Results are expressed as mean ± standard deviations (SD). The statistical analysis was conducted using the 2-tailed t test for unpaired data to identify differences between the groups with a BMI < or ≥25 kg/m2 at the baseline. A P value < .05 was considered significant for each 2-sided test.
Results
At the baseline, the mean age of the whole sample was 76.8 ± 5.6 years, the mean weight 63.4 ± 17.7 kg, the mean BMI 25.7 ± 4.7 kg/m2, and the mean MMSE score 18.6 ± 5.75. After dividing patients by baseline BMI (cut-off 25 kg/m2), there were 30 patients in each group.
Comparison Between Groups at the Baseline
Initially, the MMSE scores were significantly higher in the group with a BMI ≥25 kg/m2 (21 ± 5.1 vs 15.9 ± 5.5; P < .001). Participants with severe cognitive impairments (MMSE score < 10) accounted for 11% of the group with a BMI
Body Composition, Cognitive, and Functional Scores at the Baseline and After 12 Months, and Their Variations (Δ) in Patients Divided by Baseline BMI
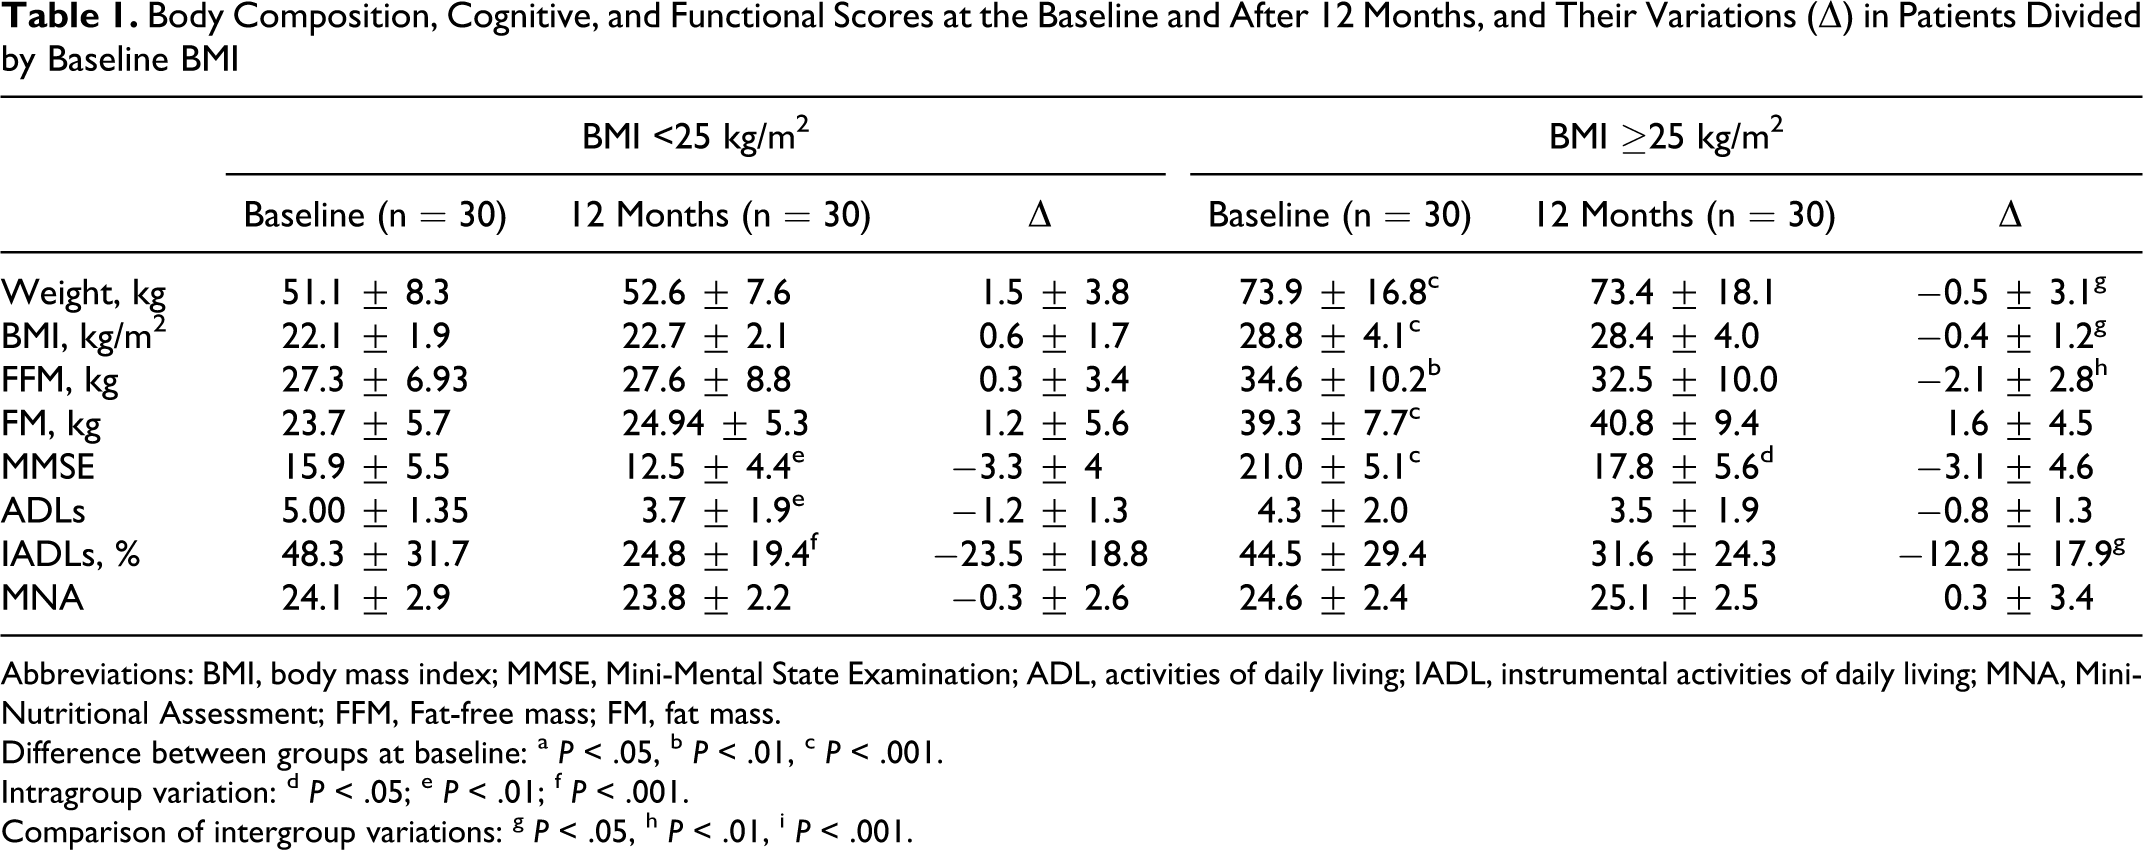
Abbreviations: BMI, body mass index; MMSE, Mini-Mental State Examination; ADL, activities of daily living; IADL, instrumental activities of daily living; MNA, Mini-Nutritional Assessment; FFM, Fat-free mass; FM, fat mass.
Difference between groups at baseline: a P < .05, b P < .01, c P < .001.
Intragroup variation: d P < .05; e P < .01; f P < .001.
Comparison of intergroup variations: g P < .05, h P < .01, i P < .001.
Intragroup Variations (Δ) at Follow-Up
At follow-up (Table 1), there was a significant cognitive decline, in terms of MMSE score, in both BMI groups (ΔMMSE −3.3 ± 4 and −3.1 ± 4.6 in patients with BMI < and ≥25 kg/m2, respectively). The ADL and IADL scores dropped in both groups, but the change was only significant in the group with a BMI
Comparison Between Intergroup Variations at Follow-Up
At follow-up (Table 1), the changes in MMSE and ADL scores did not differ significantly between the 2 groups, whereas the decline in IADLs was significantly worse in patients with a BMI
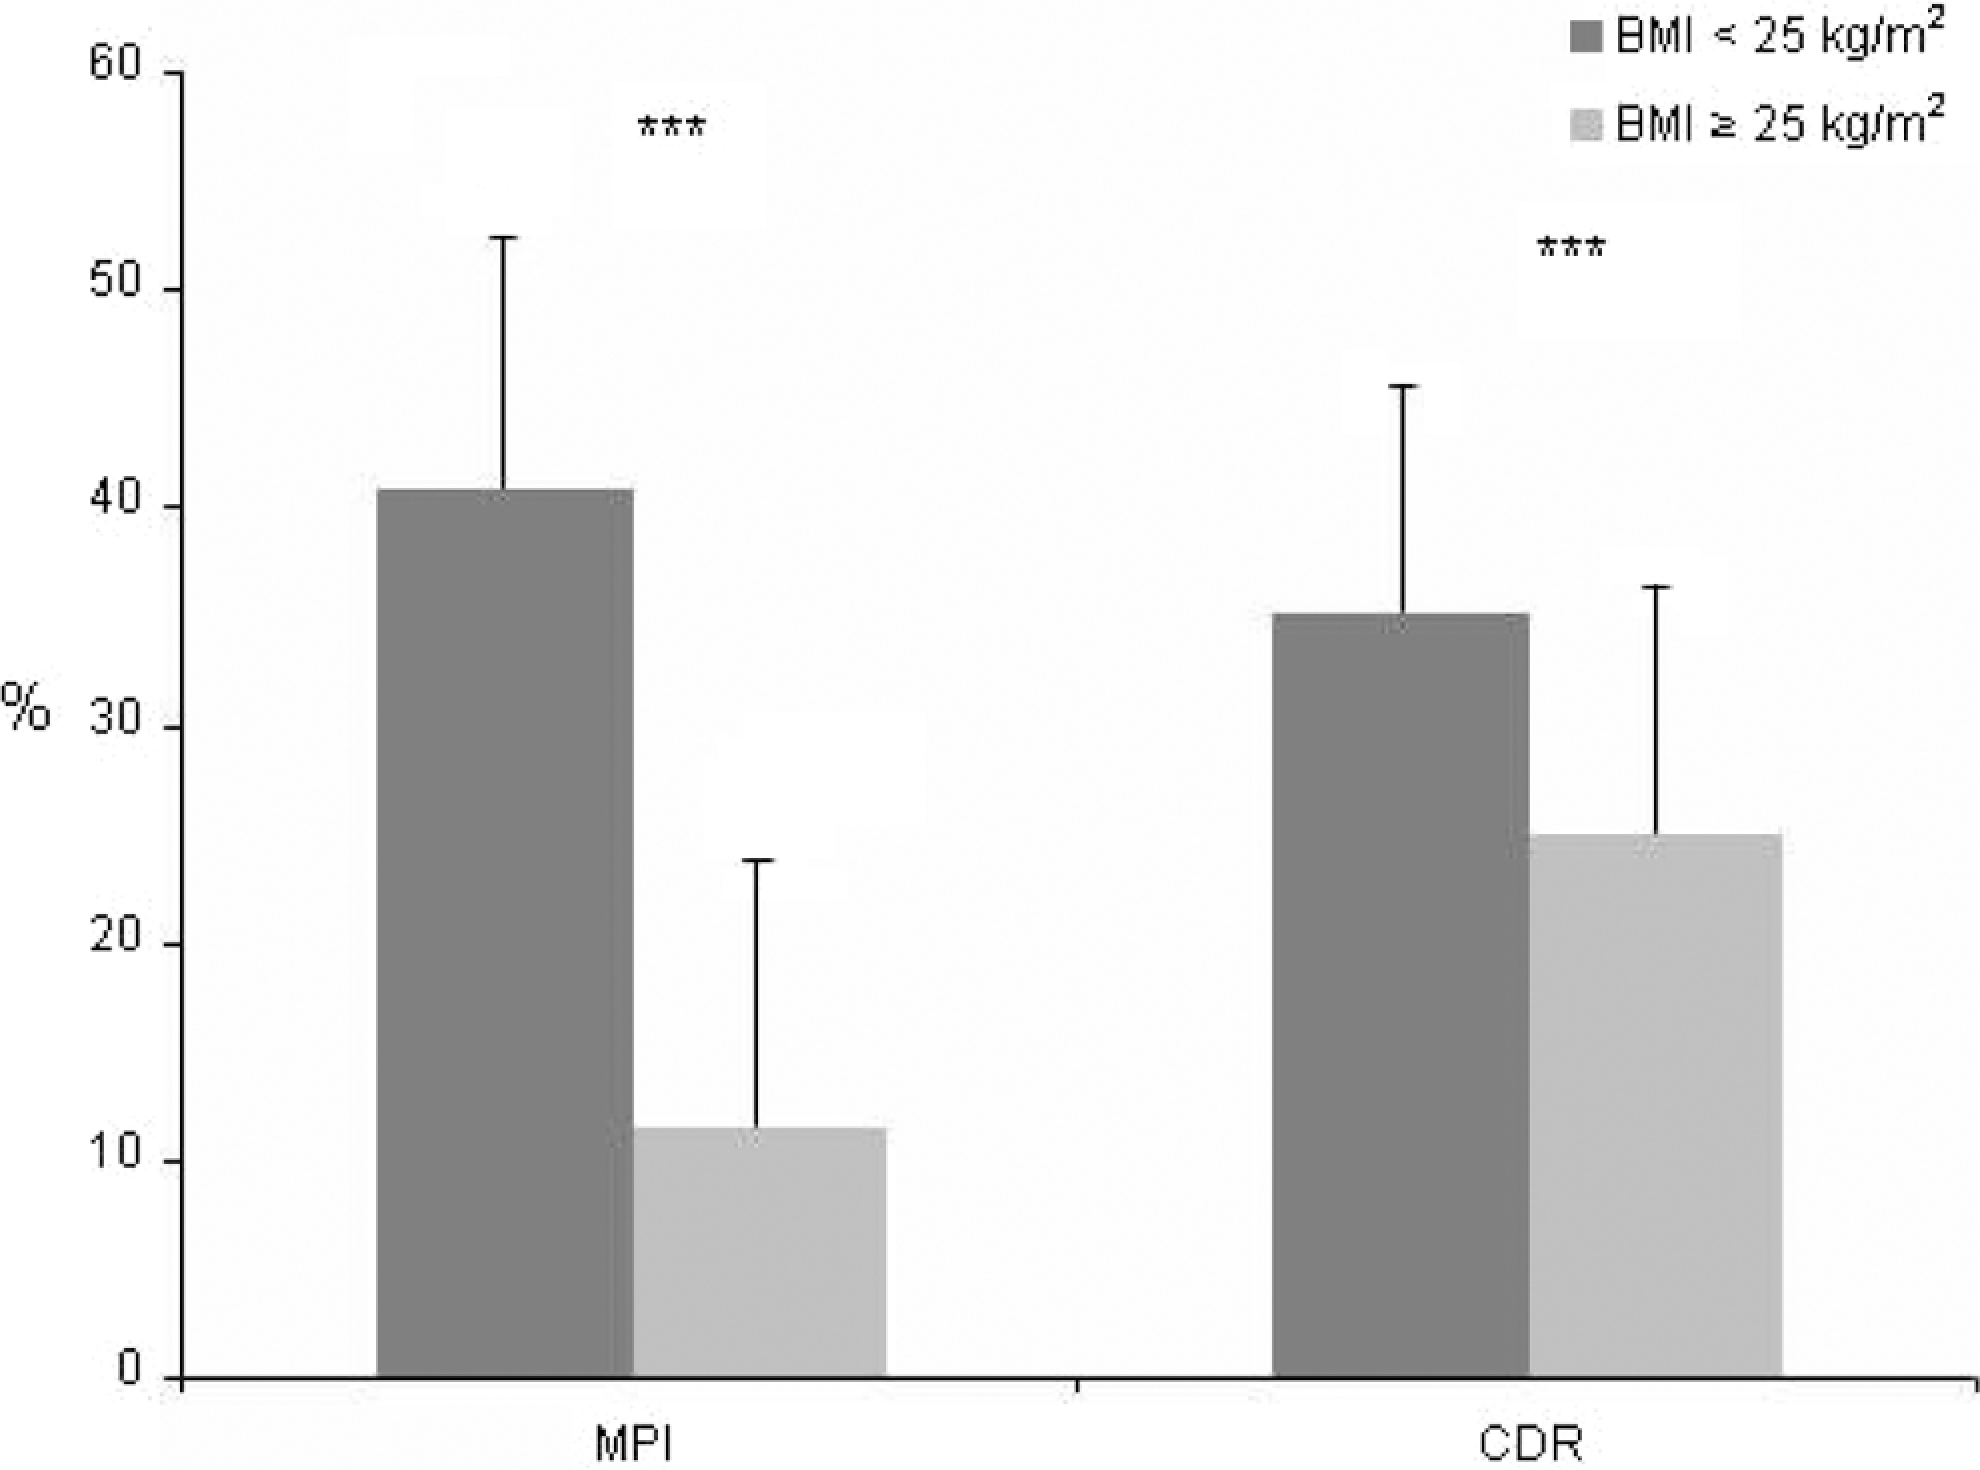
Variations in Multidimensional Prognostic Index (MPI) and Clinical Dementia Rating Scale (CDR) sores (expressed as a percentage of the initial score) during the follow-up in patients divided by baseline body mass index (BMI). ***P < .001
Discussion
This study highlights the importance of BMI in the progression of untreated dementia during a 1-year follow-up. In terms of cognitive function, the initial ΔMMSE scores differed statistically (P < .001) and the situation deteriorated in both groups over 12 months, with no significant difference. We hypothesized that the effects of a lower BMI on baseline cognitive function, as expressed by the MMSE score, 2 might relate to long-standing poor nutritional status. Another consideration could be the impact of dementia severity on BMI, as with dementia progression the behavioral psychotic symptoms (agitation and aggression) and the aversive feeding behaviors besides swallowing disturbances, grow in importance. However, our sample was composed of outpatient participants with moderate-severe but not terminal dementia; moreover, they did not have important behavioral disturbances. Furthermore, in the present study, we did not observe a more marked decrease in body weight in participants with worse cognitive status. Patients with initial lower BMI, in fact, maintained a stable BMI during the follow-up, even if their MMSE score was lower at baseline and at follow-up. In 12 months, the BMI did not seem to influence the rate of cognitive decline in the dimension measured by the MMSE. Our findings seems to indicate that an important weakness of the MMSE lies in its susceptibility to floor effects in tracking the progression of dementia, 22 and its limited value in identifying cognitive changes in patients followed up for less than 3 years. 23 When functional abilities were analyzed, patients with an initial BMI <25 kg/m2 deteriorated more in 12 months than patients with a higher BMI. Unlike the MMSE scores, the functional scales seemed to be sensitive to the patients’ global decline. 24 There were no significant variations in MNA or body composition parameters during the follow-up, that is the initial difference between the 2 groups remained, the sole exception (the loss of FFM in cases with a higher baseline BMI) being clinically irrelevant and possibly due to a greater residual FFM in these patients. Most of our patients lived at home and this is probably why they retained their baseline nutritional status despite declining instrumental abilities: the concomitant decline in ADLs in our sample probably did not influence their ability to eat, which is usually impaired only in very late stages of dementia. 25
Considering the complexity of elderly patients with dementia, using a single scale for their assessment is probably not enough to discern the impact of a different nutritional status on the progression of their disease, which is why we opted to use global assessment tools like the MPI and CDR. At follow-up, the change in CDR score differed significantly (P < .05) between the 2 groups, worsening significantly more in the patients with a lower BMI. The CDR scale gives a broad global picture, capturing most of the clinical symptoms of dementia across the spectrum of the disease severity, and combining information from patients and their caregivers to generate a global rating for each domain. 15 Worsening CDR scores coincided with a decline in MPI scores, which was significant in patients with BMI <25 kg/m2 (P < .01), but not in those with a higher BMI; the former also switched from a low to a moderate risk class, while the latter remained at low risk of adverse outcomes. This finding emphasizes a situation where patients with a lower BMI had both a worse cognitive and functional performance and a more widespread global impairment, leading to higher short- and long-term risks of adverse outcomes.
A shortcoming of our study lies in that only patients with dementia were considered and there was no control group. The small sample size is another limit, preventing us from drawing general considerations from our results, but this is a consequence of our recruiting only untreated patients. In conclusion, a BMI of 25 kg/m2 seems to be the upper threshold for identifying patients with dementia who are more frail and more likely to experience a worse, more rapid global impairment as time goes on. It would seem to be essential to use multidimensional tools to assess elderly patients with dementia, because numerous domains are involved in the onset and progression of their disease.
Footnotes
Declaration of Conflicting Interests
The authors declared no potential conflicts of interest with respect to the research, authorship, and/or publication of this article.
Funding
The authors received no financial support for the research, authorship, and/or publication of this article.