
Abstract
Endoscopic retrograde cholangiopancreatography with brushed cytology is still the standard method for the diagnosis of extrahepatic cholangiocarcinoma in obstructive jaundice; however, the diagnostic yield is limited. To improve the diagnostic sensitivity, DNA methylation analysis is an attractive candidate, since this may constitute a stable marker in brushed specimens. Therefore, this study aims to evaluate the importance of such epigenetic markers in brushed biliary cells from patients with obstructive jaundice for the diagnosis of extrahepatic cholangiocarcinoma. The cells examined were those that were left over from brushed cytology done during routine endoscopic retrograde cholangiopancreatography of patients with extrahepatic cholangiocarcinoma. The methylation states of HOXA1, RASSF1A, P16, and NEUROG1 genes in extrahepatic cholangiocarcinoma were measured by quantitative methylation-specific polymerase chain reaction and compared between brushed biliary cells and normal gall bladder epithelial cells. The results showed that the sensitivity of the methylation index measurements of HOXA1 and NEUROG1 genes from brushed samples was markedly superior to that of standard cytology. In conclusion, measurement of the DNA methylation status of HOXA1 and NEUROG1 genes in leftover brushed biliary cells might serve as a useful supplement in the detection of malignant biliary obstruction by increasing the sensitivity of diagnosis by routine cytology.
Keywords
Introduction
Obstructive jaundice can be caused by benign or malignant conditions; for optimal therapy, a definite diagnosis is essential. 1 Cholangiocarcinoma (CCA), a cancer from biliary epithelial cells, is one of the malignant conditions that are classified into 2 groups, intrahepatic cholangiocarcinoma (ICC) and extrahepatic cholangiocarcinoma (ECC). 2 The ICC presents within the liver parenchyma, while ECC involves the outside larger bile ducts and usually presents with biliary stricture. 3 About 60% to 70% of malignant biliary strictures show no definite mass and are quite similar to benign conditions such as primary sclerosing cholangitis (so-called indeterminate biliary stricture). 1 Histological evaluation is the gold standard for the diagnosis of ECC. A common method is brush cytology, assessed from the bile duct stricture by endoscopic retrograde cholangiopancreatography (ERCP), but the sensitivity is inadequate; a meta-analysis demonstrated only 43% sensitivity and 97% specificity for the diagnosis of ECC in 54 studies. 4 In some cases, fine needle aspiration (FNA) can be performed by endoscopic ultrasound-guided sampling with nearly 100% specificity and 80% sensitivity. However, the localization can be difficult, especially if an infiltrative ductal tumor presents without a definitive mass lesion. 5 Molecular techniques may be introduced to improve the diagnosis. In this respect, clinical DNA testing is particularly suitable since RNA is less stable and protein is often below the detection level in minimal specimens such as endoscopic brushed cells. One of the abnormalities found in the DNA of cancer cells is methylation of cytosine bases in cytosine–guanine (CpG)-rich sequences in promoter regions or in related sequences in associated genes. Methylation reduces the affinity of binding to transcription factors or RNA polymerase and suppresses the transcription of genes. 6 In this way, the expression of tumor suppressor genes can be silenced through abnormal hypermethylation in cancer cells. 7
There have been many reports of hypermethylation of the gene promotors in CCA cells. 8 Homeobox A1 (HOXA1), RAS association domain family 1A (RASSF1A), cyclin-dependent kinase inhibitor 2A (CDKN2A or P16), and neurogenin 1 (NEUROG1) can be significantly present in CCA, especially in ECC. 9 –14 These hypermethylations were accordingly chosen for this study and their methylation status in ECC brushed cells was compared with that in white blood cells (WBCs; nonproliferative cells), gall bladder epithelial cells (GBECs; local nontumorigenic cells), and cancer cell lines (highly proliferative cells). The possibility that assessment of the methylation status of each of these genes, individually or together, could improve the sensitivity of routine brushed cytology was tested.
Materials and Methods
Patient and Tissue Samples
Endoscopic brushed biliary samples were obtained from patients with ECC admitted to Siriraj Hospital. The patients were diagnosed with ECC based on either positive brush cytology or follow-up (at least 6 months), which, in all cases, showed worsening of clinical outcomes (symptoms and signs, laboratory test, image examination, and tumor markers) and was highly indicative of advanced ECC. Other diagnosis and pregnant patients were excluded. Cells leftover from routine brushed cytology were used. The GBECs were harvested from benign specimens after cholecystectomy for routine pathological examination. White blood cells were obtained from patients and healthy volunteers. This study was approved regarding ethical issues by institutional review board of Siriraj Hospital with ethical approval number Si 521/2010.
Cell Lines and Cell Culture
The CCA cell lines KKU-214 (well-differentiated adenocarcinoma), KKU-055 (moderately differentiated adenocarcinoma), KKU-213 (mixed differentiated adenocarcinoma), and KKU-139 (adenosquamous carcinoma) were kindly donated by Professor Dr Banchob Sripa, Khon Kaen University. The established nontumorigenic immortalized bile duct epithelial cell, MMNK1, was kindly provided by Professor Naoya Kobayashi, Okayama University Graduate School of Medicine and Dentistry. 15 Hepatocellular carcinoma cell line, HepG2, was kindly donated by Associate Professor Dr Thawornchai Limjindaporn, Mahidol University.
Sample Preparation and Bisulfite Treatment
White blood cells that contaminated brushed biliary samples were removed by CD45 MicroBead (Miltenyi Biotec, Teterow, Germany) following the manufacturer’s manual before DNA extraction. Total extracted genomic DNA was bisulfite treated by EZ DNA Methylation-Lightning (Zymo Research Corp, Irvine, California) following the manufacturer’s manual. The bisulfite-modified DNA was used for subsequent procedures.
Quantitative Methylation-Specific Polymerase Chain Reaction
The bisulfite-modified DNA was used for quantitative methylation-specific polymerase chain reaction (qMSP) with primers specific for unmethylated (U) versus methylated (M) DNA by LightCycler 480 real-time polymerase chain reaction system (Roche Applied Science, Penzberg, Germany) as previously described (Table 1). 16 –18 The cycle threshold (Ct) values were obtained and the methylation index (MI) was calculated using the following formula: [MI (%) = (2−Ct(M) × 100)/(2−Ct (M) + 2−Ct (U))]. The cycle threshold value of methylated (Ct (M)) DNA and the cycle threshold value of unmethylated Ct (U) DNA were obtained from the reactions with M primers and U primers, respectively.
Primers Used for DNA Assessing Methylation of RASSF1A, HOXA1, P16, and NEUROG1 Gene Promoters.

Abbreviations: HOXA1, homeobox A1; NEUROG1, neurogenin 1; RASSF1A, RAS association domain family 1A.
Statistical Analysis
Statistical analysis was performed using MedCalc software version 17.8 (MedCalc Software bvba, Ostend, Belgium), and SigmaPlot for Windows software version 12.0 (Systat Software, Inc, San Jose, California) was used to create graphs. The MI of each gene was compared among groups using Mann-Whitney rank sum test. Receiver operating characteristic (ROC) curve analysis was performed for each gene compared between control cells (WBC and GBEC) and brushed cells to determine the experimental cutoff level defined as the least value MI to obtain 100% specificity. The diagnostic value to distinguish patient’s ECC cells from GBECs was determined using Fisher exact test. Sensitivity, specificity, positive predictive value, and negative predictive value were calculated from the methylation status of each gene and cytology status in comparisons that used the clinical outcome as a gold standard. P value <.05 was considered as statistically significant.
Results
The MI of HOXA1, RASSF1A, P16, and NEUROG1 Promoters
Brushed samples had come from 9 patients with a definite diagnosis of ECC. Demographic data of all patients are shown in Table 2. Table 3 shows the MI of each of the genes in the cell lines. All CCA cell lines showed a high level of MI for all 4 genes. The MMNK1 cell line had MI of P16 and NEUROG1 but not HOXA1 and RASSF1A at levels different from those of CCA cell lines. HepG2 cells exhibited MI of HOXA1 and RASSF1A at levels similar to those of the CCA cell lines, but this was not the case for P16 and NEUROG1. Figure 1 shows the MI of each gene compared among groups composed as follows: negative controls (WBC from 6 healthy controls and 9 patients with ECC), normal controls (9 GBEC), positive controls (4 CCA cell lines), and brushed cells (9 patients with ECC, 7 males/2 females). The medians with 10 to 90 percentiles of MI from each gene of all groups were determined. The MI from the WBC and GBEC was at similar levels, while MI for each gene from CCA cell lines was significantly higher than both groups, as expected.
Demographic Data of Patients With ECC.a

Abbreviations: ALP, alkaline phosphatase; CBD, common bile duct; DB, direct bilirubin; ECC, extrahepatic cholangiocarcinoma; F, Female; LN, lymph node; M, male; ND, not determined.
aTumor position and spreading were determined from imaging and surgery. Blood chemistry data were collected before endoscope and surgery. The normal ranges of all blood chemistry used at Siriraj Hospital were indicated in bracket.
Methylation Index of RASSF1A, HOXA1, P16, and NEUROG1 Genes From MMNK1, KKU-055, KKU-139, KKU-213, KKU-214, and HepG2 Cell Lines.

Abbreviations: HOXA1, homeobox A1; NEUROG1, neurogenin 1; RASSF1A, RAS association domain family 1A.
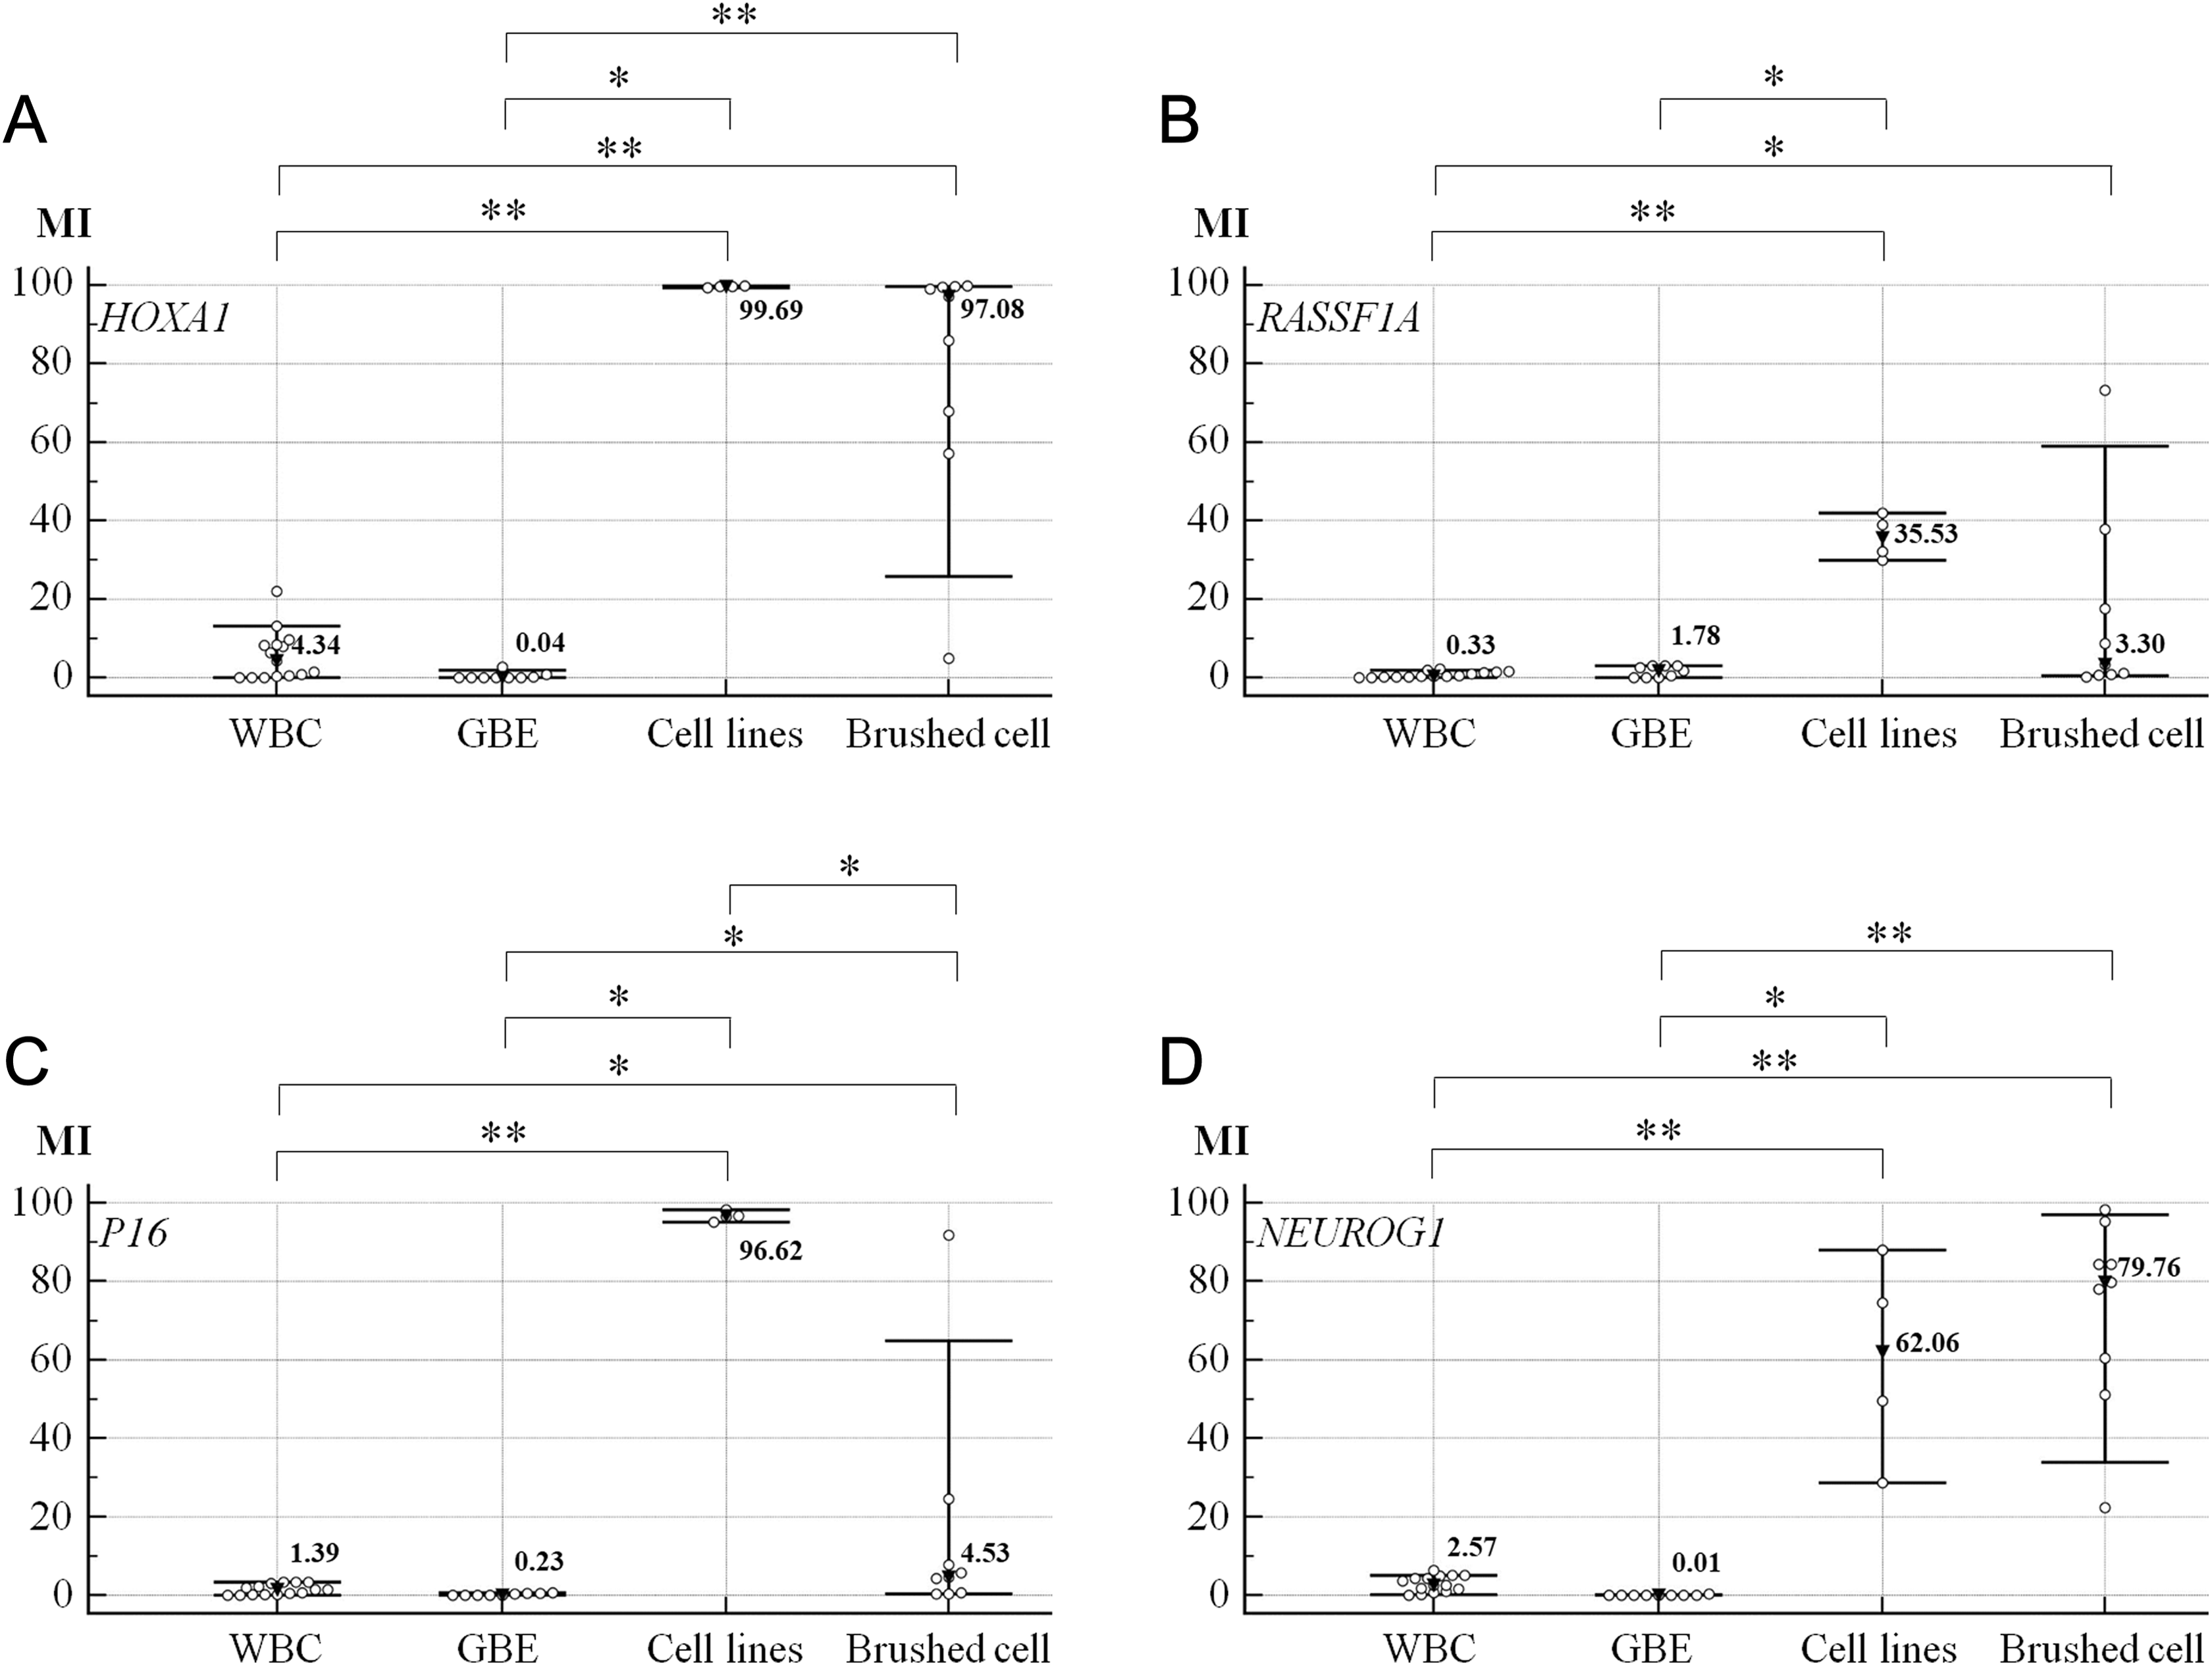
Comparison of the MI of gene promoters among groups composed as follows: negative controls (WBC, n = 15), normal controls (GBEC, n = 9), positive controls (CCA cell lines, n = 4), and samples (brushed cells from patients with ECC, n = 9). Both MMNK1 and HepG2 were presented as representative for nontumorigenic and other cancer cell lines. The open dot symbols indicate individual samples. Inverted black triangle symbols and transverse bars represent the median (with numeric value indicated right side of the symbol) and 10 to 90 percentiles of that group. Asterisk and double asterisk symbols indicate P values (Mann-Whitney rank sum test) less than .05 and .001, respectively. A, HOXA1. B, RASSF1A. C, P16. D, NEUROG1. CCA indicates cholangiocarcinoma; ECC, extrahepatic cholangiocarcinoma; GBECs, gall bladder epithelial cells; HOXA1, homeobox A1; MI, methylation index; NEUROG1, neurogenin 1; RASSF1A, RAS association domain family 1A; WBCs, white blood cells.
In comparisons between the brushed cells and other groups, the MI of HOXA1, RASSF1A, and NEUROG1 was not significantly different from those of CCA cell lines, as expected (P = .076, .076, and .414 for HOXA1, RASSF1A, and NEUROG1, respectively; Figure 1A, B, and D). However, the MI of P16 unexpectedly showed significant difference from the MI of CCA cell lines (P = .003; Figure 1C). All genes showed statistically significant difference when compared with WBC (P < .001, .018, .018, and <.001 for HOXA1, RASSF1A, P16, and NEUROG1, respectively), while only HOXA1, P16, and NEUROG1 but not RASSF1A showed statistically significant difference when compared with GBEC (P < .001, .001, .085, and <.001 for HOXA1, RASSF1A, P16, and NEUROG1, respectively; Figure 1A-D).
Diagnostic Value of MI
The ROC curve analysis determined the experimental cutoff level as >21.92, >3.03, >3.40, and >6.29 for HOXA1, RASSF1A, P16, and NEUROG1, respectively (Figure 2). The GBECs were used as a normal control in the determination of diagnostic value, and the results from each gene and brushed cytology are shown in Table 4. One patient had a non-cancer-related massive stroke a few days after ERCP and had been referred to a hometown hospital. The cytology report had been lost during this period, and the definite diagnosis came from radiological and endoscopic findings. Accordingly, there were only 8 cases with cytology reports.
Diagnostic Value for ECC of the MI of Each Gene Promoter and of Brushed Cytology, Individually and in Combination.a
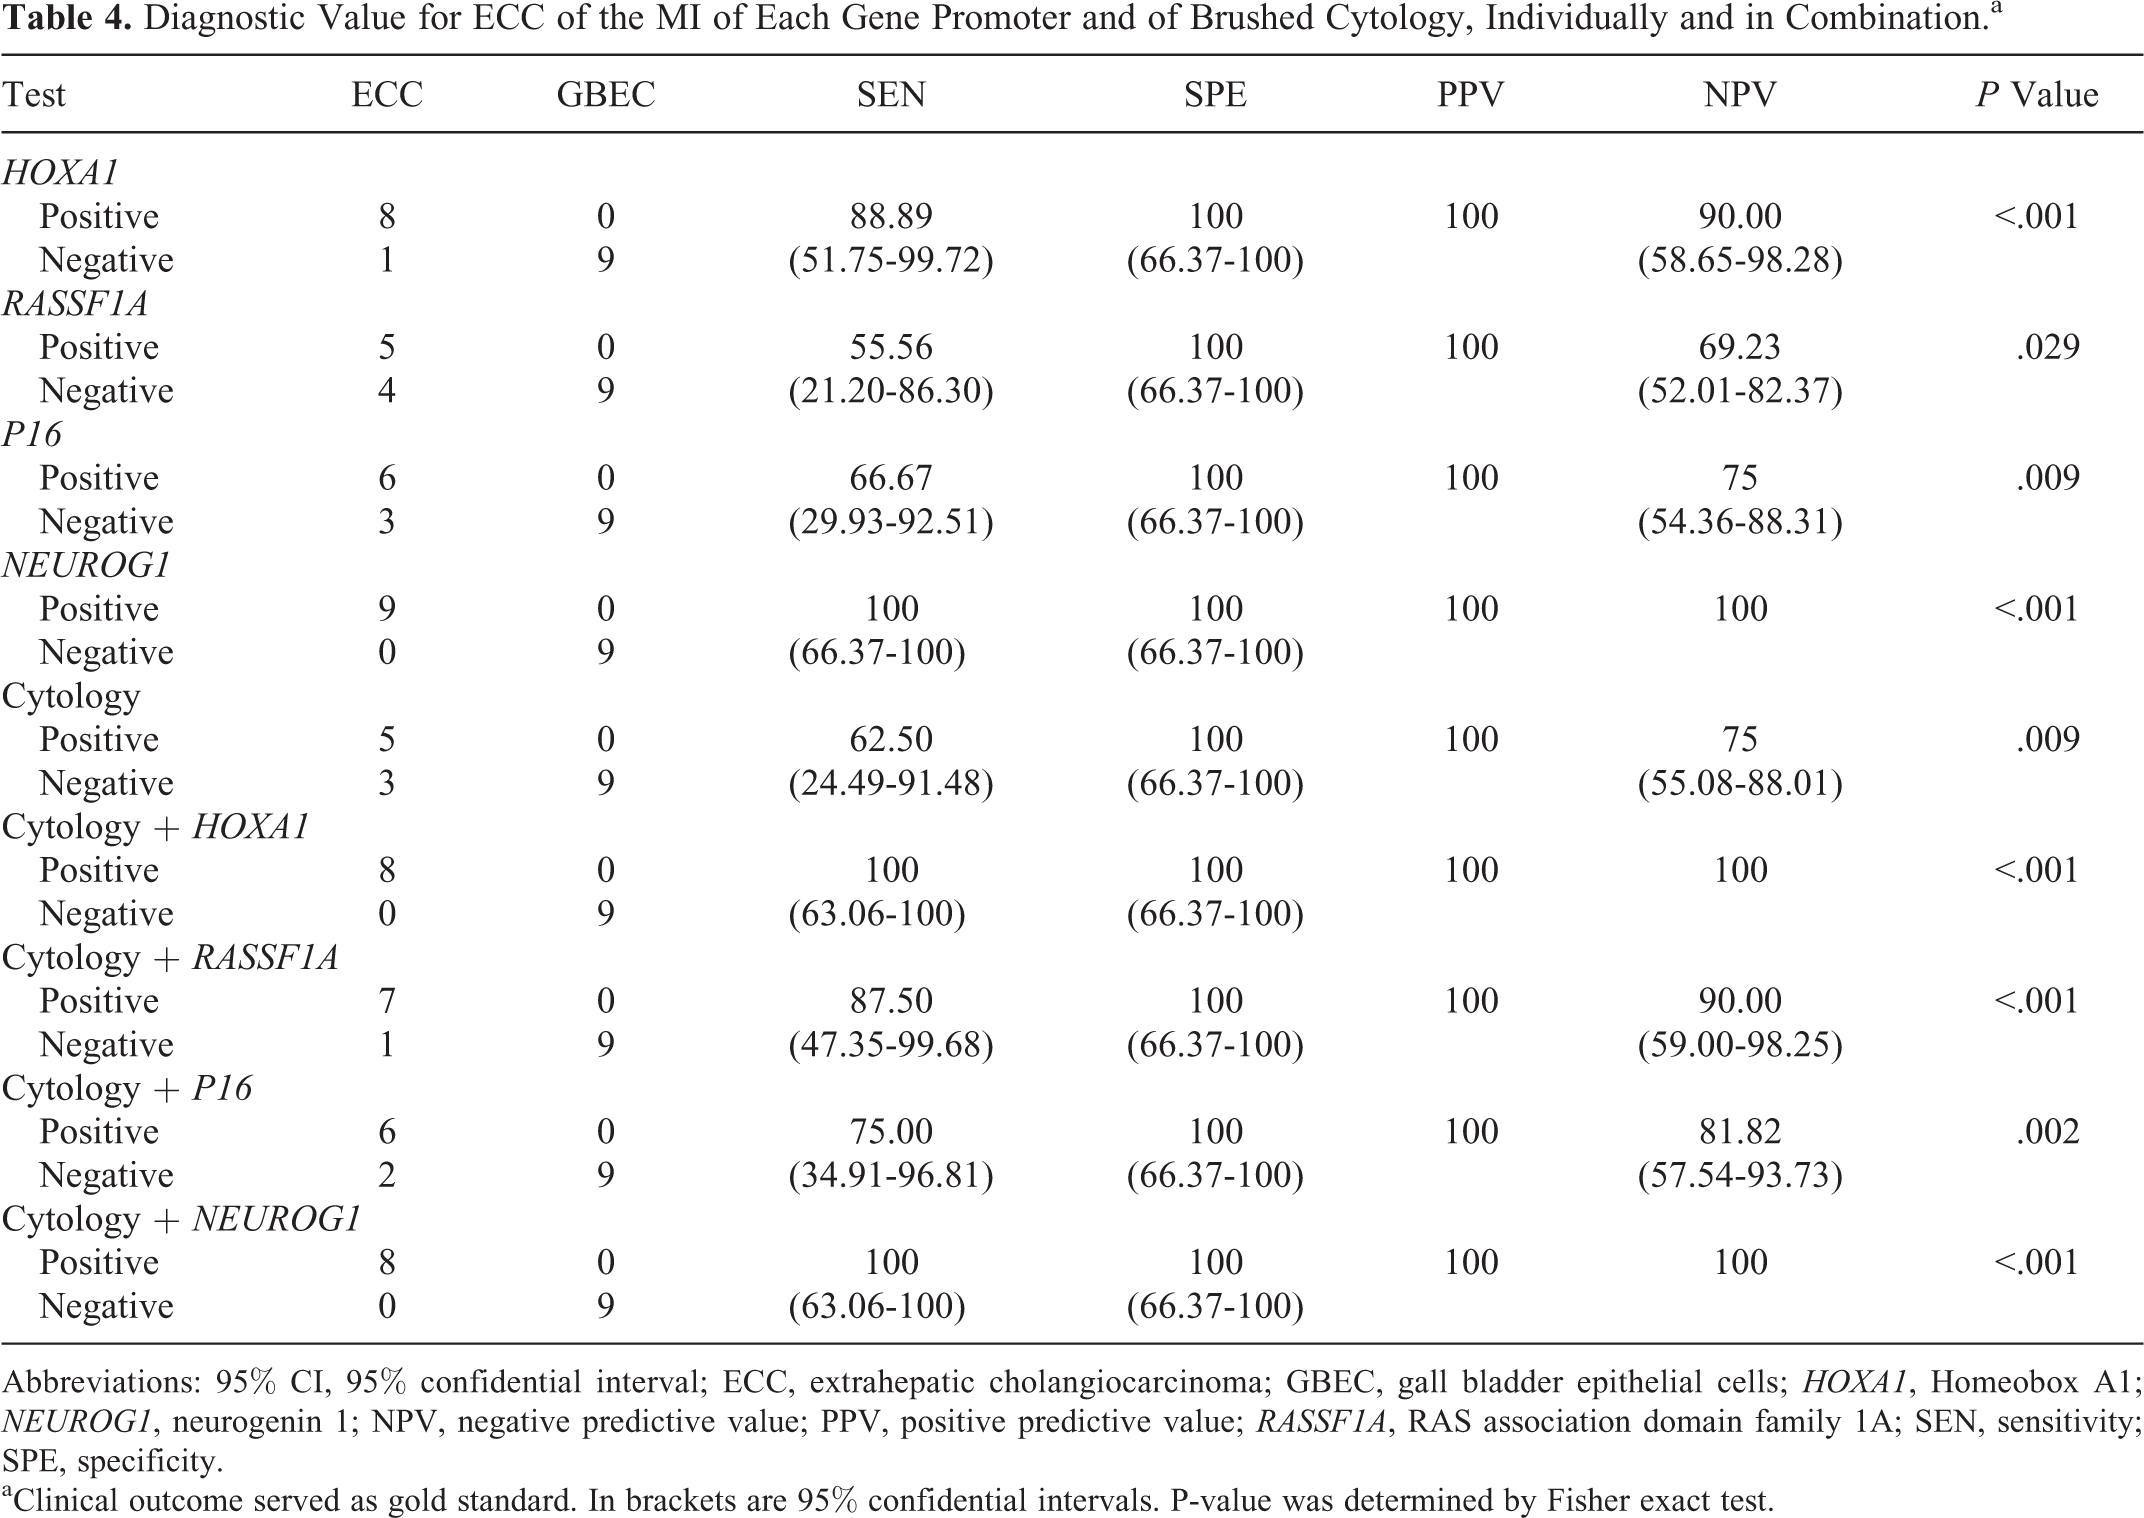
Abbreviations: 95% CI, 95% confidential interval; ECC, extrahepatic cholangiocarcinoma; GBEC, gall bladder epithelial cells; HOXA1, Homeobox A1; NEUROG1, neurogenin 1; NPV, negative predictive value; PPV, positive predictive value; RASSF1A, RAS association domain family 1A; SEN, sensitivity; SPE, specificity.
aClinical outcome served as gold standard. In brackets are 95% confidential intervals. P-value was determined by Fisher exact test.

The ROC curve analysis of gene promoter methylation for discrimination of ECC (brushed) cells from normal cells (WBC and GBEC). The AUC from ROC curve analysis was 0.94, 0.78, 0.88, and 1.00 for HOXA1, RASSF1A, P16, and NEUROG1, respectively. P values for the significance of test above reference line (area = .5) were <.001, .008, <.001, and <.001 for HOXA1, RASSF1A, P16, and NEUROG1, respectively. AUC, area under the curve; ECC, extrahepatic cholangiocarcinoma; GBEC, gall bladder epithelial cells; HOXA1, Homeobox A1; NEUROG1, neurogenin 1; RASSF1A, RAS association domain family 1A; ROC, receiver operating characteristic; WBC, white blood cells.
Discussion
The standard method for the diagnosis of malignancy in biliary obstruction is tissue sampling by an invasive procedure such as FNA or ERCP with brushed cytology; however, the sensitivity is still too low. In this study, an assessment of DNA methylation of HOXA1, RASSF1A, P16, and NEUROG1 promoters by qMSP was introduced to improve the diagnosis. The methylation status of each of these genes in brushed cells was compared to those in normal GBECs, which share similar characteristics to extrahepatic bile duct epithelial cells. 19 A diagnostic test that used an experimental cutoff level derived from ROC analysis showed statistical significance of the test containing all genes. However, sensitivity was derived only from HOXA1 and NEUROG1 showed markedly superior to standard cytology, while from RASSF1A and P16 were equal. Moreover, the cutoff levels that gave 100% specificity of both RASSFIA and P16 were close to the MI median from brushed cells. In addition, MI median from brushed cells of both RASSFIA and P16 was lower than 5% and might be determined as hypomethylation, which differed to that from CCA cell lines. The variation might come from not only variation among patients but also the contamination of nonmalignant cell in sample (normal biliary epithelial and blood cell). The CD45 bead could eliminate only WBC but not normal biliary epithelial, so MI might be lower than expected. However, MI from HOXA1 and NEUROG1 could be still determined as hypermethylation. Therefore, in this study, RASSF1A and P16 may not be as appropriate as HOXA1 and NEUROG1 for use in an optional adjunct test to support brushed cytology for the diagnosis of ECC. Moreover, the brushed cells that remain from cytology of ERCP are typically few in number and yield low amounts of extracted DNA, so assessment of 2 genes might be more suitable than 4 genes. A clear limitation of this study is the small number of patients included. Consequently, the value of MI measurement of these 2 genes for routine clinical or commercial usages should be further studied. A recent report describing the use of an epigenetic marker for the diagnosis of CCA in biliary stricture introduced the use of cysteine deoxygenase type 1, cannabinoid receptor-interacting protein 1, septin 1, and vimentin gene methylations as markers for the diagnosis of ECC in brushed cells. 20 This report validates that test where a combination all 4 genes was used in a large number of patients with high sensitivity (85%) and specificity (98%), similar to the findings of our study. These observations support the use of DNA methylation as part of the diagnostic criteria for ECC in biliary stricture in addition to conventional brush cytology.
DNA methylation status could be used in clinical practice as a diagnostic or prognostic marker. For example, CpG island methylator phenotype (CIMP) could be used as a prognostic marker in colon cancer. 21 In this literature, NEUROG1 was used with the genes for calcium channel voltage-dependent T-type α-1G subunit, for insulin-like growth factor 2, for runt-related transcription factor 3, and for suppressor of cytokine signaling 1, as a 5-gene methylation status marker panel that correlated with clinical outcome in colon cancer. Moreover, the use of CIMP as a prognostic marker in other cancers (eg, gastrointestinal tract cancer, breast cancer, lung adenocarcinoma, brain tumor, and leukemia/lymphoma) has also been reported in the context of various gene panels. 22 DNA methylation may also be useful as a prediction marker for recurrence of cancer in clinical practice, as was reported for gastric cancer in a multicenter prospective cohort study 23 and for prostate cancer. 24 DNA methylation can also be used for early detection of skin 25 and colon cancers. 26
To explain the significance of the phenomenon of hypermethylation of these 4 genes in ECC carcinogenesis, gene functions should be classified. The HOXA1 is a transcription factor, which is involved in cell differentiation, and hypermethylation of its promoter was reported in other cancers such as lung carcinomas. 27 The RASSF1A and P16 were described as tumor suppressor proteins. The RASSF1A was reported to be involved in gene inactivation by either allele loss (chromosome 3p) or hypermethylation in CCA. 28 In addition, the expression of RASSF1A could be recovered by reversal of gene methylation with consequent suppression of cell growth. 29 P16 expression was suppressed in CCA associated with hypermethylation status, 9 and NEUROG1 gene hypermethylation was noted as marker for various types of cancers, especially colon cancer, as already mentioned. Moreover, demethylation of gene promoters and increased gene expression were found in a prostate cancer cell line treated with curcumin, a natural antitumor agent. 30
In conclusion, we have shown in this study that by adding HOXA1 and NEUROG1 promoter methylation measurements to conventional cytology, a substantially increased diagnostic sensitivity was obtained for patients with malignant biliary obstruction. Moreover, combining methylation markers even further improved the diagnostic sensitivity. Therefore, adding DNA methylation status of selected genes to routine brush cytology could be very important in diagnosing malignancy in patients with biliary obstruction and, thus, for choosing the optimal therapeutic management. Further validation with samples from more patients should be performed.
Footnotes
Abbreviations
Acknowledgments
The authors would like to thank Professor Marianne Hokland (Aarhus University) for editorial comment and Dr Jan Davies (Mahidol University) for language proof on the manuscript.
Declaration of Conflicting Interests
The author(s) declared no potential conflict of interest with respect to the research, authorship, and/or publication of this article. All patients were explained for the research process and signed for agreement on paper document.
Funding
The author(s) disclosed receipt of the following financial support for the research, authorship, and/or publication of this article: Funding support for this study was provided by the Faculty of Medicine, Siriraj Hospital, Mahidol University (grant number R015333030). Pornpimol Chobson was supported by the Faculty of Medicine Siriraj Hospital, Mahidol University, and the National Nanotechnology Center (NANOTEC), NSTDA, Ministry of Science and Technology, Thailand, through its program of Center of Excellence Network.