
Abstract
The current study aims to explore possible relationships between various prostate shapes and the difficulty in creating a computer-based plan for cryosurgery. This research effort is a part of an ongoing study to develop computational means in order to improve cryosurgery training and education. This study uses a computerized planner—a key building block of a recently developed prototype for cryosurgery training. The quality of planning is measured by the overall defect volume, a proprietary concept which refers to undercooled areas internal to the target region and overcooled areas external to it. Results of this study numerically confirm that the overall defect volume decreases with an increasing number of cryoprobes, regardless of the geometry of the prostate. However, the number of cryoprobes required to achieve the smallest possible defect may be unrealistically high (<30). Results of this study also demonstrate that the optimal cryoprobe layout is associated with a smaller defect for symmetric prostate geometries and, independently, for prostate models that better resemble a sphere. Furthermore, a smaller defect is typically achieved when the urethra passes through the center of the prostate model. This study proposes to create a cryoprobe convex hull for the purpose of initial planning, which is a subdomain similar in shape to the prostate but at a reduced size. Parametric studies indicate that a cryoprobe convex hull contracted by 7 to 9 mm in all directions from the prostate capsule serves as a quasi-optimal initial condition for planning, that is, a preselected number of cryoprobes placed in the cryoprobe convex hull yields favorable results for optimization. The cryoprobe convex hull could accelerate computer-based planning, while also being adopted as a concept for traditional cryosurgery training, when computerized means are absent.
Introduction
According to the American Cancer Society, prostate cancer is the second leading cause of cancer death in men; 1 in 7 men will be diagnosed with prostate cancer in their lifetime. 1 Cryosurgery of the prostate is a minimally invasive procedure, performed by strategically placing an array of cooling probes (also known as cryoprobes) within a target region. Once activated, cryoprobes generate a frozen region, which triggers a sequence of events, ultimately leading to selective injury and cell death. 2 The target region in prostate cryosurgery may be the entire gland or a preselected portion of it. 3
As a minimally invasive procedure, cryosurgery has been benefited from concurrent developments in medical imaging, including ultrasound, 4 –6 computed tomography, 7 and magnetic resonance imaging (MRI). 8 –10 For example, a review study covering the literature between 1995 and 2011 11 suggests that, despite the fact that diagnosis of a local recurrence is based on prostate specific antigen (PSA) values and kinetics, imaging by means of different techniques may be a prerequisite for effective disease management. It is highlighted there that functional and molecular imaging such as dynamic contrast-enhanced MRI and diffusion-weighted imaging offers the possibility of imaging molecular or cellular processes of individual tumors. It is projected there that imaging will be extensively used in the future to detect and map prostate cancer local recurrences before salvage treatment.
As a salvage treatment after radiotherapy, Galosi et al 12 suggest that cryosurgery offers a potentially curative option for patients with localized disease, while highlighting that computerized treatment planning and miniaturized cryoprobes may provide further therapeutic advantages and lower complication rates. More broadly, it is widely accepted today that computational tools can assist in geometric modeling of cancer tumors, treatment planning, and optimization of the cryoprocedure, which lay out an unmet need for the advancement of cryotherapy techniques.
In order to maximize freezing damage within the target region, while minimizing damage to surrounding tissues, sound planning of the cryoprobe layout is critical. 3 The key parameters in cryosurgery planning are the number of cryoprobes, their layout, and the imposed thermal history on each cryoprobe. An ideal cryoprobe plan involves the creation of a 3-dimensional thermal field such that a preselected isotherm (the planning isotherm) matches perfectly to the outer surface of the target region. The planning isotherm may be (a) the temperature at the onset of freezing, which is closely related to the visualized frozen region by means of medical imaging; (b) the lethal temperature—a temperature threshold below which maximum destruction is assumed; or (c) a clinically relevant temperature to account for safety margins, selected based on the surgeon’s own preference. 13,14
Computational means have been developed and studied in order to provide guidelines for cryoprobe placement. 15 –22 Unfortunately, since the cryoprocedure is not standardized, the computation means are yet to be reduced to practice. With the currently limited means to determine the optimal cryoprobe layout and their ideal thermal histories, undesired cryosurgery outcomes may occur. These may include untreated cancerous tissue within the target region, injury to healthy surrounding tissues, more cumbersome operation due to an excessive number of cryoprobes, increased duration of the surgical procedure, and increase in the likelihood of postcryosurgery complications, affecting the quality and cost of the medical treatment. 19,23,24
In order to quantify the quality of cryosurgery planning, the concept of defect region has been developed. 20 In broad terms, the defect region is an all-inclusive term including areas external to the target region that experienced cryoinjury and areas internal to the target region that are left uninjured. In practice, the defect region is quantified as the volume difference between the target region shape and the curved surface defined by the planning isotherm. It should be noted that it is not only the overall volume of the defect region that is of significance but also its distribution.
Although the defect region in cryosurgery planning may be minimized by a trial-and-error approach, possibly also benefiting from clinical experience and common practices, computerized planning tools are called for in order to solve the defect minimization problem (ie, an optimization problem). Prior studies focused on developing computation tools for planning 3,18 –20,25,26 and computerized training, 14,17,27 while paying little attention to the geometric complexity of the target region, which may affect the level of difficulty to apply a particular planning tool to variable target region shapes. An increased level of difficulty of planning may affect computer runtime, planning strategy approach, and computer-based training.
The current study aims to explore possible relationships between various prostate shapes and the difficulty to create an optimal computer-assisted plan. In particular, this study targets two commonly accepted beliefs that (1) the overall defect volume decreases with the increasing number of cryoprobes, regardless of the geometry of the prostate and (2) the overall defect is smaller for an organ shape closer to a sphere. This study further analyzes the relationship between the prostate shape, the optimal region to place cryoprobes, and the resulting defect distribution. This study uses the bubble-packing method, 18 which has shown superiority in terms of planning runtime and which has served well in pioneering efforts to create a computerized training framework. 14,27,28
Mathematical Formulation
Computerized planning and training are based on 2 key building blocks: a bioheat transfer simulator and a cryoprobe layout planner. Both computation building blocks have been developed, 19,29,30 verified experimentally in prior studies, 18,22 tested for training purposes, 14,23 and are described here in brief only for the completeness of the presentation. In particular, the cryoprobe planner uses the bubble packing method, 18,13 which has been proven robust, characterized by a very short runtime and requires only a single bioheat transfer simulation at the final stage of planning. 28 The computation framework used in the current study is identical to the system developed for computerized training. 14,27,28,30
The bioheat transfer simulator is based on the classic bioheat equation 31 :

where C is the volumetric specific heat of the tissue, T is the temperature, t is the time, k is the thermal conductivity of the tissue,
As highlighted in the Introduction, the defect region concept is used in the current study as a measure of the mismatch between the shape of the target region and a planning isotherm 31 :

where Vt is the volume of the target region, Vs is the volume of the simulated domain, w is a weight function, and Tp is the planning isotherm.
The planning tool 28 used in the current study aims at maximizing cryodestruction internal to the target region, while minimizing cryoinjury external to the target region. The target region in this study is defined as the prostate region, excluding the urethra. Since commonly accepted values for the lethal temperature are in the range of −50°C to −40°C, 2,32 cryodamage is assumed to progress gradually between the onset of crystal formation around 0°C and the lethal temperature threshold, and in the absence of consensus about the most appropriate planning temperature, the isotherm of −22°C has been selected here for planning demonstrations, splitting this temperature range by half. Earlier studies have demonstrated that computer-generated planning can lead to cooling of more than 75% of the target volume below the same planning isotherm, while less than 10% of the external volume resulted in temperatures below the same temperature threshold. 29,33 Although one could select different isotherms for planning in the external and internal regions, the broad conclusions drawn from the current study would remain unchanged. In the absence of specific requirements, a binary value is selected for the weight function in Equation (2), while a higher weight may be assigned to critical areas to be treated, based on the cryosurgeon’s decision.
At the beginning of a simulation, the entire target region is unfrozen and, therefore, represents an internal defect (d equals 1 at the onset). As the freezing process progresses, the frozen region grows and the defect value decreases accordingly. Freezing may exceed the boundaries of the prostate at an advanced stage of the process, giving rise to the development of external defect regions. With a sufficient number of cryoprobes and time, the defect will continue to grow externally, up to limits dictated by the cooling power of the cryoprobes. In each cryoprocedure, there is a point of minimum defect, where the rate of decrease in internal defect is equal to the increase in external defect. It is the instant of minimum defect that defines the termination point for the bioheat transfer simulation, and the defect value at this instant is taken as a quality measure of the specific cryoprobe layout for the specific prostate geometry.
Methods
Prostate Geometry—Target Region Shape
Consistent with previous computerized training studies, 14,11 9 prostate models including the urethra were used in the current study. Four models were reconstructed from preclinical ultrasound scanning 34 and are illustrated in Figure 1. The remaining 5 models were developed by geometric deformation from a base template based on histopathologic statistics, 30 as illustrated in Figure 2. Table 1 lists the geometrical parameters of these models.

Geometrical presentation of prostate Models 1 (a-c), 2 (d-f), 3 (g-i) and 4 (j-l) used in the current study, where the colors represent distance from the surface to the geometric center of the model in millimeters. These models have been reconstructed from ultrasound imaging.

Prostate Models 5 (a-c), 6 (d-f), 7 (g-i), 8 (j-l), and 9 (m-o), which were created by means of free-form deformation 26 from the reconstructed images in Figure 1 (the colors represent surface distance from the geometric center of the model in millimeters). The deformed shapes are consistent with patterns of cancer growth. 26
Prostate Models’ Geometrical Parameters.

Cryoprobe Thermal History
Consistent with previous studies, 28,30 an array of simultaneously operating cryoprobes is considered. Each cryoprobe is 1.3 mm in diameter and having an active cooling length of 20 mm. A typical thermal history at the cryoprobe tip assumes an initial rapid cooling rate from an initial temperature of 37°C down to −145°C within 30 seconds, followed by a constant temperature hold at −145°C. These are typical characteristics of a Joule-Thomson-based cryoprobe. Although the thermal history may somewhat vary among commercially available cryosurgical devices, it is not expected to significantly affect the results presented in this study for two reasons: (i) the duration of the cryoprocedure is an order of magnitude longer than the initial cooling period from normal body temperature to the minimum temperature and (ii) the change in internal energy of the tissue due to freezing is at least 1 order of magnitude greater than changes in internal energy due to variations in a few degrees Celsius in the minimum achieved temperature. 22
Number of Cryoprobes and Placement Constraints
Consistent with clinical practice, this study focuses on cryoprobe layouts containing between 7 and 14 cryoprobes. However, some case studies included an unrealistically high number of up to 35 cryoprobes, in order to investigate optimal cryoprobe layout trends. This study focuses on a variable cryoprobe insertion depth strategy, although clinical practice commonly resorts to either a single insertion depth 33 or a pull-back procedure, 26 where the latter is based on two depths of insertion for strategically selected cryoprobes. It has been demonstrated that a variable insertion depth yields smaller defects 19 and may even be more intuitive for planning. 14 For the purpose of comparing results from the current study with the pull-back procedure, a pull-back cryoprobe should be counted as having 2 different locations. For example, the application of 9 cryoprobes when 5 of them are pulled back to new locations in a second operation cycle should be counted as 14 cryoprobe locations for the purpose of that comparison.
Clinical practice and physical limitations constrain the allowed space for cryoprobe placement. In particular, three constraints are imposed on cryoprobe placement in this study: (1) minimum distance between a cryoprobe and the prostate capsule of at least 3 mm, (2) minimum distance between a cryoprobe and urethra of at least 3 mm, and (3) at least 1 mm between every two neighboring cryoprobes in the transverse plane. These minimum distance requirements are not constrained to a particular orthogonal cross-section (x-y, x-z, or y-z) but correspond to the shortest distance between curved surfaces. Although 1 mm between adjacent cryoprobes in the transverse plane is beneficial for the variable insertion depth strategy of cryoprobes, a placement grid in some clinical procedure limits the same distance to 5 mm. In those clinical practices, a variable insertion depth is not practiced and, hence, the current theoretical study extends beyond the roam of current practices in order to explore alternative and possibly improved cryoprobe placement strategies.
In general, cryoprobe layout planning algorithms are sensitive to the initial conditions, where each initial condition may lead to a different optimal cryoprobe layout and defect region. In order to find the best layout, having the minimum defect from all possible initial conditions, the computerized planning has to be repeated many times. The strategy employed in the current study is, in a cyclical manner, to (i) randomly place a specific number of cryoprobes in the domain, (ii) execute the bubble packing planning algorithm, (iii) run a bioheat simulation, and (iv) document the cryoprobe layout and the overall defect. The cryoprobe layout characterized by the minimum defect among n planning attempts tested is considered the global minimum, Dmin(n) , and the corresponding cryoprobe layout is considered the optimal cryoprobe layout among that batch. In practice, batches of up to 160 randomly placed cryoprobes were investigated in this study.
Geometric Model Similarity to a Sphere and an Ellipsoid
As one measure of cryoprobe layout planning difficulty, the defect value was compared with the extent to which the prostate model deviates from a sphere and, independently, from an ellipsoid. In the sphere case, its volume was selected to be equal to that of the prostate model, while two alternatives were considered for determining the origin of the sphere: (1) the prostate model volumetric center and (2) the center is displaced such that a minimum distance mismatch will be created between the model and the sphere. For the first alternative, the center of the sphere was simply snapped to the volumetric center of the prostate model, which was determined from the corresponding stereolithography file. Here, the average normal distance from the sphere to the prostate shape was documented as a measure of deviation from an ideal spherical target for planning. For the minimum mismatch alternative, the center of the sphere was further varied until the average normal distance from the sphere to the prostate shape was minimized. Here, the offset from the sphere center to the volumetric center of the prostate model was also documented.
A similar procedure was employed for the analysis of mismatch between the prostate geometry and an ellipsoid. Here, the ratios of the ellipsoid principle axes were set identical to the maximum length ratios of the prostate model in the respective directions. Table 1 lists the relevant geometric parameters of prostate models used in the study.
Cryoprobe Convex Hull
Once a cryoprobe layout was created by means of bubble packing, a cryoprobe convex hull (CCH) was created. This convex hull represents an envelope containing the active surface of all cryoprobes. The CCH was then compared with the prostate geometry using the Hausdorff distance, which essentially measures how far two subsets of a metric space are from each other. 35 Similarities between the prostate model shape and the CCH could yield guidelines for the placement of cryoprobes, while simplifying the cryosurgery planning process.
Results and Discussion
Number of Cryoprobes
Figure 3 displays the variation in defect value as a function of the cryoprobes number, for the 9 models analyzed in this study. Defect values in Figure 3 are based on 140 consecutive runs for each combination of model and number of cryoprobes; the consecutive runs only vary by the random initial placement of the cryoprobes. The justification for the number of consecutive runs is provided below. As can be expected, the increasing number of cryoprobes generally leads to a decreasing defect value, although some perturbations along these curves can also be observed. Here, it is reminded that the bioheat simulation is terminated at the point of minimum defect—external and internal combined—and it is expected that an increasing number of cryoprobes in a limited space may lead to the resulting variations.

Although it may not be clinically feasible, the number of cryoprobes was extended up to 35 on selected prostate models for the purpose of the current study. It was observed that the trend of decreasing defect with the increasing number of cryoprobes asymptotically reaches a constant value around 35 cryoprobes. However, the added benefit for such a high number is marginal, as can be seen from Table 2.
Defect Volume for Selected Prostate Models and a Varying Number of Cryoprobes.

Planning Batch Size in Search for Global Minimum Defect
Similar to other planning algorithms for the optimal cryoprobe layout, the bubble packing algorithm may be dependent on the initial condition for optimization, as described below. Bubble packing is a physical-based method, simulating the movement and growth of bubbles due to van der Waals-like forces. The number of bubbles is equal to the number of cryoprobes. The bubbles are seeded randomly in the domain and continue to grow uniformly and move until reaching a force equilibrium within a hollow shape outlined by the prostate capsule. Once force equilibrium is reached, cryoprobes are placed at the center of the bubble and a bioheat transfer simulation follows, completely oblivious to the actual shape of each bubble. Depending on the initial condition, bubbles may be trapped or be restricted by the prostate contour and the urethra, which may result in less than ideal planning.
One strategy in seeking the best cryoprobe layout is running the bubble packing algorithm multiple times, subject to random initial conditions, while picking up the layout resulting with the lowest defect region volume. The number of consecutive runs needed to find an absolute defect minimum is, however, not known. For example, Figure 4 displays rank-order results from up to 160 consecutive bubble planning results on one of the prostate models for 7 and 14 cryoprobes. Five batches of simulations are displayed in each figure, based on 20, 60, 100, 120, 140, and 160 planning attempts, where each batch is completely independent of the other. Table 3 lists best results from 3 additional prostate models selected. In general, it can be seen that a larger number of consecutive runs in a batch does not always guarantee a smaller global minimum, but the variations in the global minimum between batches becomes smaller with the increasing size of the batch. It can further be seen from Table 3 that a simulation batch size greater than 100 was required to get a defect value which is less than 5% of the smallest possible global minimum among all batches tested. This percentage is translated to 2 cm3 or less of the prostate volume, which exceeds clinical precision in controlling the cryoprocedure by means of transrectal ultrasound imaging. Note that running 100 planning attempts using an efficient, graphics processing unit (GPU)-based computation can be performed within seconds. 31

Rank-order defect for n computerized planning attempts for Model 6, starting from a random initial cryoprobe layout subject to (a) 7 cryoprobes and (b) 14 cryoprobes.
Summary of Minimum Defect Differences, Ddiff , Between a Global Minimum Defect Value, Dmin(n) , and the Minimum Value of Defect Calculated From all the Batches Combined.

Target Region Shape and Defect Size
Computerized training studies 14,27 have demonstrated that different prostate models represent different levels of difficulty for cryosurgery planning. One possibility is that this level of difficulty is associated with the size of the defect for the optimal cryoprobe layout. Another possibility is that a more symmetrical prostate geometry is easier to handle as a target region, with a sphere being an ideal target. Another possibility is that an ellipsoidal shape may be an easier target for planning, consistent with the elongated frozen region around a single cryoprobe. Note that the active cooling surface area of the cryoprobes under consideration is 1.3 mm in diameter, 20 mm in length, and yields an egg-like shape of a frozen region. Although this study is not directly aimed at the correlation between the defect size and the difficulty of training, it seeks to find possible trends between the defect size and key geometric properties of the prostate.
Table 4 lists the global minimum defect value across all batches tested for 14 cryoprobes, for each prostate model used in this study. Table 4 also lists the average distance between the prostate contour and a sphere having an identical volume. In each case, the average distance was measured in two ways: with reference to the sphere (perpendicular to the spherical shell) and with reference to the prostate (perpendicular to the prostate capsule). Furthermore, two principle spherical cases were considered, one with the geometric center of the prostate coinciding with the center of the sphere and the other with the center of the sphere displaced, such that the average distance between the prostate and the sphere is minimized. Finally, Table 4 lists the average distance between the prostate contour and an ellipsoid, where its center was placed in a similar manner to the above two cases for the sphere. The axes ratios of the ellipsoidal shape were maintained identical to the ratio of maximum prostate lengths along the principle axes.
Average Distance Between the Prostate Model Shapes and Simplified Geometries of a Sphere and an Ellipsoid Having Equal Volumes, Using 14 Cryoprobes and Variable Insertion Depth Strategy.a
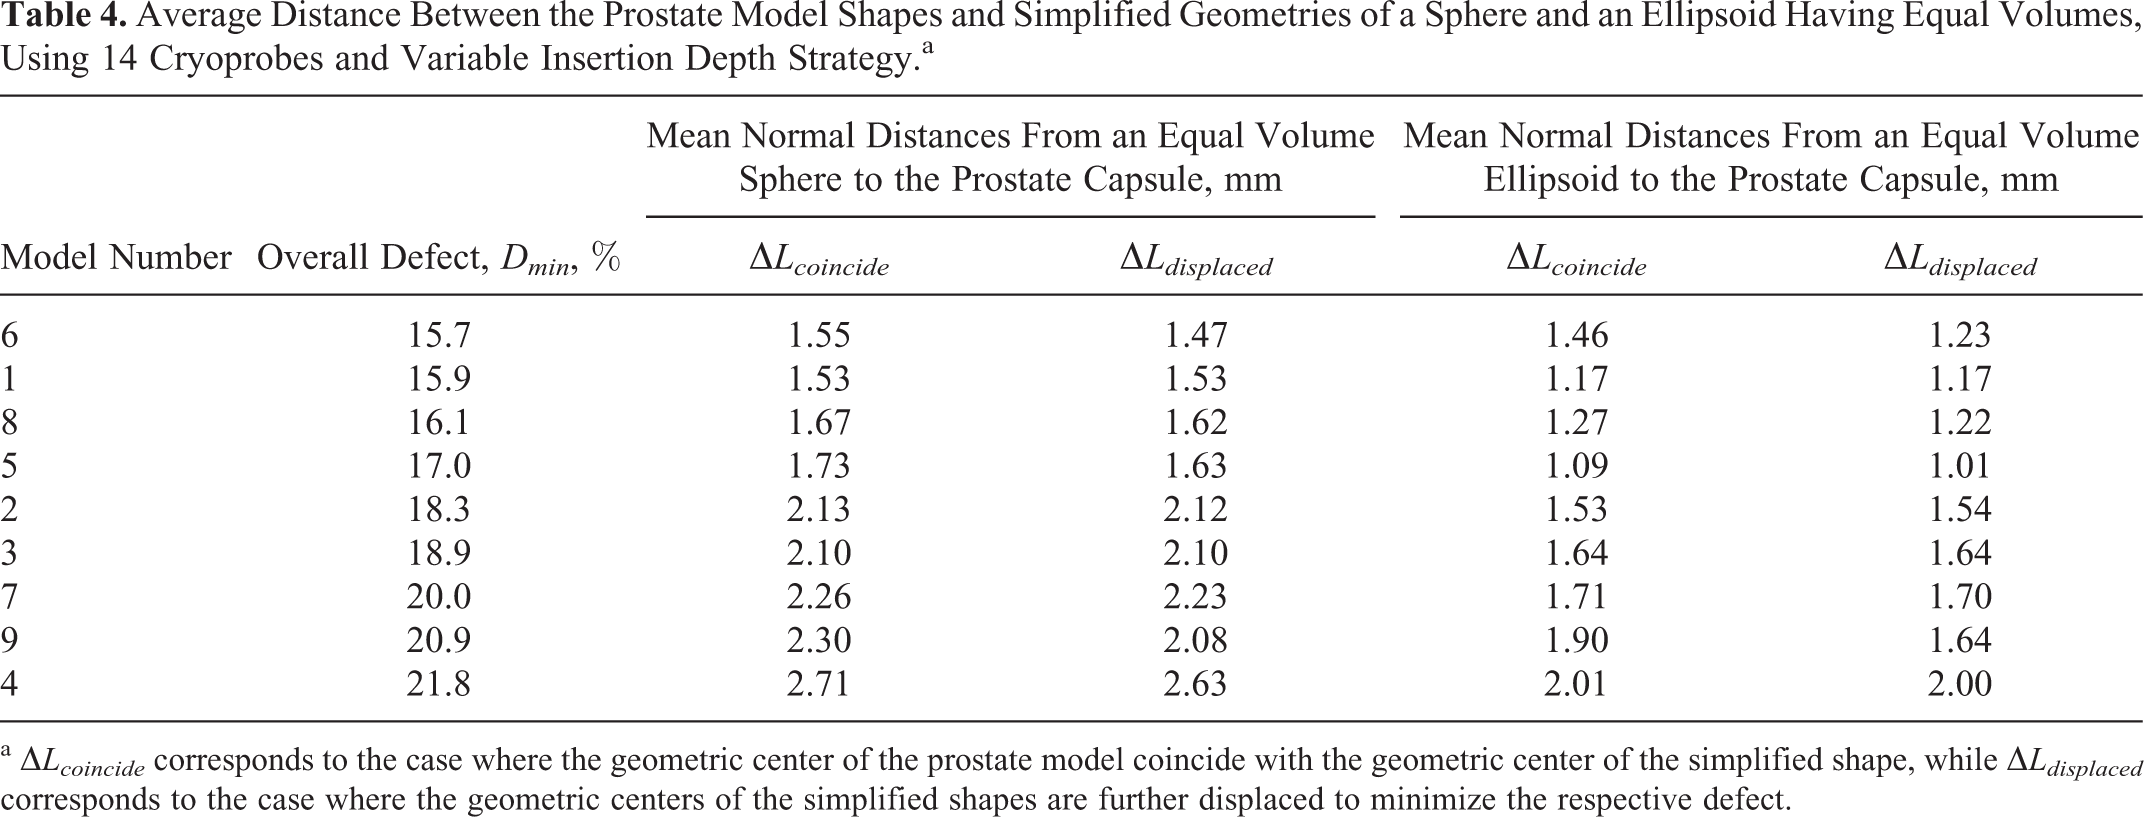
a ▵Lcoincide corresponds to the case where the geometric center of the prostate model coincide with the geometric center of the simplified shape, while ▵Ldisplaced corresponds to the case where the geometric centers of the simplified shapes are further displaced to minimize the respective defect.
A general trend arises from Table 4 that the mean normal distance between the prostate capsule and a sphere of the same volume increases with the increasing defect in planning. It appears that the case of coincided geometric centers displays a better correlation, but the differences are unremarkably small. Furthermore, a better correlation between the defect size and comparison of the prostate to a sphere is observed, as opposed to the comparison of the prostate with an ellipsoid. The small differences for each model and shape between ▵Lcoincide and ▵Ldisplaced indicate that the prostate models are relatively symmetric. Note that the displacement value ranged between 1 and 2 mm.
Although the average values presented in Table 4 are small in an absolute scale and of the same order of the resolution in medical imaging, it is important to note that one of the purposes of this investigation is to find a correlation between simplified geometric shapes and the overall defect value. This in turn can be applied as an indicator for the level of difficulty in computerized planning and training. By comparing the results listed, namely, Table 4 and Figures 1 and 2, it can be observed that the location of the urethra and the symmetry of the prostate model with respect to the urethra affect the minimum defect obtained.
Cryoprobe Convex Hull
The CCH represents an envelope of all the cryoprobes simulated in a specific procedure (Figure 5). A wide range of simulation was conducted in search for the relationship between the CCH and the prostate model shapes when the cryoprobe layout is optimal. These simulations focused on 4 models: Models 1 and 6, which yielded the smallest defect size, and Models 4 and 9, which yielded the largest defect size (Table 4). The CCH analysis for each model was conducted for 7, 10, and 14 cryoprobes. Since the final defect for any specific case is affected by the initial condition (Figure 4), both the best-case and the worst-case scenarios were considered. For Model 6, which is characterized by the smallest possible defect, the investigation was further expanded to the unrealistic large number of cryoprobes of 35 to study the lowest limit of defect. For this model, the study was further expanded to all cases within 2% defect range above the global minimum (Figure 4).

Cryoprobe convex hull (CCH), which is a subdomain containing all the cryoprobes in an optimized cryoprobe layout: Model 6 (a-c) with 14 cryoprobes (d = 15.2%); Model 1 (d-f) with 14 cryoprobes (d = 15.9%); Model 9 (g-i) with 10 probes (d = 24.5%); and Model 4 (j-l) with 14 probes (d = 18.9%). The red dots correspond to the center of the active surface of the cryoprobes.
Although space limitations prohibit the presentation of all possibilities in this wide-range parameter investigation, the resulting key observations are summarized below. Here, the Hausdroff distance 35 between the CCH and the prostate capsule is calculated, where ΔL H is its mean value and ΔL HRMS represents its root mean square. Simulation results show that ΔL HRMS of the range of 7 to 9 mm is typically found between the CCH and the prostate capsule. This suggests that a good initial condition for computerized planning could be established by placing all cryoprobes in a subdomain smaller by 7 to 9 mm from the prostate capsule for the average prostate volume of 35 cm3 (typical to prostate cryosurgery candidates). A random initial distribution of cryoprobes within the CCH shortened the computerized planning process and decreases the number of consecutive runs in search for the global optimum layout, regardless of the number of cryoprobes.
For example, two computer-generated cryoprobe layouts for Model 6 were compared for the case of 14 cryoprobes. Here, the global minimum defect is d = 15.15%, while the second best layout resulted in d = 15.27%. Although no similarities in specific cryoprobe locations could be identified between the two cases, ΔLH between the CCH of both layout was only 1.1 mm. This solidifies the notion that the geometrical relationship between the CCH and the target region shape is a critical parameter for planning. This strategy seems beneficial also for the case of traditional training without the assistance of computation tools.
Simulated Time of Cooling
In the absence of prostate-specific planning and operation, clinical practice often resorts to a predetermined cryoprobe cooling time, such as 10 minutes. 36 In the case of repeated freeze–thaw cycles, 10 minutes of initial cooling may be followed by 5 minutes of active rewarming and 5 minutes of a second cooling period 10 or followed by 5 minutes of passive rewarming and 10 minutes of a second cooling period. 36 Although these best practices may be related to an average prostate shape and size, and to specific hardware, computerized planning can offer model-specific planning.
Table 5 displays the cooling duration for the simulated cryoprocedures listed in Table 2. The tailored cryoprobe layout for each prostate shape resulted in a different simulated cooling period until minimum defect is achieved. When evaluating these results, it is important to note that (a) while all the evaluated prostate models are of similar size, their shapes vary significantly, as can be observed from Figures 1 and 2; (b) 35 cm3 may be considered as the upper limit for a prostate volume to be treated by cryotherapy, where a smaller prostate will call for a shorter cooling period while a larger prostate may require an additional treatment to shrink its size before operation; (c) the optimal cryoprobe layout has only a minor effect on the planning isotherm, 19 but a lower planning isotherm may increase the cooling time; and (d) the cryoprobe layout investigated is of a variable insertion depth, which is not frequently used in clinical practice but which yields lower defect values. 19 The pull-back procedure requires a longer overall operation time.
Simulated Cooling Period to the Point of Minimum Defect for the Cases Listed in Table 2.

It can be concluded from Table 5 that the cryoprobe cooling time is inversely proportional to the number of cryoprobes. Although the computer suggested cooling time varies among the prostate models, this variation decreases with the increasing number of cryoprobes. Of the results displayed in Table 5, 14 cryoprobes yield the closest cooling period to the 10-minute cooling period suggested in some publications for clinical practice. 10,36 As exampled in the Methods section above in the context of the Number of Cryoprobes and Placement Constraints, a pull-back procedure with 9 cryoprobes when 5 of them are pulled back to new locations in a second operation cycle should also be considered as 14 cryoprobe locations for the purpose of comparison with the current study. Clearly, prostate-specific computerized planning does not only result with an optimal cryoprobe layout but also in a layout-specific cooling time.
Summary and Conclusion
This study aims to explore possible relationships between various prostate shapes, the number of cryoprobes, and the difficulty to create an optimal computer-assisted plan. This study is based on a computerized planner, 17,28 which is a part of a previously developed prototype for a computerized training tool for cryosurgery. 14,27,37 The quality of planning is measured by the overall defect region, 20 a proprietary concept combining undercooled internal areas to the target region and overcooled areas external to it. An optimal cryoprobe layout is assumed to be associated with the minimum defect among all possible cryoprobe layouts tested. When starting from a random cryoprobe placement, over 120 consecutive computerized planning trials may need to be executed before the global minimum defect layout is found at an accuracy relevant to ultrasound imaging (1 mm uncertainty).
Results of this study indicate that, consistent with a common concept, the overall defect volume decreases with the increasing number of cryoprobes, regardless of the geometry of the prostate. However, the number of cryoprobes required to achieve the smallest possible defect may be unrealistically high (up to 30). Results of this study demonstrate that prostate-specific computerized planning does not only result with an optimal cryoprobe layout but also in a layout-specific cooling time. This optimal cooling time is dependent on the prostate shape and the specific cryoprobe layout, which stands in contrast to a commonly considered clinical practice of a universal cooling periods for all cases.
Results of this study also demonstrate that the optimal cryoprobe layout is associated with a smaller defect for symmetric prostate geometries and, independently, for prostate models that better resemble a sphere. Furthermore, a smaller defect is achieved when the urethra passes through the center of the prostate model. These conclusions can be used in generating target shape models of various difficulty levels for planning by computation means. 37
Since the duration of a computer-generated plan is dependent upon random initial conditions, a possible large batch of different cases may need to be screened before the best possible cryoprobe layout is identified. The size of the same batch can be reduced significantly by creating a subdomain, which is similar to prostate capsule shape but smaller in dimensions (7-9 mm from all sides). This subdomain is expected to contain all the cryoprobes at the end of the computerized planning process. Creating such a subdomain may also be beneficial during traditional cryosurgery training, when computerized planning tools are absent.
Footnotes
Abbreviations
Declaration of Conflicting Interests
The author(s) declared no potential conflicts of interest with respect to the research, authorship, and/or publication of this article.
Funding
The author(s) disclosed receipt of the following financial support for the research, authorship, and/or publication of this article: This study has been supported in parts by Award Number R01CA134261 from the National Cancer Institute. The content is solely the responsibility of the authors and does not necessarily represent the official views of the National Cancer Institute or the National Institutes of Health.