
Abstract
Objective:
In current practice, medical experts use the pathological stage predictions provided in the Partin tables to support their decisions. Hence, the Partin tables are based on logistic regression built from the US data. In the present study, we developed a data-mining model to predict the pathologic stage of prostate cancer. In this newly developed model, using the classification and regression tree-particle swarm optimization analysis of the Korean population data, we aim to improve the prediction accuracy of the pathologic state of prostate cancer.
Method:
A total of 467 patients from the smart prostate cancer database were evaluated. The results were intended to predict the pathologic stage of prostate cancer: organ-confined disease and non–organ-confined disease. The accuracy of 4 classification and regression tree-particle swarm optimization models was compared; furthermore, the models were validated with the Partin tables using the receiver operating characteristic curve.
Results:
Among the 467 evaluated patients, 235 patients had organ-confined disease and 232 patients had non–organ-confined disease. The area under the receiver operating characteristic curve of the proposed classification and regression tree-particle swarm optimization model (0.858 ± 0.034) was larger than the 1 in the Partin tables (0.666 ± 0.046).
Conclusion:
The proposed classification and regression tree-particle swarm optimization model was superior to the Partin tables in terms of predicting the risk of prostate cancer. Compared to the validation of the Partin tables for the Korean population, the classification and regression tree-particle swarm optimization model resulted in a larger receiver operating characteristic curve and a more accurate prediction of the pathologic stage of prostate cancer in the Korean population.
Keywords
Introduction
Globally, about 680 000 men are diagnosed with prostate cancer annually, which makes prostate cancer a most common disease in men. 1 In addition, 40% to 50% of men are estimated to have a potential extra prostatic disease. 2 In the United States, prostate cancer ranks the second in terms of death rate among the other cancer types. Since 2003, the incidence of prostate cancer in males ranks the fifth in terms of its death rate in South Korea. 3 In addition, prostate cancer increases with the tumor incidence and aging of the population.
Among numerous methods of treatment of prostate cancer, prostatectomy and radiotherapy are the most effective treatments for patients with prostate cancer. 4 The effective treatment of prostate cancer requires accurate determination of the clinical data. Here, pathology staging is an important factor that influences the choice of the most suitable method for prostate cancer treatment. 5 For that reason, accurate prediction of the pathology stage before surgery is important to choose an effective prostate cancer treatment. 6
Nomogram is a pathology stage prediction method, which can be applied to the patient population and includes the interval of the pathology staging-related data. 7 –9 However, nomogram is restricted to specific data interval, so it is not useful and valid. Also, applying nomogram to the Korean population can be different in case of clinical variability of prostate cancer. In particular, clinical experience of localized prostate cancer and seminal vesicle infiltration varies considerably between Asian and Western populations; in this context, applying nomogram to the US population is inadequate. 10
The Partin tables are a method designed by nomogram’s linear regression technique, a most popularized technique. 11,12 The Partin tables use prostate-specific antigen (PSA), Gleason score, and clinical stage to predict the pathology stage. The Partin tables have been verified from 2001 to 2011, although the question remains about its applicability to the Korean and, more generally, Asian population. 6,13 Therefore, for an accurate prediction of the pathology stage, it is necessary to have a decision-making method that would be applicable to the Korean population.
Up to now, numerical indicators are being developed for the decision-making method of prostate cancer. There are representative analysis methods for prostate cancer prediction, such as univariate analysis, multivariable analysis, neural network, and classification and regression tree (CART) analysis, among others. Univariate analysis is simple, as it uses the basic statistics technique, and is easy to apply to the medical system. However, the limitation of univariate analysis is its lack of accuracy. Logistic regression (LR) is one of the multivariate analysis techniques that was applied to the nomograms and Partin tables. This method has a high prediction accuracy for prostate cancer but faces challenges in cases of complex variable relations. Finally, neural network is easy to apply to complex variable relations and is high in accuracy of prediction. 14,15 However, the generated interpretation of the neural network model is very difficult. In addition, it is also difficult to apply to the medical system, as which the variables demonstrate effectiveness cannot be determined. 16 Classification and regression tree analysis is a decision-tree method. It is high in accuracy of prediction and can determine which specific variable demonstrates effectiveness, which makes it easy to interpret the finally generated prediction model. 17,18 Thus, CART is an appropriate method for the prediction of prostate cancer, as it is easy to apply to the medical system. 19,20 For this reason, this study uses the data-mining technique using the CART decision tree to predict the pathology stage of prostate cancer.
Several previous studies sought to predict the pathology stage of prostate cancer using the data-mining technique. For instance, Matsui used the artificial neural network analysis (ANNA) and demonstrated that its accuracy is higher than that of LR and the Partin tables, when it comes to prediction probability in the Japanese population. 5,21 Input variables in ANNA are age, serum PSA, PSA density, Gleason score, positive scores, cancer length (mm), and clinical T stage. Furthermore, Olivier et al used machine-learning methods such as support vector machine, multilayer perceptron, radial basis function networks, and so on, to predict and classify the pathological stage of prostate cancer in the British population. Among many machine-learning methods, Bayesian network model particularly enhanced prediction accuracy of the prostate cancer. 22 Tsao et al used artificial neural network (ANN) to predict the pathology stage of prostate cancer in the Taiwanese population. Tsao et al study has input variables such as age, body mass index (BMI), PSA, biopsy Gleason sum, primary Gleason grade, digital rectal examination, and transrectal ultrasound and produces a more accurate model than those available with LR and the Partin tables. 6 Furthermore, Maria et al used the fuzzy expert system to reduce the uncertainty of the existing methods in predicting the pathologic stage of prostate cancer. 23 Also, using the genetic-fuzzy algorithm, Castanho et al demonstrated its enhanced performance in terms of predicting the pathology stage of prostate cancer. 24 A genetic-fuzzy system uses the extraction of fuzzy rule and optimized fuzzy membership function and represent a higher performance than the Partin tables. Considering the increase in the number of patients with prostate cancer in Korea, it is necessary to have an accurate method to accurately predict prostate cancer. Input variables used in the present study are PSA, Gleason score, and clinical T stage. Decision tree has a high accuracy and has the advantage of being easy to understand. However, it uses the greedy algorithm to create a tree. Therefore, as a way to focus on the statistical nature of certain data, it tends to fall into local optimization. In order to access the global optimization which takes all the data into account, an appropriate optimization technique should be applied.
The present study aims to predict the pathology stage of prostate cancer in the Korean patients using the data-mining method (CART model). The CART analysis uses Gini index and is based on the binary recursive partitioning method. In order to increase the prediction accuracy of the pathology stage of prostate cancer by optimizing the model generated from CART toward the global optimization, the particle swarm optimization (PSO) algorithm was applied. Particle swarm optimization is a method for optimizing the continuous nonlinear functions and applies the search algorithm to find the optimum solution in a multidimensional search space.
The CART builds a decision tree and classifies subsets into organ-confined disease (OCD) and non–organ-confined disease (NOCD). In this study, we generate a prediction model that is suitable for the Korean population using CART. Our second aim is to increase the accuracy of the prediction model by accessing global optimization through the tree-structure optimization attained by applying PSO on the prediction model generated from CART (CART–PSO).
This study is the first to suggest a prediction model of the pathology stage of prostate cancer in the Korean population. For the verification of the CART–PSO model, we compare ANN, simple CART, and the Partin tables (2005-2011), with LR using the receiver operating characteristic (ROC) curve. This article is structured as follows. Materials and Methods section describes the data set and proposes the method. Results section outline the system implementation and compares its ability to discriminate prostate-confined cancer and probability tables. Discussion section provides a discussion of the proposed method. Finally, Conclusion section describes the conclusion and specifies further directions in future research.
Materials and Methods
The study data comprised a total of 467 male patients extracted from the Smart Prostate Cancer Data Base at Seoul St. Mary’s Hospital between February and November 2013, 25 and the study protocol was approved and carried out in accordance with the approved guidelines by the institutional review board (IRB) at the Catholic University of Korea (IRB approval no. Kc14rimi0676). Six input variables—age, BMI, initial PSA value, percentage of the number of positive core (%), clinical Gleason score (sum), and clinical T stage—and 2 output variables—pathologic T stage and N stage—were used.
Preprocessing of the output variables in the analysis of 467 patient data uses the variables of pathologic T stage (pT2a, pT2b, pT2c, pT3a, pT3b, and pT3c) and N stage (pN1). Output variables are transformed by using the guidelines of the American Joint Committee on Cancer which was used to identify the pathologic stage between OCD (pT2+, 237 patients) and NOCD (pT3+ or N+, 232 patients) groups. 26,27
Classification and regression tree analysis uses the binary recursive partitioning method that produces a decision tree, which identifies a subset of patients at the pathologic stage. The CART model used in this application was the software IBM SPSS Modeler version 14.2. Classification and regression tree analysis was performed on the model building training data set.
Classification and regression tree analysis has important features. First, it can be used to find which output variables belong to the training data. Second, partitioning of variables is done using the Gini impurity measure. 28 Based on the 6 preoperative pathological and clinical variables, we developed 5 CART models to find out the most powerful variables. The first model (CART model 1) includes 3 input parameters, namely initial PSA value, clinical T stage, and biopsy Gleason score, all of which were used in the Partin tables. The second model (CART model 2) includes BMI in addition to the previous 3 variables. The third model (CART model 3) includes the percentage of tumor cores in addition to the previous 4 parameters. In the fourth model (CART model 4), the age and percentage of the number of cores showing tumor traces were added to the previous 3 parameters. In the final model (CART model 5), age, BMI, and percentage of the number of cores showing tumor traces were added to the 6 parameters. The output variable was OCD or NOCD. The organization of all CART models is shown in Table 1.
The CART Models.

Abbreviations: BMI, body mass index; CART, classification and regression tree; PSA, prostate-specific antigen.
Particle swarm optimization is a method belonging to the heuristics as one of the optimization techniques. Like an algorithm, heuristics does not require a specific end condition and is terminated when a specified number of iterations is met. Particle swarm optimization is used to perform the global optimization problems based on the community theory of objects. Therefore, it is used to solve the problem of local optimization in a decision tree. The procedures performed in PSO are as follows.
First, one configures the data that one wants to search for in the particles. Then, for the ith particle located in an arbitrary location

where, i = 1, 2,…, N, N denotes the size of the entire community and w, c
1, and c
2 are the weights of each term as positive real numbers, r
1 and r
2 are random numbers between 0 and 1, and n is the current calculation step. By sharing the optimum positions
The nonparametric Mann-Whitney U test, confusion matrix, and the ROC curve were used to compare the mean age, mean BMI, initial PSA, clinical T stage, and biopsy Gleason score, as well as the percentage of the number of total cores showing tumor-positive cores between the OCD and the NOCD groups. The software IBM SPSS Statistics version 22.0 was used for all statistical analyses.
Confusion matrix and ROC curves were used to compare the predictive ability. Confusion matrix evaluates the performance of the classifier (Table 2). As shown in Equation 2, the accuracy, sensitivity, specificity, positive predictive value, and negative prediction value (NPV) were measured. The ROC curve compares sensitivity versus specificity along a range. The limit of significance for all tests was set at P < .05.

Confusion Matrix.
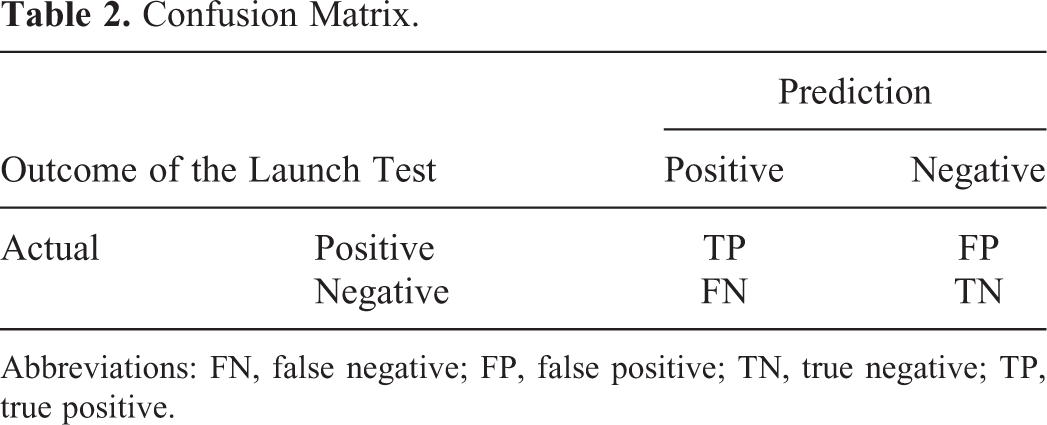
Abbreviations: FN, false negative; FP, false positive; TN, true negative; TP, true positive.
Results
Patients’ Characteristics
The median age of the 467 patients was 71 years (range: 48-85; mean: 69.94). Median OCD and NOCD of age was 69 years (range: 48-84; mean: 68.46) and 73 years (range: 54-85; mean: 71.41). The median BMI was 23.66 (range: 16.53-38.06; mean: 23.80). Median OCD and NOCD of BMI was 23.18 (range: 16.53-33.31; mean: 23.17) and 24.38 (range: 17.31-38.06; mean: 24.43). The median initial PSA value was 7.3 ng/mL (range: 0.67-128.60; mean: 11.591). Median OCD and NOCD of initial PSA was 5.51 ng/mL (range: 0.669-27.3; mean: 6.638) and 10.28 ng/mL (range: 2.3-128.6; mean: 16.61). The proportion of the patients with PSA ≤4.0, 4.01 to 10.0, 10.01 to 20.0, and ≥20.01 ng/mL was 12.42% (58 patients), 54.39% (254 patients), 20.03% (94 patients), and 13.06% (61 patients), respectively. The difference between the 2 groups (OCD and NOCD) in age, BMI, initial PSA, and positive core (%) was significant: P = .009 (age), P = .068 (BMI), = .0 (initial PSA), and P = .0 (percentage of positive core). The median biopsy showing the percentage of the number of tumor-positive cores was 37.5% (range: 1%-100%; mean: 43.85%). Median OCD and NOCD of positive core (%) was 21.05 (range: 1-100; mean, 24.68) and 69.23 (range: 5-100; mean: 63.28). Biopsy tumor grade was classified as Gleason score (sum) 2 to 4, 5, 6, 7a (pri 3+ sec 4), 7b (pri 4 + sec 3), and 8 to 10 in 0.43% (2 patients), 0.86% (4 patients), 47.97% (224 patients), 19.06% (89 patients), 18.20% (85 patients), and 13.49% (63 patients), respectively. The 467 patients were classified clinically as stage T1c (79 patients), T2a (106 patients), T2b (87 patients), T2c (131 patients), T3a (41 patients), and T3b (23 patients). The distribution of preoperative parameters between the patients with OCD and NOCD is shown in Table 3.
Distribution of Preoperative Variables Between Patients With OCD and NOCD.

Abbreviations: BMI, body mass index; NOCD, non–organ-confined disease; OCD, organ-confined disease; PSA, prostate-specific antigen.
Experimental Results
The experiment was divided into training data set (70%, OCD: 328 patients, NOCD: 161 patients) and validation data set (30%, OCD: 141 patients, NOCD: 71 patients) to measure performance. Table 4 presents the comparison results of 5 CART models, ANN, LR, Partin tables, and the proposed CART–PSO model (with regard to accuracy, sensitivity, specificity, positive prediction value [PPV], and NPV using the confusion matrix). The CART models, ANN, CART–PSO, and LR show a much better accuracy than the Partin tables (66.43%).
The Area Under Confusion Matrix.

Abbreviations: ANN, artificial neural network; CART, classification and regression tree; CART–PSO, classification and regression tree-particle swarm optimization; LR, logistic regression; NPV, negative prediction value; PPV, positive prediction value.
The sensitivity of CART model 5 (82.09%) is higher than that of the other models. The specificity of CART–PSO (90.48%) is higher than that of the other models. The PPV of ANN and CART–PSO (91.30%) is higher than those of the other models. The NPV of CART–PSO (80.28%) is higher than those of the other models.
Therefore, the accuracy, specificity, PPV, and NPV of CART–PSO (85.71%, 90.48%, 91.30%, and 80.28%, respectively) are higher than those of the others models. The CART model 4 has a higher accuracy than the other CART models. Therefore, CART–PSO was optimized using the predictive CART model 4.
The area under the ROC curves is summarized in Table 5. The CART model 1 (0.786 ± 0.040) was larger than the Partin tables (0.666 ± 0.046; Figure 1A). With an additional one, and more variables, the area under the ROC curve of CART model 2 (0.730 ± 0.043), CART model 3 (0.800 ± 0.039), CART model 4 (0.836 ± 0.036), and CART model 5 (0.814 ± 0.038) was larger than the corresponding area under the ROC curve of the CART model 1 (Figure 1B). However, the area under the ROC curve of CART model 5 decreased to 0.814 (±0.038) and the Korean patients’ BMI did not contribute to an increase in predictability in the present study. Therefore, CART model 4 is better than ANN, LR, and the Partin tables (Figure 1C).
The Area Under ROC Curve.
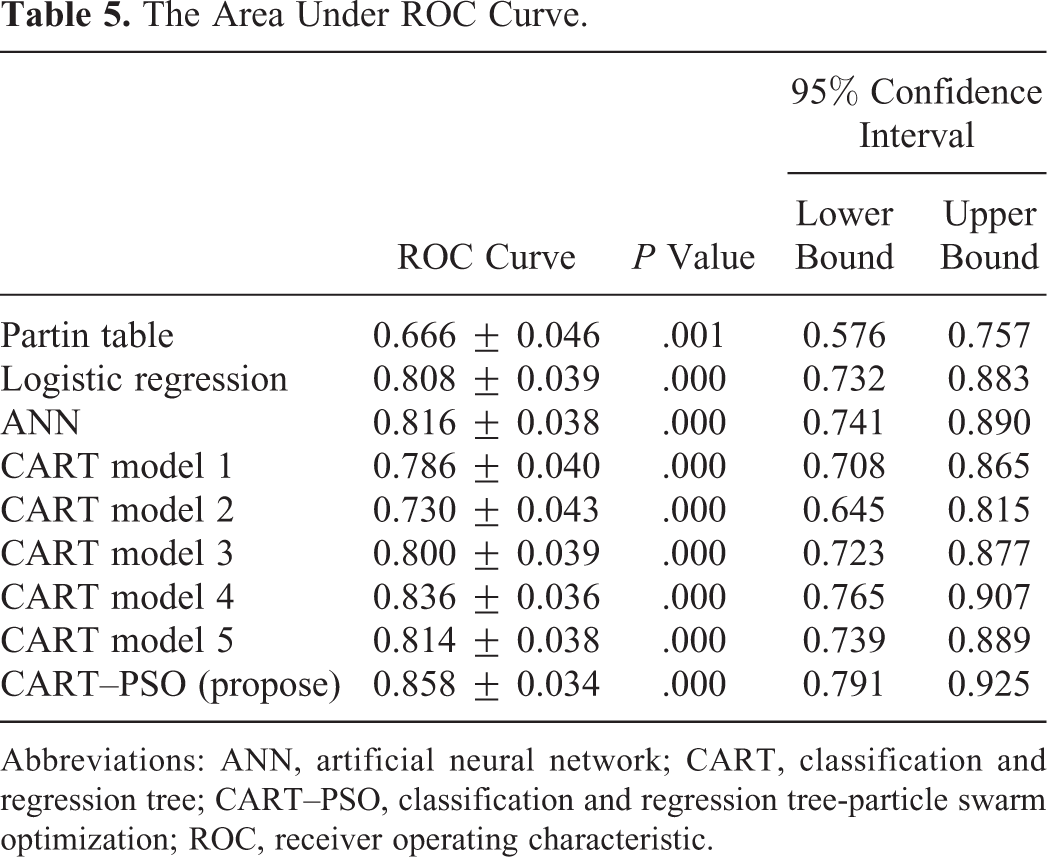
Abbreviations: ANN, artificial neural network; CART, classification and regression tree; CART–PSO, classification and regression tree-particle swarm optimization; ROC, receiver operating characteristic.
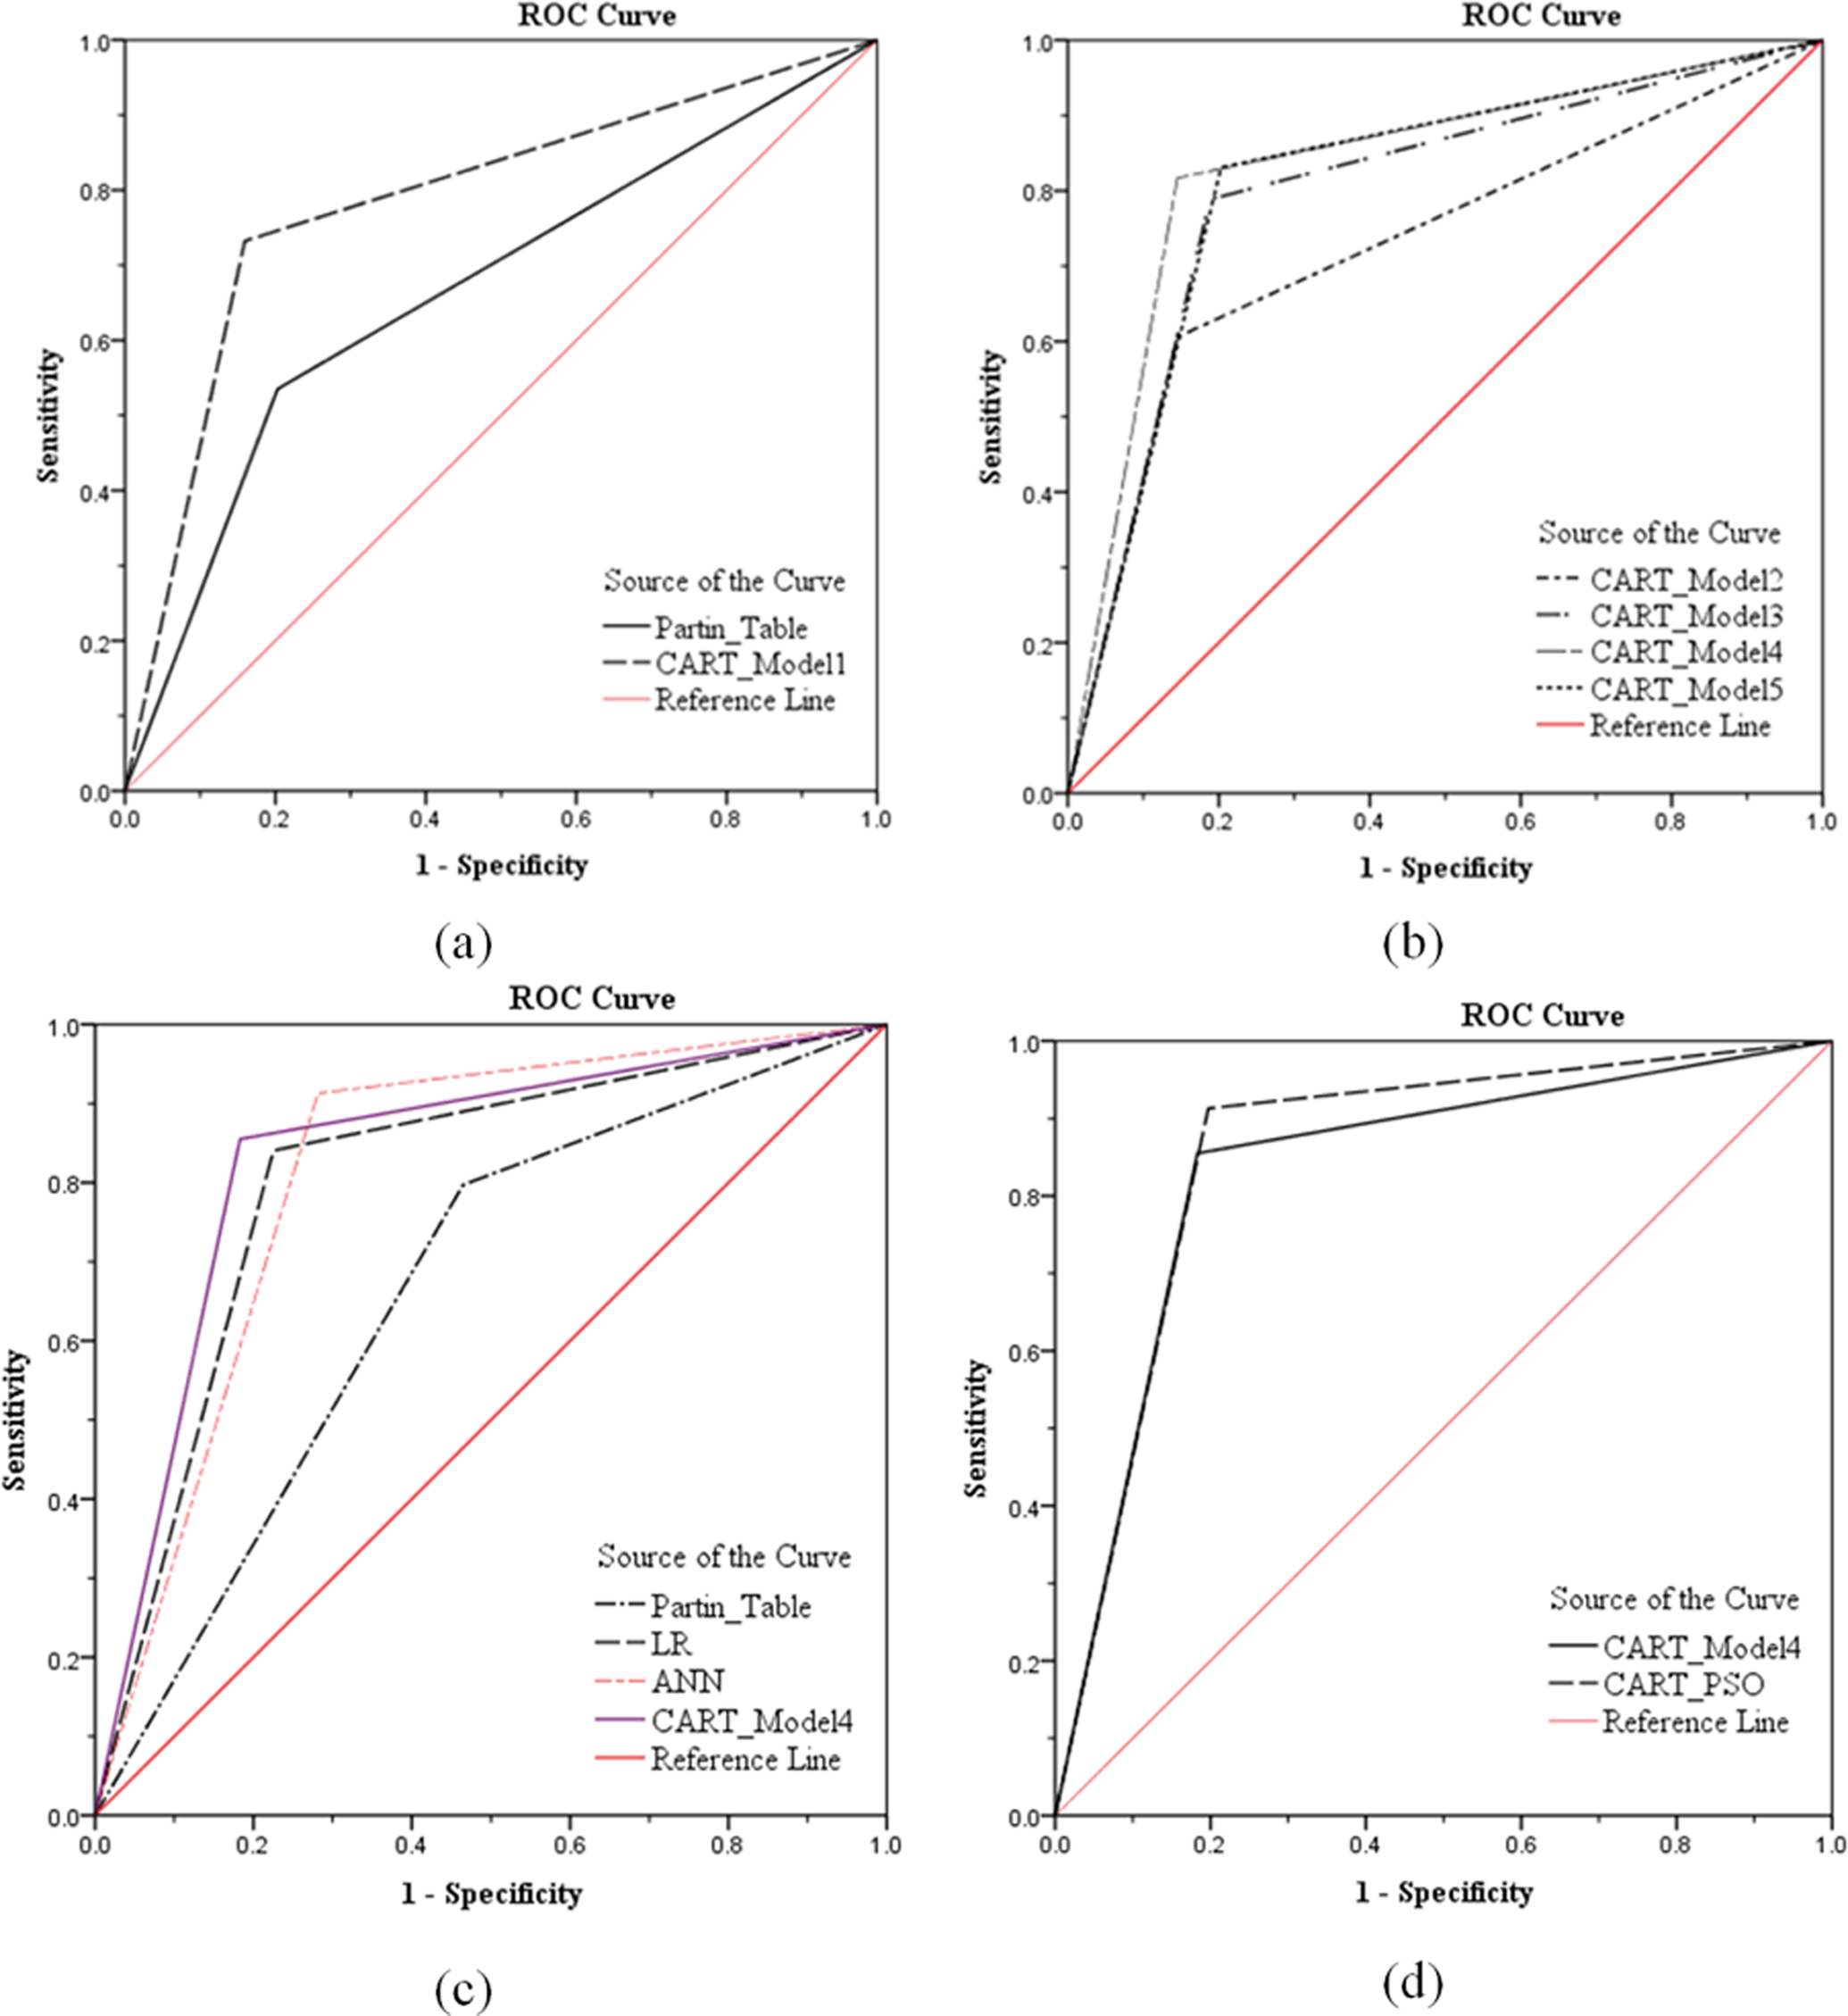
Area under the receiver operating characteristic (ROC) curve. A, ROC curves for each analysis with classification and regression tree (CART) model 1 and the Partin tables in the validation data set. B, ROC curves for CART models 2, 3, 4, and 5. C, ROC curves for CART model 4, logistic regression (LR), and the Partin tables. D, ROC curves for CART model 4 and classification and regression tree-particle swarm optimization (CART–PSO).
Also, CART–PSO optimization by CART model 4 has the highest accuracy score (0.858 ± 0.034; Figure 1D). It can be seen that CART–PSO is the most effective as compared to other models (Figure 1).
Classification and Regression Tree-Particle Swarm Optimization Model
The best model of the CART–PSO procedure was carried out on the training set (329 patients). Variables such as age, initial PSA, Gleason score, clinical T stage, and percentage of the number of cores showing tumor traces were used to determine the prostate stage prediction. The detail decision tree of CART–PSO is shown in Figure 2. For example, the root node selected a percentage of the number of cores cutoff level of over 45.8% alone for the identification of child nodes (node 1, node 2). The node 1 selected a percentage of the number of cores cutoff level of over 24.04 mg/mL and node 3 selected a Gleason score cutoff level of over 7 alone for the identification of OCD. Using 2 cutoff values, 52.41% (sensitivity) of OCD (87 of 166 patients) was identified for further analysis, whereas 87 of the 161 (54.04%) participants with NOCD were correctly identified (specificity). Using this root node, node 1 and node 3 of cutoff alone, the percent overall reduction in pathologic stage was 27.83% in the training set (91 of 327 patients). The CART model 4 was found to have an accuracy of 91.44%, sensitivity of 90.02%, and specificity of 92.90% in the training set. The PPV was 93.37% and NPV was 89.44%.

Decision tree (classification and regression tree-particle swarm optimization [CART–PSO]).
Discussion
Decision tree derived from logic, management, and statistics is a very successful technique for predicting and explaining the relationship between the measured value and the target value. Decision tree is a predictive model for displaying the classification and regression models and a powerful technique that can help in decision-making involved in the problems of classification of deductions, prediction, and sequential reasoning. Classification and regression tree is a nonparametric technique that can be applied to the classification analysis using regression analysis techniques. Impurity function is used in order to determine the data group of high homogeneity. Homogeneity indicates that the data are similar in properties and shape, whereas the impurity function means the degree of dispersion, such as the dispersion that occurs among the data.
Substantial research has attempted to predict the pathology of prostate cancer; LR and the neural network were typically used to apply data mining. Both techniques were developed as the main means to increase the accuracy of predictive pathology; however, due to the difficult in the interpretation of the model, they have the shortcomings of difficulty in the decision-making support. In this context, the CART analysis has advantages, such as the ease of interpretation of the model and a high accuracy of prediction.
Many studies have been conducted for the prediction of the pathology staging of the prostate cancer using data mining. The first relevant research in this area was the model proposed by Snow et al 29 that applied the neural network. Accordingly, studies on the Japan and British populations applying data mining have emerged and have demonstrated a higher performances compared to the previous studies which had relied on the Partin tables. Many studies have presented the pattern prediction method applying a statistical approach for pathological prediction and, in order to measure performance, compared the accuracy, sensitivity, specificity, and the ROC curve.
The decision-tree model is characterized by being easy to understand and has been used in many forecasting models showing a high degree of accuracy. However, due to the employment of statistical techniques, the interference for the specific data increases, leading it to easily fall into the local optimization. In this context, a technique that can help resolve the local optimization and ensure the access to the global optimization is required. Particle swarm optimization is 1 of the algorithms of evolutionary arithmetic operation and an optimized technique ensuring the access to a global optimization. Thus, it is possible to reconstruct the tree generated from CART to make the nearest model to the optimal point using the PSO.
The CART–PSO model proposed in the present study has demonstrated a higher predictive value than the Partin tables. In addition, among the shortcomings of the Partin tables is that, in their design, a number of samples depended on a specific population. Also, while 3 variables are used in the Partin tables, the CART model has a predictive value due to the use of 2 additional input variables. The results of the present study confirm that age and the percentage of positive core are significant factors for the pathology prediction of prostate cancer. The CART–PSO model, which applies a total of 5 variables, shows a higher degree of accuracy (85.71%) than the previously used Partin tables and LR.
The results of the present study have confirmed that the percentage of positive core can be one of important variables in the pathology prediction of prostate cancer. Furthermore, BMI has been found to be not critical to the pathology prediction, so it can be seen that there is no seamless relevance between prostate cancer and the body weight. 30
Overall, this study shows that CART–PSO is effective in pathology prediction of prostate cancer. The CART–PSO model has a higher accuracy than the conventional techniques, and the results are presented in the form of a tree which allows for an easy interpretation of the model providing the decision support for the pathology prediction of prostate cancer.
Conclusion
There is the possibility that this CART–PSO analysis method will improve the pathology staging of prostate cancer and decision support in the suitable treatment. We found that BMI has low correlation while age and the percentage of positive core has high correlation. The CART–PSO analysis acknowledging such characteristics has been developed, which may aid in the treatment planning of these individuals.
Currently, among many variables on predicting the staging of prostate cancer, 5 variables have been used; however, one can make use of the additional information relating to the detailed medical history and survival time using the tracking data covering many years; this might deliver a great benefit to the patients in terms of predicting, beyond a simple prediction of the staging of cancer, the quantitative survival time. Also, if the CART–PSO analysis model can be applied to diseases other than prostate cancer, a self-diagnosis algorithm or a similar program could be developed and meaningfully applied.
Footnotes
Abbreviations
Declaration of Conflicting Interests
The author(s) declared no potential conflicts of interest with respect to the research, authorship, and/or publication of this article.
Funding
The author(s) disclosed receipt of the following financial support for the research, authorship, and/or publication of this article: This work was supported by the National Research Foundation of Korea (NRF) grant funded by the Korean Government (MSIP, 2016R1A2B4015922).