
Abstract
Objective:
We sought to assess the value of 1.5-T and 3-T magnetic resonance spectroscopy imaging in the diagnosis of prostate cancer by meta-analysis.
Methods:
Prospective studies were selected from MEDLINE, PubMed, Science Direct, OVID, and Springer between January 2004 and June 2014. Studies were reviewed based on Quality Assessment of Diagnostic Accuracy Studies criteria. Any publication bias was assessed using Deek funnel plot asymmetry test. Pooled sensitivities, specificities, positive likelihood ratios, negative likelihood ratios, and 95% confidence intervals were calculated. Summary receiver–operating characteristic curves were used to assess the results.
Results:
A total of 17 articles were included in this study. The area under the curve values of 1.5-T magnetic resonance spectroscopy imaging with the use of an endorectal coil, 1.5-T magnetic resonance spectroscopy imaging without the use of an endorectal coil, and 3.0-T magnetic resonance spectroscopy imaging without the use of an endorectal coil were 0.90 ± 0.03, 0.75 ± 0.03, and 0.93 ± 0.02, respectively.
Conclusion:
Three-tesla magnetic resonance spectroscopy imaging without the use of an endorectal coil and 1.5-T magnetic resonance spectroscopy imaging with the use of an endorectal coil both had similar applied values compared to the lower applied value of 1.5-T magnetic resonance spectroscopy imaging without the use of an endorectal coil.
Introduction
Prostate cancer (PCa) has been the second leading cause of cancer death in men 1,2 and is an increasingly serious health problem. Magnetic resonance imaging (MRI) has been widely used in the diagnosis, staging, and follow-up of PCa. 3 Magnetic resonance spectroscopy imaging (MRSI) is of great clinical value, as it features high resolution that can display the anatomic and metabolic characteristics of each zone of the gland, allowing early detection of small PCa foci. 4 It also provides important information for the differentiation of various kinds of malignant and benign pathological changes in the prostatic tissues.
The MRSI scanning method entails using an endorectal coil, especially in 1.5-T units. Scanning preparation and spectral acquisition time is long, and some patients, especially those with rectal disease, such as radiation proctitis, often feel intense discomfort. 5,6 The disadvantage of scanning without an endorectal coil is that the distance between the body coil and the prostate is greater, decreasing the signal-to-noise ratio (SNR). However, the high SNR afforded by a 3.0-T magnet may compensate for the greater target-to-coil distance. Currently, there are no clear guidelines for MRSI scanning methods combining different magnetic field strengths and different choices of coil for the diagnosis of prostate disease. We performed a meta-analysis of the literature, aiming to explore the efficacy of 1.5-T and 3.0-T MRSI of the prostate, with and without an endorectal coil, in order to learn whether the endorectal coil is necessary at all magnetic field strengths.
Materials and Methods
Literature Search
This meta-analysis was conducted and reported in accordance with the Preferred Reporting Items for Systematic Reviews and Meta-Analyses (PRISMA) guidelines for systematic reviews and meta-analyses (PRISMA checklist). 7 Two radiologists (H.C. and J.S.), who were blinded to the authors information of the articles, conducted the study inclusion, data extraction, and the assessment of the risk of bias independently. In case of disagreements, a third radiologist (W.L.) was consulted.
Inclusion Criteria
Inclusion criteria were as follows (1) the study content was about the application of MRSI in the diagnosis of PCa; (2) MRSI was performed with scanners of 1.5-T or 3.0-T magnetic field strength; (3) all cases had a definite diagnosis with pathologic results or long-term follow-up as the diagnostic result; and (4) there were stated or easily derived true-positive (TP), true-negative (TN), false-positive (FP), and false-negative (FN) rates.
Search Strategy
MEDLINE, PubMed, Science Direct, Ovid, and Springer from January 2004 to June 2014 were searched for the published literature about the use of MRSI in the diagnosis of PCa. The search terms used for searching were “MRS,” “magnetic resonance spectroscopy,” “prostate cancer,” and “prostate.” The studies were limited to humans . Studies labeled as “review,” “comments,” “meeting record,” and “case report” were excluded. The search records (titles and abstracts) were first scanned by 2 authors (H.C. and J.S.). The full texts of the articles meeting the inclusion criteria were analyzed.
Data Extraction and Quality Assessment
After the evaluation was completed, 2 authors extracted from the selected literature the following information (with author, organization, and funding source hidden): (1) literature data—the first author, publication date, and journal name; (2) basic research information—age and prostate-specific antigen level; (3) the TP, TN, FP, FN, sensitivity (SEN), specificity (SPE), and accuracy (ACC) data. They independently assessed the quality of eligible studies using the Quality Assessment of Diagnostic Accuracy Studies. 8
Statistical Heterogeneity
If P > .05, we did not reject the homogeneity assumption and used the fixed-effects model; for P < .05, we used the random-effects model. According to the appropriate effects model, we obtained 95% confidence intervals (CIs) and generated forest plots and summary receiver–operating characteristics (SROC) curves.
Meta-Analysis
The SEN, SPE, diagnosis odds ratio (dOR), SROC curve, and area under the curve (AUC) were calculated using open-access software (Meta-DiSc 1.4; Unidad de Biostatistica Clinica, Hospital Ramon y Cajal, Madrid, Spain). We used commercial software (STATA 11.0; Stata Corp, College Station, Texas) to calculate the publication bias by generating a Deek funnel plot asymmetry test.
Results
Results of the Search and Study Inclusion
Figure 1 outlines our study selection. After searching using the keywords, we found 154 papers in total. After applying the inclusion and exclusion criteria, 16 English and 1 Chinese papers were included in this study. 9 –25 The data are shown in Table 1.
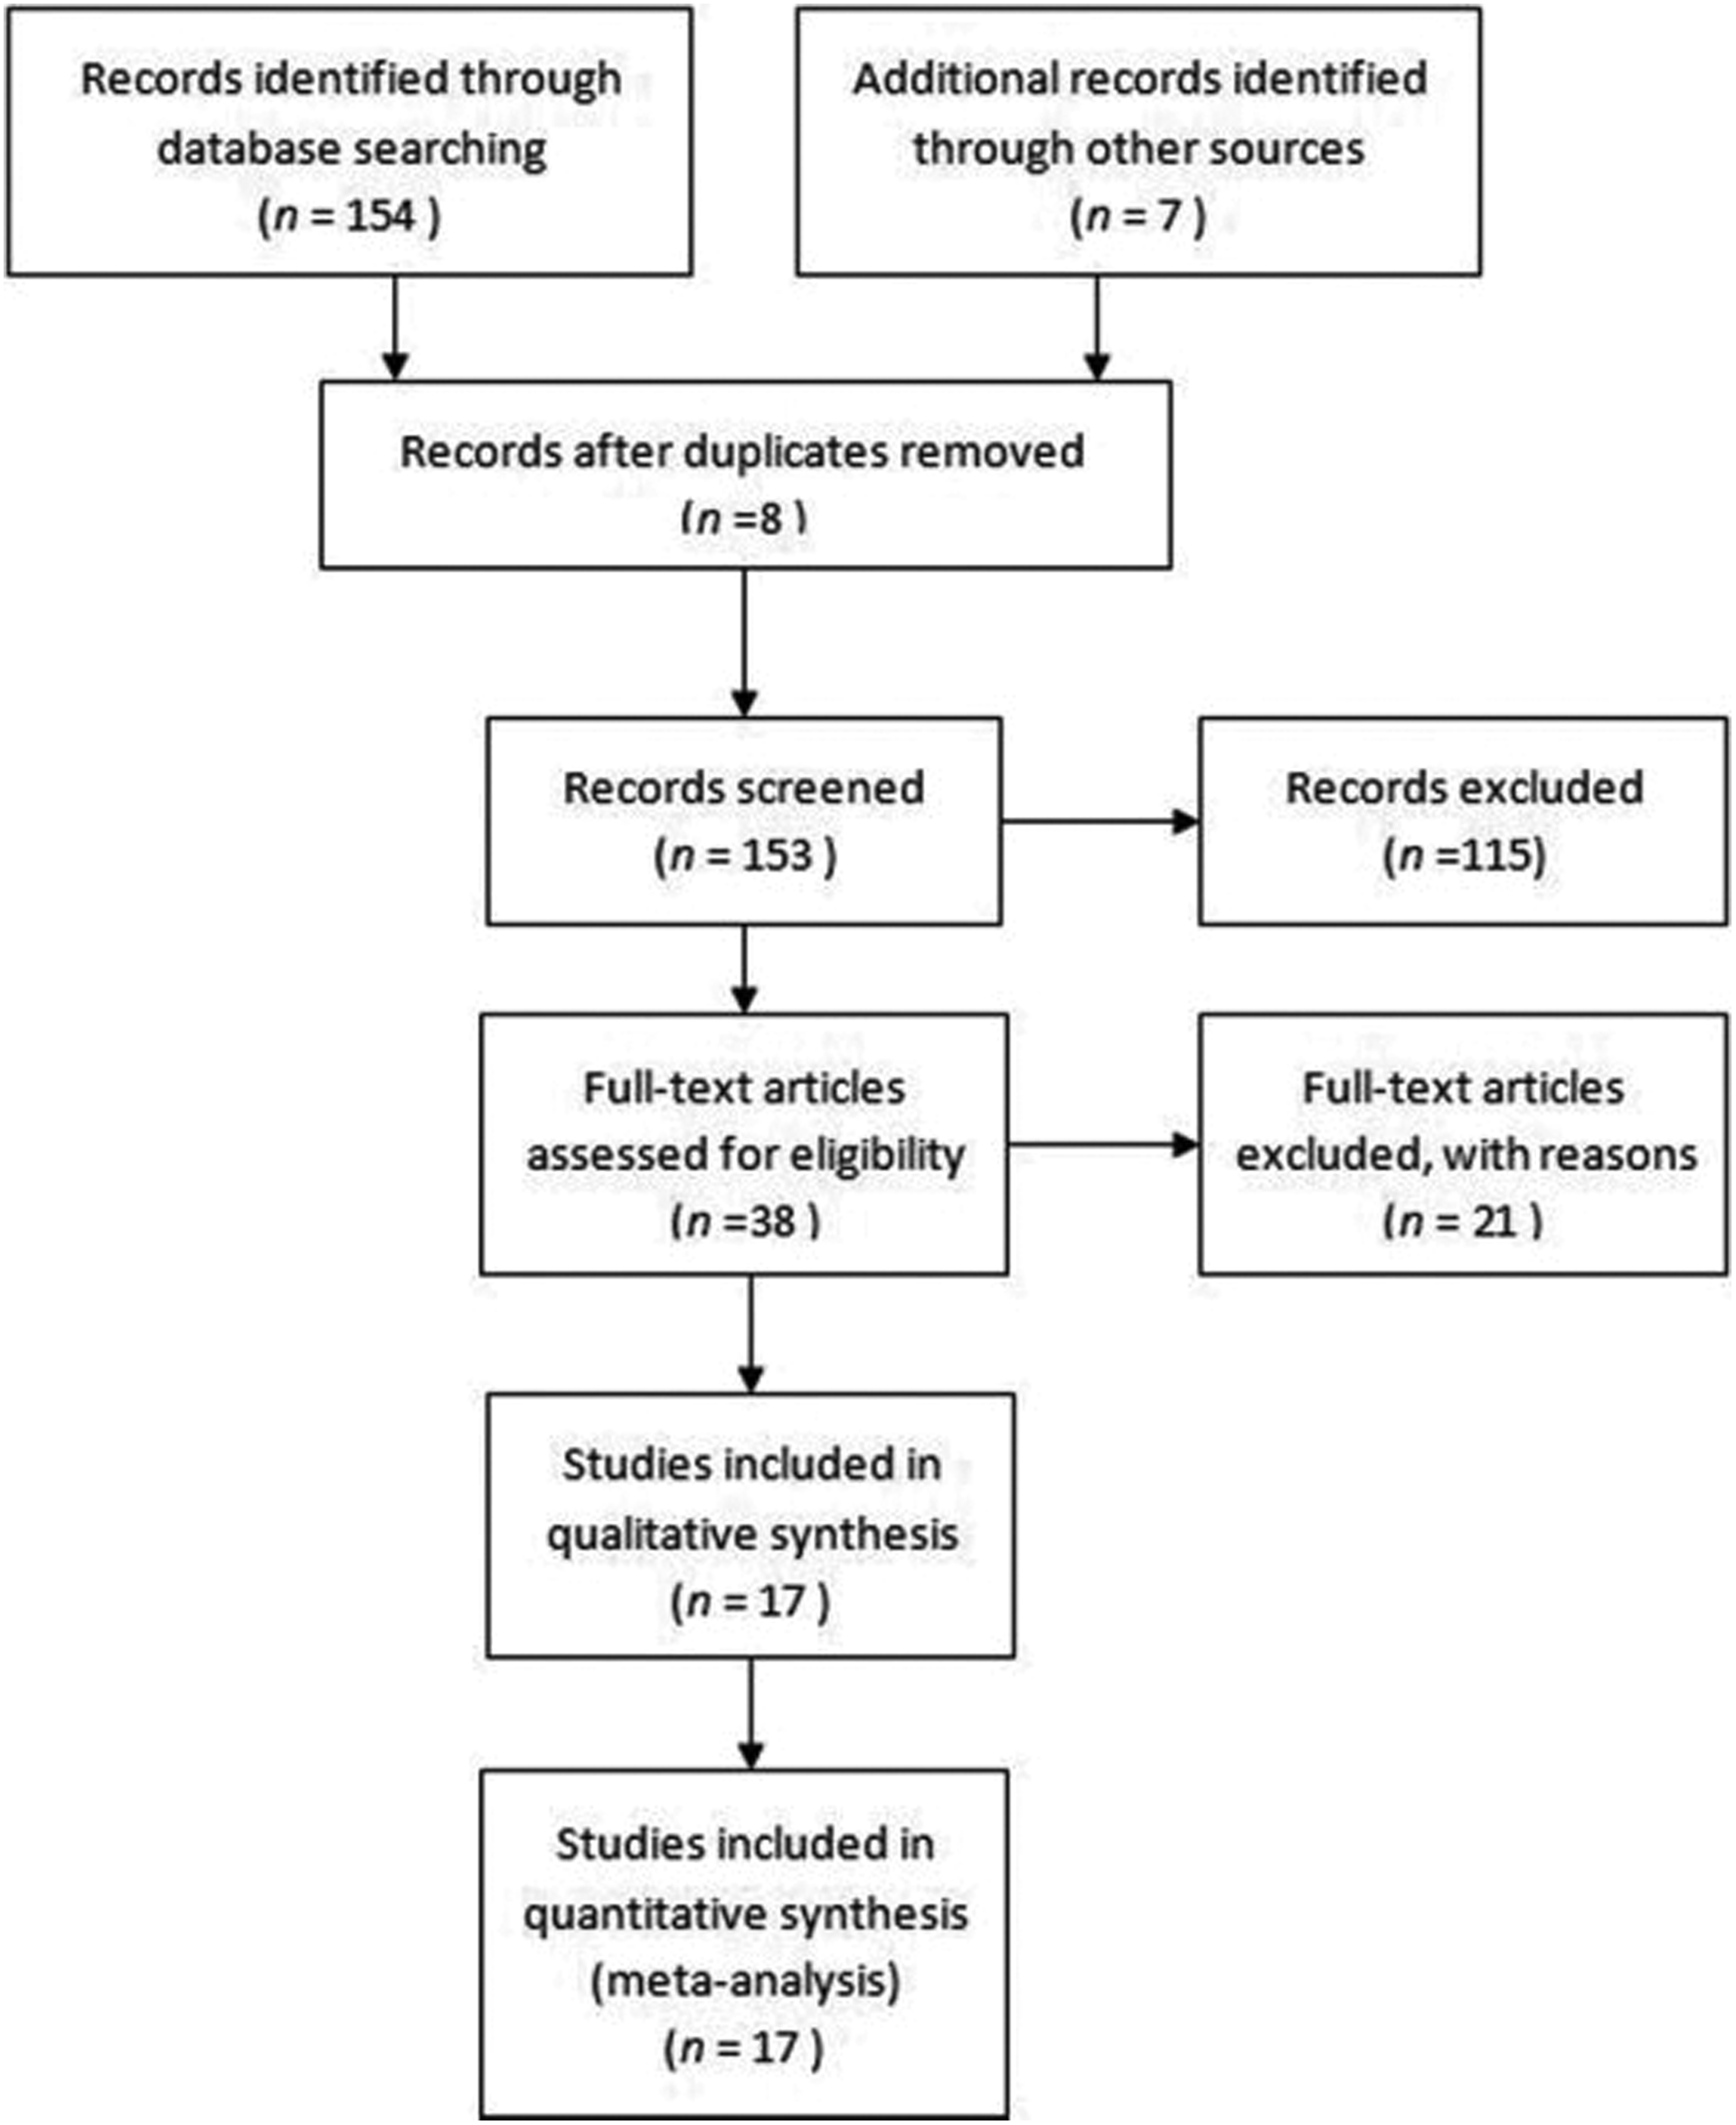
Flowchart of study identification, inclusion, and exclusion.
Included Basic Information in the Literature.

Abbreviations: FN, false-negative; FP, false-positive; PSA, prostate-specific antigen; TN, true-negative; TP, true-positive; UN, unknown; ERC, endorectal coil.
Study Characteristics
According to the different magnetic field strengths and the use of coils, the papers were divided into 3 groups. The first group, MRSI at 1.5 T with an endorectal coil, is represented by 10 papers; the second group, MRSI at 1.5 T without an endorectal coil, is represented by 4 papers; and the third group, MRSI at 3.0 T without an endorectal coil, is represented by 3 papers.
Risk of Bias in Included Studies
The Deek test/funnel plot (Figure 2) showed that publication bias was not statistically significant (P = .73).
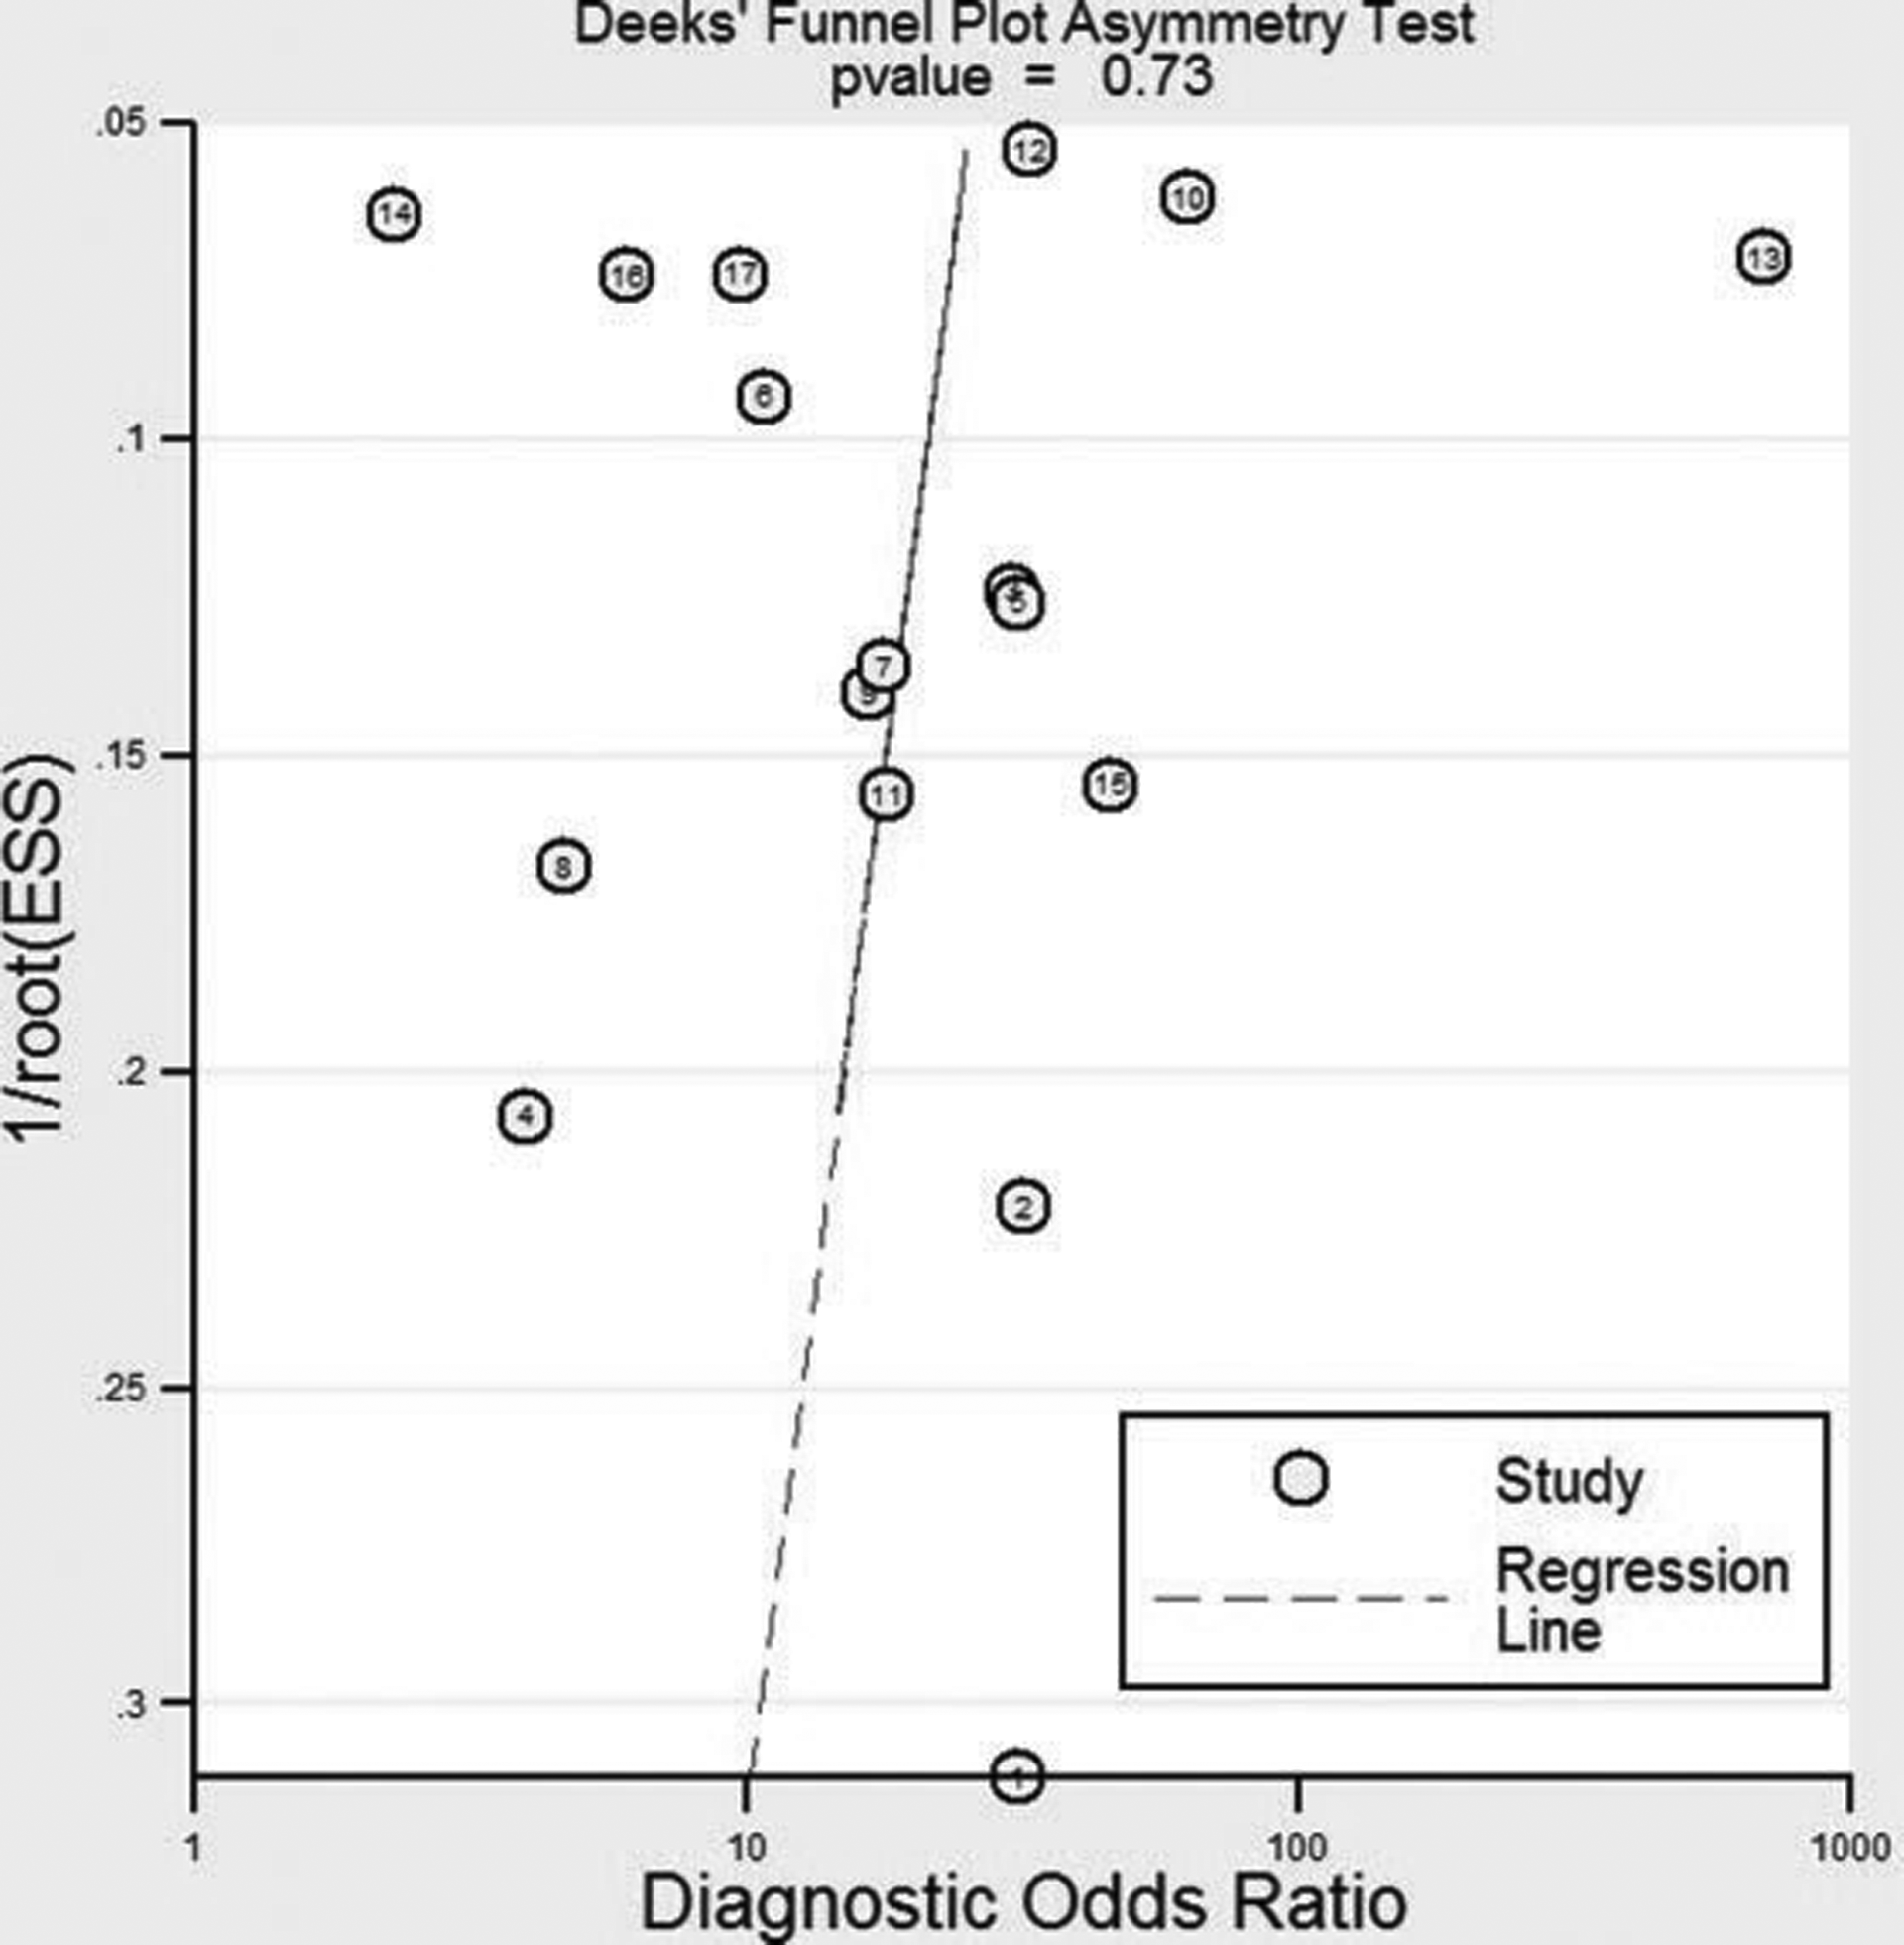
Deek funnel plot assessment of potential publication bias.
Data Synthesis
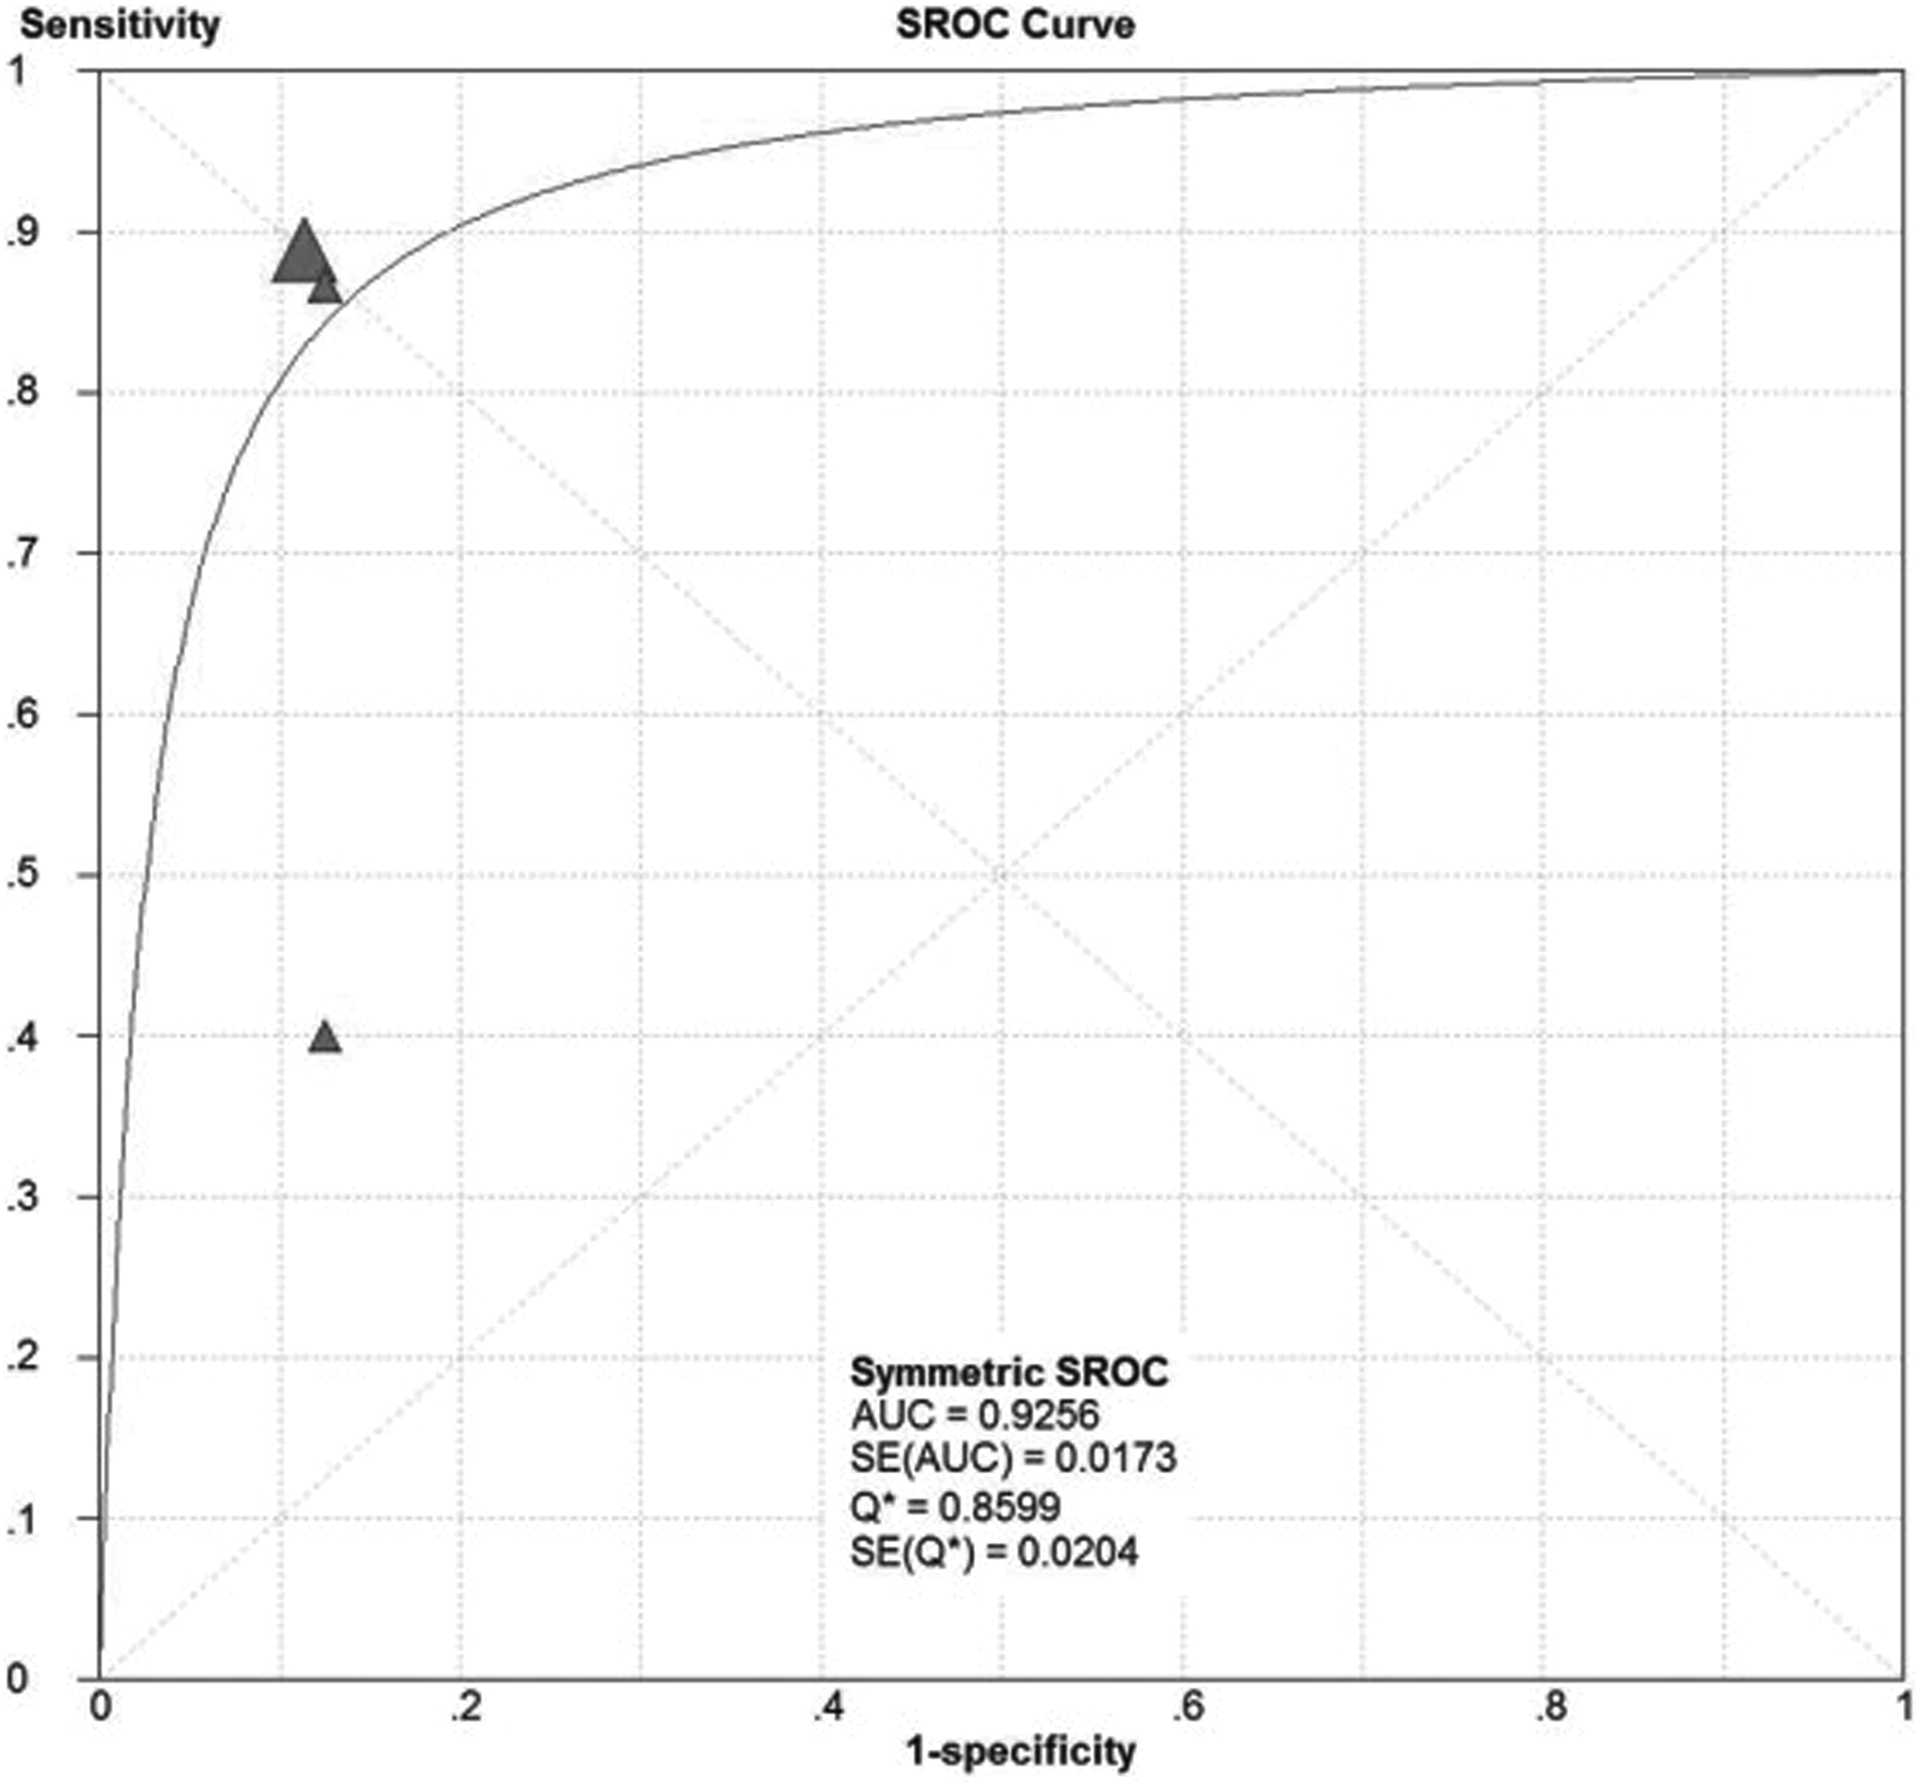
In this study, 3 groups of forest plots were drawn (Figure 3). The SEN, SPE, positive likelihood ratio (LR+), negative likelihood ratio (LR−), dOR, and 95% CIs were calculated (Table 2). Because the SROC curve can reflect the nonlinear relationship between SEN and SPE, it can provide a better evaluation of ACC of diagnostic tests. In addition, we drew 3 separate SROC curves and calculated the value of the AUC (Figures 4 –6). For MRSI at 1.5 T with an endorectal coil, 1.5 T without an endorectal coil, and 3.0 T without an endorectal coil for PCa diagnosis, the pooled sensitivities were 0.84 (95% CI: 0.80-0.87), 0.70 (95% CI: 0.64-0.75), and 0.81 (95% CI: 0.74-0.88), respectively; the pooled specificities were 0.76 (95% CI: 0.73-0.79), 0.67 (95% CI: 0.59-0.73), and 0.89 (95% CI: 0.84-0.92), respectively. The diagnostic SEN and SPE of MRSI at 1.5 T with an endorectal coil and at 3.0 T without an endorectal coil for PCa diagnosis were higher than MRSI at 1.5 T without an endorectal coil. Magnetic resonance spectroscopy imaging at 1.5 T with an endorectal coil and 3.0 T without an endorectal coil were not significantly different in their SEN, but the SPE of MRSI at 3.0 T without an endorectal coil was higher. The areas under the SROC curves were 0.90 ± 0.03, 0.75 ± 0.03, and 0.93 ± 0.02, respectively. The AUC values of MRSI at 1.5 T with and without a coil were significantly different (Z = 3.36, P < .05). As expected, the difference between the AUC of MRSI at 1.5 T without a coil and at 3.0 T without a coil (Z = 4.30, P < .05) was also statistically significant. The AUC difference between MRSI at 1.5 T with an endorectal coil and at 3.0 T without an endorectal coil comparison was not statistically significant (Z = 0.81, P > .05).

Forest plots of magnetic resonance spectroscopy imaging (MRSI) at 1.5 T and 3.0 T for the diagnosis of prostate cancer. A, Magnetic resonance spectroscopy imaging at 1.5 T with endorectal coil. B, Magnetic resonance spectroscopy imaging at 1.5 T without endorectal coil. C, Magnetic resonance spectroscopy imaging at 3.0 T without endorectal coil.

Summary receiver–operating characteristic (SROC) curve of magnetic resonance spectroscopy imaging (MRSI) at 1.5 T with endorectal coil for prostate cancer diagnosis.

Summary receiver–operating characteristic (SROC) curve of magnetic resonance spectroscopy imaging (MRSI) at 1.5 T without endorectal coil for prostate cancer diagnosis.
Summary receiver–operating characteristic (SROC) curve of magnetic resonance spectroscopy imaging (MRSI) at 3.0 T without endorectal coil for prostate cancer diagnosis.
Magnetic Resonance Spectroscopy (MRS) at Different Magnetic Field Strengths With and Without Endorectal Coil for Prostate Cancer: Diagnosis Total Sensitivity, Total Specificity, Positive Likelihood Ratio (LR+), Negative Likelihood Ratio (LR−), and Diagnostic Odds Ratio (dOR).

Discussion
Magnetic resonance imaging is the preferred method of clinical staging of PCa. But the SPE of MRI alone for PCa is not high; distinguishing among benign prostatic hyperplasia, prostatitis, PCa, and hemorrhage after biopsy is still difficult. Magnetic resonance spectroscopy imaging can quantitate metabolic abnormalities in the prostate; it is able to display the metabolic changes in PCa. Normal and hyperplastic prostate tissues both have a high citrate (Cit) content, which shows as a high Cit peak on MRS, while PCa’s decreased ability to secrete and concentrate Cit results in a decreased or absent Cit peak. There is also a relationship between choline (Cho) and the synthesis and degradation of cell membranes. In hyperplasia or cancer, the synthesis and degeneration of cell membranes are increased and cause the concentration of Cho to rise above normal, showing an increased Cho peak on MRS. As creatine (Cr) is mainly involved in energy metabolism, there is no obvious difference in the Cr concentration in the PCa tissue, benign prostatic hyperplasia tissue, and normal prostate tissue, which results in no significant difference in Cr peaks on MRS. Because the Cr and Cho peaks in MRS are often fused together in actual measurement, the (Cho + Cr)–Cit ratio is usually used as a standard measurement calculation. 26,27
Following the inclusion and exclusion criteria, this meta-analysis included 17 articles. We divided the studies into 3 groups based on the different coil and magnetic field strengths. This study used SROC curves to analyze the results of meta-analysis. In this study, we drew an SROC curve that showed all 3 groups to be symmetric, so we can use the SROC subgroup analysis to evaluate the results. After the analysis of SROC, we found that the efficiency of PCa examination by MRSI at 1.5 T with an endorectal coil or MRS at 3.0 T without an endorectal coil were both improvements over MRSI at 1.5 T without an endorectal coil. Magnetic resonance spectroscopy imaging at 1.5 T with an endorectal coil and MRSI at 3.0 T without an endorectal coil had the same efficiency for diagnosing PCa.
In the 1.5-T MRSI examination, in order to obtain high spatial resolution, use of an endorectal coil is necessary for optimal results. However, the use of an endorectal coil has many shortcomings and contraindications. Using an endorectal coil can reduce patient comfort during the examination, increase costs, and increase peristaltic wave motion artifacts. 16,28 It is contraindicated in the short term after surgery and pelvic radiation therapy. In order to stage PCa, the use of an additional surface coil or body coil is needed to expand the field of view. Recent research has shown that the SNR at 3.0 T is twice that of 1.5 T. 27 The increase in SNR may improve the spatial or temporal resolution of the MRI. High spatial resolution shows clearer anatomical detail, beneficial for the diagnosis of lesions. Although SNR at 3.0 T is 2 times higher than that at 1.5 T, at the same time, there are some disadvantages that require attention. Shortening of T2 relaxation time and delay of the T1 relaxation time, which are caused by the influence of the radiofrequency pulse (specific absorption rate), may increase the energy transmitted to patients 29,30 ; also because of its influence on magnetic susceptibility, magnetic fields within the organs and tissues of interest display more unevenly and can be the source of more artifact, 27 which may nullify the benefit of increased SNR.
Meta-analysis can objectively evaluate multiple research results. In this study, we selected studies, performed data analysis, and summarized our findings of a nonlinear relationship between SEN and SPE, and in combination with the SROC curve analysis were able to achieve a high level of ACC. But this study also has some shortcomings. First, there were fewer papers on MRSI at 3.0 T without endorectal coils compared to the number of papers on MRSI at 1.5 T with an endorectal coil. Second, we did not assess the standard value of (Cho + Cr)–Cit ratio for the diagnosis of PCa at different magnetic field strengths and different coils.
In this study, there was no difference between the efficiency of PCa diagnosis by MRSI at 1.5 T with an endorectal coil and MRSI at 3.0 T without an endorectal coil. Thus, each has its own advantages and disadvantages. In the same case, because the SPE for PCa diagnosis with MRSI at 3.0 T without an endorectal coil was higher than that with MRSI at 1.5 T with an endorectal coil, institutions with 3-T magnets may be able to do away with the endorectal coil.
Footnotes
Declaration of Conflicting Interests
The author(s) declared no potential conflicts of interest with respect to the research, authorship, and/or publication of this article.
Funding
The author(s) received no financial support for the research, authorship, and/or publication of this article.