
Abstract
Magnetic resonance (MR)-based modalities aid breast cancer detection without exposure to ionizing radiation. Magnetic resonance imaging is very sensitive but costly and insufficiently specific. Molecular imaging through magnetic resonance spectroscopy (MRS) can provide information about key metabolites. Here, the measured/encoded time signals cannot be interpreted directly, necessitating mathematics for mapping to the more manageable frequency domain. Conventional applications of MRS are hampered by data analysis via the fast Fourier transform (FFT) and postprocessing by fitting techniques. Most in vivo MRS studies on breast cancer rely upon estimations of total choline (tCHO). These have yielded only incremental improvements in diagnostic accuracy. In vitro studies reveal richer metabolic information for identifying breast cancer, particularly in closely overlapping components of tCHO. Among these are phosphocholine (PC), a marker of malignant transformation of the breast. The FFT cannot assess these congested spectral components. This can be done by the fast Padé transform (FPT), a high-resolution, quantification-equipped method, which we presently apply to noisy MRS time signals consistent with those encoded in breast cancer. The FPT unequivocally and robustly extracted the concentrations of all physical metabolites, including PC. In sharp contrast, the FFT produced a rough envelope spectrum with a few distorted peaks and key metabolites absent altogether. As such, the FFT has poor resolution for these typical MRS time signals from breast cancer. Hence, based on Fourier-estimated envelope spectra, tCHO estimates are unreliable. Using even truncated time signals, the FPT clearly distinguishes noise from true metabolites whose concentrations are accurately extracted. The high resolution of the FPT translates directly into shortened examination time of the patient. These capabilities strongly suggest that by applying the FPT to time signals encoded in vivo from the breast, MRS will, at last, fulfill its potential to become a clinically reliable, cost-effective method for breast cancer detection, including screening/surveillance.
Keywords
Introduction
Breast cancer is the most frequently diagnosed malignancy and continues to be the leading cause of cancer deaths among women worldwide. 1 Survival varies markedly by the stage at which breast cancer is diagnosed. 2 Through screening, breast cancer can very often be detected at an early stage, and when followed by appropriate assessment and management, survival has been shown to be significantly increased. 3 For women at high risk of breast cancer, there is a clear benefit of more intensive screening, starting at a younger age. 4 Moreover, intensive screening using various imaging modalities is reportedly tolerated and often preferred by women at high risk, in comparison to invasive procedures such as prophylactic mastectomy. 5 At present, however, some controversy exists about the optimal imaging modalities for breast cancer screening, especially when applied to women at risk, 6 with the need for improvement and cost-effectiveness of current screening programs underscored. 1 We begin here with a succinct account of the current “state of the art” of these imaging modalities and new developments that hold promise for breast cancer screening.
Anatomic Imaging Modalities Used in Breast Cancer Screening
Anatomic imaging has been vital for breast cancer detection as well as for staging and evaluation of response to therapy. Mammography, ultrasound, and magnetic resonance imaging (MRI) are the major anatomic imaging modalities used for breast cancer screening.
Despite its reliance upon ionizing radiation, mammography continues to be the mainstay of breast cancer screening. However, it has relatively low specificity, with false-positive results quite frequently reported. 7 False-positive mammographic findings can engender psychological distress and may also decrease the likelihood of attending subsequent screening. 8 Another concern about mammography is exposure to low-energy x-ray, which may cause more mutational damage than high-energy x-rays. 9 This concern is salient for younger women, especially for those with genetic susceptibility to radiation-induced cancers, in light of the recommendations that women at high risk should begin screening at a younger age and with increased frequency. 10 Among younger women who often have dense breasts, the sensitivity of mammography is also frequently poor. 6 The addition of ultrasound improves breast cancer detection among these women. 11 However, the false-positive biopsy rates are higher for ultrasound than for mammography. 11
Of the anatomic imaging techniques, contrast-enhanced MRI generally has the best sensitivity for detecting breast cancer, particularly for women at high risk. 4,10,12 –14 Another key advantage of MRI is lack of exposure to ionizing radiation. However, MRI has poorer specificity than mammography, resulting in high biopsy rates, with fewer than half actually being malignant. 3 A number of benign breast lesions are hard to distinguish from breast cancer on MRI. Small lesions and nonmass morphology are particularly difficult to identify as benign using dynamic contrast-enhanced MRI. 15,16
Although women at high breast cancer risk who participate in intensive surveillance programs seem to be reassured by the excellent sensitivity of MRI, 17 the large number of false-positive findings may negatively impact upon quality of life 6 as well as upon subsequent adherence to screening recommendations. Indeed, in a study of women eligible for breast MRI due to elevated breast cancer risk, only about 58% agreed to do so. Fear and concern about additional biopsies or testing were among the reasons given for refusal. 18 Notably, after excisional biopsy, the specificity of MRI becomes even lower. 19
Expense is another critical concern with regard to MRI. Currently, MRI is not considered to be a cost-effective screening method except for women at very high risk of breast cancer. 11
In general, the most important limitation of anatomic imaging is insufficient specificity, which can be enhanced by functional as well as molecular imaging. 6,20,21 Ionizing radiation-free modalities based upon magnetic resonance (MR) including diffusion-weighted imaging (DWI) would be particularly desirable for breast cancer screening/surveillance.
Functional Imaging Through DWI
Diffusion-weighted MRI yields image contrast dependent on the molecular motion of water. Since this motion may be substantially altered with malignancy, DWI can be helpful in distinguishing cancerous from benign lesions. By detecting the random (Brownian) motion of free water, insights are gleaned into local tissue architecture. With increased cellularity or intracellular density, as frequently observed in cancerous tissue, the restricted motion of free water molecules is reflected in a decreased apparent diffusion coefficient (ADC). On the other hand, benign lesions generally show an increased ADC. 21
There are exceptions, however. For example, fibrotic tissue and benign proliferative changes in the breast also show a low ADC. On the other hand, necrotic tissue can arise from cancerous lesions, and since necrosis is hypocellular, the ADC is therefore increased. Particular difficulty occurs in attempts to characterize nonmass breast lesions as benign versus malignant using DWI. 22 Recent technical improvements in voxel positioning and measuring ADC in breast tumors have been reported. 23 Nevertheless, there are still many caveats regarding the cut points and recording parameters that may influence the accuracy with which benign and cancerous breast lesions are distinguished from each other using DWI. 21,23
Molecular Imaging Through MR for Identifying Breast Cancer
Compared to functional approaches such as DWI, molecular imaging can potentially yield more information for distinguishing benign versus cancerous breast tissue. As noted, MR-based modalities are well suited to breast cancer screening/surveillance, especially among women at high risk. Magnetic resonance spectroscopy (MRS) provides insight into the metabolic characteristics of tissue and improves the specificity of MRI in distinguishing malignant from benign breast lesions. 24,25 A single MRS voxel may sometimes be insufficiently representative of the scanned tissue, in which case multivoxels can be used via MR spectroscopic imaging (MRSI) to achieve volumetric coverage. Benign and malignant breast lesions have also been examined by MRSI. 26
Total choline assessed via MRS/MRSI at various magnetic field strengths
Thus far, comparative data using 1.5 or 3T scanners have been published for over 700 cancerous versus over 400 nonmalignant breast lesions evaluated by in vivo proton MRS or MRSI. 27 These studies have mainly been based upon assessments of the composite or total choline (tCHO) peak resonating at approximately 3.2 ppm. Since the tCHO peak reflects increased turnover of cell membranes, it is considered to be an indicator of malignancy. 25 From the recently published meta-analysis 27 of these 1200 breast lesions, the pooled sensitivity and specificity of MRS were 73% (556 of 761) and 88% (386 of 439), respectively. However, these pooled ratings are likely to have overestimated the diagnostic performance of MRS due to publication bias. 27 The majority of the studies in the meta-analysis 27 assigned some cut point for the ratio of the tCHO peak to baseline noise as the indicator of malignancy.
Since signal-to-noise ratio (SNR) increases linearly with magnetic field strength, it has been suggested that higher field scanners could improve MRS-based diagnostics of the breast. 24 This strategy has been considered especially promising for evaluating smaller lesions, because a smaller voxel size could be used. 28 However, in the meta-analysis, 27 the diagnostic accuracy of MRS in distinguishing malignant and benign breast lesions was not superior in the studies using 3T scanners 29,30 compared to those with 1.5T scanners. Investigations employing even higher field (4 or 7T) MR scanners have been reported as well. 31,32 In a study 31 using a 4T scanner of 500 in vivo-generated breast spectra, the tCHO levels were significantly elevated in breast cancer. However, tCHO was detected in a number of benign breast lesions as well as in normal breast. Notably, there was substantial overlap among the ranges of tCHO for these 3 categories of breast tissue. Moreover, tCHO was undetectable in several breast cancers. Although MR imaging for breast via higher field MR scanners has been shown to be technically feasible, 32 the prohibitive instrumentation costs preclude such scanners from wider usage in breast cancer screening protocols.
From the above-mentioned considerations, it can be surmised that relying upon tCHO, as a single composite spectral entity, may well compromise the diagnostic accuracy of MRS for breast cancer. As noted in a number of the cited studies, choline (CHO) may be observed in benign breast lesions as well as in normal breast, whereas especially in small tumors, CHO is often undetected. Choline typically appears in normal breast during lactation. Importantly, breast cancer and lactation can coexist, and the former is typically detected late. It should also be emphasized that many different cut points for tCHO have been used by different investigators to define malignant versus benign breast tissue. Attempts at standardization consequently become exceedingly precarious.
Overlapping resonances: problematic for conventional applications of in vivo MRS/MRSI
Although higher field scanners yield sharper, well-resolved resonances when these are isolated, stronger magnets broaden the peak widths of tightly overlapping resonances that are otherwise abundant in MR spectra. 33 Thus, stronger magnets exacerbate the already difficult problem of so-called “spectral crowding.” These considerations are particularly relevant for MRS of the breast. In their analysis of breast lesions, Bolan and colleagues 34(p215) reported that using a 4T scanner “lipid-induced sidebands rather than signal-to-noise considerations…limit the sensitivity for detecting choline.” The conventional strategy has been to suppress lipid, especially since the often dominant fat of the breast also hinders localized shimming. Lipid suppression may be achieved by increasing the echo time. However, metabolites with short T 2 relaxation time will thereby have decayed. Moreover, Stanwell and Mountford 35 point out that suppression of lipid resonances eliminates the possibility of assessing the lipid that is part of the actual disease process.
Compared to conventional applications of in vivo MRS/MRSI, in vitro nuclear magnetic resonance (NMR) applied to extracted specimens provides more insight into the metabolic activity of cancerous breast. 36 It is thereby seen that tCHO contains a number of components that can better distinguish benign from malignant breast tissue. These include phosphocholine (PC) resonating at 3.22 ppm, glycerophosphocholine (GPC) at 3.23 ppm as well as free CHO at 3.21 ppm. 36 Katz-Brull and colleagues 37 identified 2 pathways: phosphorylation and oxidation of CHO that are increased with malignant transformation of mammary cells. As a consequence, PC is augmented, and CHO-derived ether lipids are suppressed. With malignant transformation in the breast, a “GPC to PC switch” occurs, associated with overexpression of the enzyme CHO kinase responsible for PC synthesis. 37
Phosphocholine is considered a marker of malignant transformation. 38 However, as noted, PC resonates very closely to GPC and free CHO. Moreover, according to NMR data from extracted breast specimens, 36 the PC peak at 3.220 ppm is completely overlain by the much more abundant phosphoethanolamine (PE), which also resonates very near PC, that is, at 3.221 ppm.
Why are these diagnostic dilemmas unsolvable by conventional data analytic methods?
Conventional applications of in vivo MRS and MRSI are based upon data analysis via the fast Fourier transform (FFT), which is built into all existing clinical MR scanners. Signal processing is needed to convert the encoded MRS time signal into its spectral representation in the frequency domain. The FFT does so but with its very restrictive intrinsic features. Namely, the FFT is a linear, nonparametric method, which provides only the total shape spectrum (envelope) but cannot provide any information about the underlying components.
Regarding the considerations just raised, the FFT does not have the capability to disentangle the overlapping resonances that comprise the tCHO peak. Thus, via the FFT, no trustworthy information can be gleaned about the relative abundance of the components of tCHO, that is, PC, GPC, and free CHO, nor can any information be obtained confidently about the concentration of PE which, as mentioned, completely overlaps with PC. The FFT cannot even determine with certainty the number of overlapping resonances contained within a given spectral structure, that is, within a given peak. Attempts to obtain this information generally entail postprocessing by way of fitting, which is a nonunique procedure of guessing the number of components underlying a given peak. Inevitably, false information is generated (overfitting) and/or true metabolites are missed (underfitting). Attempts to quantify the resonances as predetermined via a linear combination of modeled peaks or the entire spectrum are consequently bound to be biased and, therefore, cannot be trusted clinically nor otherwise. 39
An advanced signal processor for analyzing MRS time signals from cancerous and noncancerous breast: Results for noiseless time signals using the fast Padé transform
The fast Padé transform (FPT) is an advanced signal processing method whose capabilities are well suited to MRS and MRSI. 39,40 The FPT is a nonlinear, high-resolution, parametric, as well as nonparametric signal processor. It finds the exact number of metabolites contained in a given encoded MRS time signal by parametric estimations. The spectral parameters (complex fundamental frequencies and complex amplitudes of the characteristic oscillations) of each resonance are also uniquely determined, and the metabolite concentrations are thereby reliably retrieved. These capabilities of the FPT have been demonstrated to apply even to the most closely overlapping resonances, with quantification achieved to the highest accuracy. 39 –41
Notwithstanding the successful applications of the FPT to in vivo encoded MRS time signals, 39,42 a key step for benchmarking the FPT specifically within cancer diagnostics has been application to simulated or synthesized MRS time signals that are of a waveform similar to corresponding encoded data. This is a practical and necessary approach to validation, which has passed the test of time in other disciplines, such as engineering. 39
In this controlled setting, we began with noise-free time signals similar to in vitro MRS data as encoded from extracted breast specimens with 9 resonances 36 and then sampled 3 MRS time signals corresponding to normal, noninfiltrated breast, fibroadenoma, and breast cancer. In each of the 3 cases, the FPT resolved and precisely quantified all 9 resonances, including those in the spectrally dense region between 3.21 and 3.23 ppm. Therein, PC and PE were almost completely overlapping. Yet, at convergence, the FPT precisely reconstructed the input parameters for these 2 resonances. 6,39,43
Due to the very closely overlapping resonances in the breast spectra, the solution to this overdetermined quantification problem generated a large number of spurious resonances, namely 741, all of which were confidently identified as nonphysical by the FPT. In other words, fewer than 2% of the resonances were genuine. We will now briefly describe how this genuine information, that is, true signal was distinguished from noise (false information) via the FPT.
Signal–noise separation with the FPT
Algorithmically, the separation of the genuine and spurious resonances is achieved through identifying pole–zero confluences, a phenomenon unique to the FPT. While generating a spectrum by the quotient of 2 polynomials (P/Q), the FPT parametrizes the intrinsic characteristics of a given system through the unique set of spectral poles and zeros. The system poles are associated with the denominator polynomial Q and represent the positions (chemical shifts) and widths of peaks in a spectrum. The system zeros are described by the numerator polynomial P and correspond to valleys or dips in between any 2 adjacent peaks in the same spectrum. The coincident pole–zero couples that are unstable are binned as spurious or unphysical resonances. Such pairs are known as Froissart doublets. 39 These roam around in a chaotic fashion with even the slightest perturbation, and they never converge. This stochasticity is characteristic of noise. Therefore, spurious resonances are noise like and, as a false content of the data, must be identified and discarded from the results of the analysis.
Resonances that are stable against either noise and/or varying truncation of the full signal length (or different total acquisition times) are classified as genuine or physical resonances. Some of these may also have near pole–zero confluences or near zero amplitude, but their stability will always distinguish them from Froissart doublets.
The total number of genuine resonances is unknown prior to the analysis. It is surmised in all of the existing “FFT + fitting” approaches, but bias is inevitable, as there is no criterion to ascertain whether the guess was right or wrong. By contrast, this key number is exactly reconstructed in the FPT, just like the fundamental frequencies and amplitudes. It is determined by the criterion consisting of full convergence of genuine resonances.
In the “FFT + fitting” techniques, when the guessed number of peaks is larger than the true number, false resonances appear in the final spectrum without the user’s awareness of that occurrence. Being given by a single polynomial, the FFT linearly carries all the noise from the time domain into the frequency domain. With the FFT, there is no way to cancel or suppress this noise.
Herein lies a key advantage of the FPT, in having not 1 but 2 polynomials P and Q. These 2 degrees of freedom constitute richer mathematics, which are exploited in the FPT. This is not done by just any combination of P and Q. Rather, it is the unique quotient P/Q, which confers the possibility to suppress noise, by the argument which runs as follows. When the total number of resonances K′ in the reconstructed spectrum
Pole–zero coincidences also can be viewed as cancellation between a resonance and an antiresonance, or alternatively, between a peak and a dip characterized by a full width at half maximum (FWHMax) and full width at half minimum (FHWMin), respectively. In other words, spurious resonances have FWHMax = FHWMin. In contrast, the poles and zeros of genuine resonances are not equal to each other, that is, FWHMax ≠ FHWMin. Another key distinction between the spurious and the genuine resonances is that the former has zero amplitude, whereas the amplitudes of true resonances are nonzero. Moreover, for different acquisition times (or, equivalently, for different truncation levels of the full signal length at a fixed bandwidth (BW)), stabilization occurs for genuine resonances, whereas the spurious structures fluctuate and never converge. Thus, true metabolites are distinguished from spurious resonances by a multifaceted signature within the FPT; this has been termed signal–noise separation (SNS). 39,40
Further Steps Achieved to Date With Padé Optimization of MR Signals for Cancer Diagnostics
Applications of the FPT to noiseless time signals from ovarian and prostate cancer
Ovarian cancer has received much attention as one of the clinical priorities. Namely, ovarian cancer is generally detected late with high mortality rates, whereas early-stage ovarian cancer has an excellent prognosis. Accurate screening methods are therefore urgently needed. Using conventional FFT-based scanners, in vivo MRS of the ovary has been severely limited by poor resolution of signals from this small, moving organ. Yet, it has been suggested that in vivo MRS could become the method of choice for ovarian cancer diagnosis, insofar as the obstacles hindering the acquisition of high-quality time signals and subsequent reliable analysis of spectra as well as their interpretation were overcome. 44
In applications 45 to noiseless time signals associated with MRS data for benign and cancerous ovarian cyst fluid, the FPT accurately reconstructed the spectral parameters for all 12 genuine metabolites, including those that were closely lying, using very small fractions (N/16 = 64) of the full-time signal N = 1024. 39,45 Thereby, the metabolite concentrations were precisely retrieved. On the other hand, the FFT produced entirely uninterpretable spectra at these short signal lengths. 39 The results from these earlier studies 39,45 illustrate the clear superiority of the FPT compared to the FFT in improving SNR and resolution. For these noiseless ovarian data, besides the 12 genuine metabolites generated at convergence, some 20 spurious resonances were also detected. As described, the latter resonances were recognized as being due to pole–zero confluence yielding Froissart doublets with zero amplitudes and they were thereby discarded.
Prostate cancer has also been studied as a priority due to its public health importance. It is one of the most prevalent cancers among men worldwide, with over 200 000 deaths per year attributed to this malignancy. There are major dilemmas regarding screening and early detection of prostate cancer, which could potentially be surmounted by MRS and MRSI. Thus far, applications of MRS and MRSI have shown promise in a number of aspects of prostate cancer diagnosis and management. 39 Nevertheless, MR-based modalities are still not considered to be appropriate for screening. 46
Applications of MRS to the prostate have presented a great number of challenges. These have been related to the fact that prostate spectra contain abundant multiplet resonances that are extremely difficult to split apart and quantify. In applications to noiseless in vitro data associated with encoding from normal glandular and stromal tissue, as well as from cancerous prostate, 47 the FPT resolved and precisely quantified all 27 genuine resonances. These included multiplets as well as overlapping peaks of different metabolites. Thereby, via the FPT, the metabolite concentrations that distinguish healthy from malignant prostate were accurately computed. 39 As was the case for breast, a large number of spurious resonances, on the order of 300, were also generated at convergence for normal glandular, normal stromal prostate, and prostate cancer. These Froissart doublets with zero amplitude were separated with certainty from the 27 true resonances of the normal and cancerous prostate.
Applications of the FPT to MRS time signals from ovarian cancer contaminated with varying levels of noise
The next step was to assess how the FPT processes noisy MRS time signals associated with malignancy. 20,48 We chose ovarian cancer as the first problem to tackle because of its clinical urgency. Here, the percentage of spurious resonances was about 40%, which is relatively low in comparison to the noiseless data for other malignancies tested using the FPT. The FPT demonstrated a clearly superior resolution performance relative to the FFT on these MR data from the ovary. This is due to a number of properties lacking in the FFT. These are extrapolation and interpolation capabilities as well as nonlinearity, which itself contributes to noise suppression within the FPT. 39
With the addition of lower levels of noise (σ = 0.01156 RMS, where RMS is the root-mean-square of the noise-free time signal,
To meet this challenge, the stability test was used to provide further verification. By varying the partial signal length and also by adding even further noise, all genuine metabolites, including those with very small amplitudes, could be unequivocally identified, since these remained stable and thus robust against perturbations. In contradistinction, spurious resonances were detected by their pronounced instability with even a minimal change in partial signal length or noise level. Using this stability test, the unstable resonances were confidently binned for discarding, whereas all the stable metabolic information was retained in a denoised spectrum. 20 Thus, SNS via stability versus instability in the face of changes in noise levels or partial signal length proved vital. Overall, this is a veritable paradigm shift in handling noise within signal processing. Such a concept of the Padé-Froissart-based SNS is not limited to MRS data. It is applicable to any time signals represented by a linear combination of frequency-dependent sinusoids and cosinusoids that are exponentially damped and multiplied by the constant amplitudes. Such time signals, as from MRS and MRSI, are also encountered in ion-cyclotron resonance mass spectroscopy, infrared spectroscopy, and so forth.
The Present Study: Application of the FPT to MRS Time Signals From Cancerous Breast With Added Noise
The foregoing results justify proceeding to the next step with the aim of Padé optimization of MRS for breast cancer diagnostics. This is to examine the performance of the FPT applied to MRS time signals from breast cancer with added noise. Here, our particular focus will be upon the resolution of the very closely overlapping resonances within the narrow region between 3.21 and 3.23 ppm, where, as stated, the GPC to PC switch has been identified as a marker of malignant transformation. 37,38 Given the very large number of spurious resonances encountered in the noiseless MRS time signals from the breast, 39,43 we anticipate that the above-described procedure of SNS will be of critical importance for identifying and quantifying the genuine metabolites when noise is extrinsically added to these time signals.
Materials and Methods
The Input Data
The input data are based upon those encoded in malignant breast.
36
The time signal

where N is the total signal length, τ is the sampling time, and each cn
is a sum of K = 9 damped complex exponentials

where ϕ k is the phase of the complex amplitude dk .
The time signals were then quantified using the FPT. 39,40 These time signals were recorded at a Larmor frequency of 600 MHz (static magnetic field strength B 0≈14.1T). 36 Herein, a BW of 6 MHz was used, where the inverse of this BW is the sampling time τ. The total signal length was set to be N = 2048 as in our earlier study. 43
There are 2 groupings of the set of 9 resonances: a band from 1.3 to 1.5 ppm and a band from 3.2 to 3.3 ppm. Seven metabolites are within the latter band, including 2 extremely closely overlapping resonances at 3.220 and 3.221 ppm. These are PC peak #4 and PE peak #5 separated by 0.001 ppm.
The input peak amplitudes dk
were deduced from the mean concentrations of metabolites (Cmet) for 12 patients,
36
with
Since the T
2* relaxation times were not originally reported,
36
the imaginary frequencies were all set to be 0.0008 ppm. The linewidths are proportional to
All the peaks in the frequency domain are consistent with time signal (Equation 1) and, therefore, are of the Lorentzian lineshape in the absorption mode of the Padé spectra,
There are 2 equivalent variants

where

where the symbol
For convenience, the input phases
Input Spectral Parameters, Concentrations and Metabolite Assignments for Breast Cancer.a

Abbreviations: LAC, lactate; ALA, alanine; CHO, choline; PC, phosphocholine; PE, phosphoethanolamine; GPC, glycerophosphocholine; β-GLC, β-glucose; TAU, taurine; M-INS, myoinositol.
aThe listed parameters are consistent with the corresponding in vitro data.
36
Here, Nk
is the number of the kth resonance, Re(ν
k
) and Im(ν
k
) as the real and imaginary parts of the complex linear frequency ν
k
representing the chemical shifts and linewidths, respectively. The phases
The parametric version of the diagonal
Equating here the coefficients of the same powers of 
Once the set
The characteristic equation
The
Addition of Noise
We perform quantification of noise-corrupted input data. The latter was created by adding complex-valued random zero-mean Gauss-distributed white noise of prescribed levels to the noiseless MRS time signal. For illustration, we have selected the noise level as σ = 0.0289 RMS, where, as noted, RMS is the RMS of the noise-free time signal. The RMS is employed since it simultaneously minimizes 2 measures, the bias relative to the actual (sought) value and the variance of noise. Furthermore, RMS is a measure of the signal dynamics, converting signal oscillations to variations in the power of the time signal across the given BW. 20
Encoding MRS time signals encounters a number of sources of noise ranging from electronic circuitry through thermal Brownian random motion of molecules (including water) to patient breathing and organ motion. Recall, also, that the SNR encoded on clinical (1.5 T) is lower than for higher field strengths. In particular, the Brownian motion is characterized by a huge amount of molecular scattering events and, as such, obeys the law of the theorem of large numbers which leads to a Gaussian or normal distribution. This is why random noise can be mimicked by Gaussian-distributed white noise. Random noise in the encoded MRS time signals is spread across all the frequencies in a given BW, which is to say it is, in fact, white Gaussian noise. Thus, the time signals corrupted with Gaussian white noise are indeed a mathematical phantom for the corresponding free induction decay curves in MRS.
Methods for Identifying Spurious Resonances
Pole–zero cancellation and zero amplitude
The computation is carried out by gradually increasing the degree of the Padé polynomials. In so doing, it is observed that the reconstructed spectra fluctuate until stabilization occurs. This constancy of the reconstructed values is obtained through the cannonical representation of, for example, the diagonal 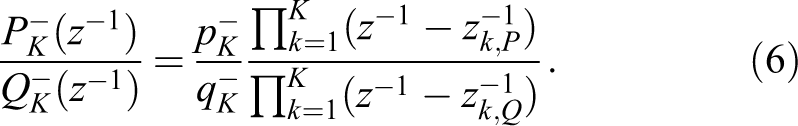
The quotient form, Equation 6, leads to cancellation of all the terms in the Padé numerator and denominator polynomials, when the computation is continued after the stabilized value of degree K in the 
The Cauchy residue of 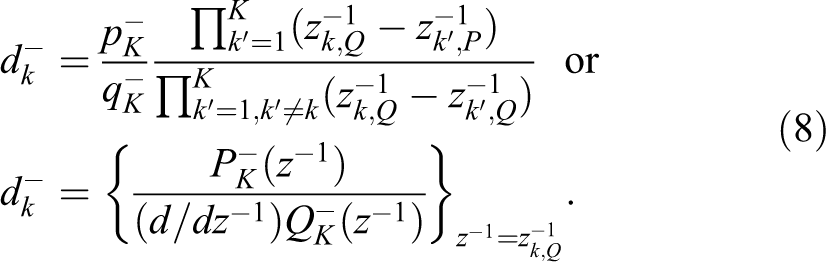
From Equation 8, it is seen that whenever 
As noted in the introduction, the algorithmic pole–zero coincidences can also be conceptualized as confluence between the FWHMax and the FWHMin (FWHMax = FWHMin) or, equivalently, as a complete matching between the corresponding resonance and anti-resonance. For genuine resonances, recall that FWHMax ≠ FWHMin.
The resonance stability test
The resonance stability test is used as a further confirmation of the nature (genuine versus spurious) of a given resonance. Therein, by varying the partial signal length, and/or the level of added noise, the stability of the spectral parameters of one group of resonances is sharply contrasted by the instability of the remaining resonances, concerning their positions, relaxation times, amplitudes, and computed concentrations. Stable and unstable resonances with regard to their spectral parameters are classified as physical (genuine) and unphysical (spurious), respectively. Binning within the output list of reconstructions can also be accomplished via automatic classification using the conditional probability to statistically validate the estimated parameters as done in the FPT within the recent PhD thesis by Ojo. 49
Nonparametric Signal Processing by the FPT: Comparisons With the FFT
It proves useful to generate merely spectral envelopes first. This qualitative information is obtained by nonparametric estimation, which gives lineshapes alone. Such data are provided by the FPT automatically and en route. Namely, as soon as the Padé polynomials
Comparisons between the Padé and the Fourier spectra are restricted to envelopes because that is all the FFT can compute as a nonparametric estimator. The inability to autonomously reconstruct the spectral parameters (fundamental frequencies and amplitudes, both complex) eliminates the FFT from the list of signal processors that can on its own solve the quantification problem, which is otherwise the “raison d’être” of MRS. By contrast, as stated, the FPT can perform both the nonparametric and the parametric signal processing. The nonparametric
Parametric Signal Processing by the FPT (Quantification)
The parametric FPT provides quantification of MRS data by a single numerical procedure consisting of polynomial rooting. As mentioned, the roots of the characteristic equations of the numerator (P) and the denominator (Q) polynomials yield the zeros and poles of the Padé spectrum
Thus, given that the quantification problem consists of finding the eigenset
The art then is to get rid of the
Stability versus instability differentiates the true from false resonances, respectively. Instability is manifested in alterations of spectral parameters with changes not only in
This correlated pattern of behavior of
It has been often stated that the FPT derives its success, both within theory and practice, directly from quantum mechanics, the most adequate physics theory. This is truly the case because in an equivalent manner in which quantum physics prescribes the particular form in Equation 1 of a sum of damped complex harmonics for the free induction decay curve in the time domain, the same theory likewise gives the frequency spectrum by the unique ratio of 2 polynomials as in the FPT. 50 This comes about from the arguments expounded in Appendix A.
Results
Reconstruction of the Data From Breast Cancer With Added Noise
We systematically increased the signal length for the same BW using 3 different acquisition times to check the constancy of the spectral parameters, as displayed in Table 2. The spectral parameters are herein displayed at total orders (degrees of polynomials
Reconstructed Spectral Parameters and Metabolite Concentrations Using the Fast Padé Transform

Abbreviations: LAC, lactate; ALA, alanine; CHO, choline; PC, phosphocholine; PE, phosphoethanolamine; GPC, glycerophosphocholine; β-GLC, β-glucose; TAU, taurine; M-INS, myoinositol; FPT, fast Padé transform; PC, phosphocholine.
aThe input spectral parameters are taken from Table 1 to create the noise-free time signal. Subsequently, these data are corrupted by adding zero-mean random complex-valued Gaussian noise of 0.0289 root mean square (RMS) of the noise-free time signal. Computations were carried out at partial signal lengths N P = 680, 1700, and 2038, as displayed on panels (1), (2), and (3), respectively. Full convergence is indicated on panels (2) and (3).
As seen in the top panel (1) of Table 2, at K = 340, that is, at N P = 680, only 8 of the 9 resonances were reconstructed. In the interval around 3.220 and 3.221 ppm where 2 resonances should have been reconstructed, only one was found. Peak #4 (PC) was not identified, whereas the height, linewidths, and, consequently, the concentration of PE were all overestimated. The amplitudes and the concentrations for the single resonance PE were marginally greater than the corresponding actual sum for PC + PE. At N P = 680, with the exception of the reconstructed linewidth of GPC which was lower by 0.0001 ppm than the actual value, the spectral parameters and concentrations of the other 6 metabolites were completely correct.
Full convergence occurred at N P = 1700 on the middle panel (2) of Table 2. The stability of convergence at higher signal lengths, for example, N P = 2038 is seen by inspecting the bottom panel (3) of Table 2, where all the reconstructed parameters remain exact. In other words, the spectral parameters and concentrations for all 9 metabolites are the same in panels (2) and (3) and these are identical to the input data presented in Table 1. Convergence remained stable for other signal lengths greater than N P = 1700, including the full signal length N = 2048.
In the FFT, the signal length is given by a composed number 2
m
(m = 1, 2,…) and specifically for N = 2048, we have N = 2
11
. However, for the FPT, this restriction is unnecessary, and we can choose an arbitrary truncation level of N such that the partial signal length N
P can be any positive integer smaller than N. As an illustration, we presently chose N
P = 680, 1700, and 2038, none of which is of the form 2
m
prescribed by the FFT. Computations were also carried out at the Fourier-prescribed truncation levels
Figure 1 presents metabolite maps for the Padé-reconstructed concentrations at the 3 partial signal lengths N P = 680, 1700, and 2038 on the top (i), middle (ii), and bottom (iii) panels, respectively, with the noise level of σ = 0.0289 RMS. These metabolite maps are constructed with 2 independent sets of abscissae and ordinates, as follows. For metabolites #3 to 9, namely CHO (3.212 ppm) to myoinositol (3.281 ppm), the abscissae and ordinates are on the bottom and left, respectively. For the 2 metabolites lactate (LAC; 1.332 ppm) and alanine (ALA; 1.471 ppm) that are quite distant from the others, the abscissae and ordinates are on the top and right, respectively.

Metabolite concentrations as reconstructed by the fast Padé transform FPT(−) for the noisy time signal from Tables 1 and 2 at 3 partial signal lengths N P = 680, 1700, and 2038 on panels (i), (ii), and (iii), respectively. The abscissae are dimensionless frequencies as chemical shifts in ppm, and the ordinates are metabolite concentrations in μM/g of tissue wet weight (ww). There are 2 sets of abscissae and ordinates, bottom and left: #3 to 9 (CHO,…, M-INS) and top and right: #1 and 2 (LAC and ALA). ALA indicates alanine; LAC, lactate; M-INS, myoinositol (the full list of metabolites' acronyms is in “Abbreviations”).
On the top panel (i) of Figure 1 at N P = 680, the discrepancy is seen between the exact input data for PC and PE and the Padé-reconstructed data. Only a single metabolite concentration at 3.221 ppm is detected, which is slightly greater than the sum of the true concentrations of PC + PE. The concentrations of the 7 other metabolites are correct at N P = 680 as indicated numerically as well as by the congruence between the symbols (x) and the open circles (o).
At convergence attained with N P = 1700 on the middle panel (ii) of Figure 1, the Padé-reconstructed chemical shifts and concentrations precisely coincide with the input data for all 9 metabolites. The bottom panel (iii) of Figure 1 displaying the metabolite concentration map for N P = 2038 is seen to be identical to panel (ii), further illustrating the stability of convergence of spectral parameters within the FPT. This establishes the robust convergence properties of the FPT in quantification of MRS data.
In Figure 2, the Padé-reconstructed absorption component shape spectra and the total shape spectra are presented at the partial signal lengths N P = 680, N P = 1700, and N P = 2038 for malignant breast data with the noise level of σ = 0.0289 RMS. On the right upper panel (iv) at N P = 680, the absorption total shape spectrum is almost converged. The height of peak “4 + 5” slightly exceeds the actual sum of these 2 peaks, concordant with the reconstructed amplitude presented in Table 2. However, the symmetrically perfect Lorentzian structure of this nearly converged compound peak “4 + 5” on the total shape spectrum gives no indication whatsoever that there should indeed be 2 peaks therein. It is on the component shape spectra, on the top left panel (i), in which the lack of convergence becomes fully evident, in that only 1 peak (#5, PE) appears at 3.221 ppm, whereas peak #4, PC, is not resolved.

Convergence patterns for the Padé-reconstructed absorption component spectra within the frequency range of 3.2 to 3.3 ppm on panels (i) to (iii) and total shape spectra (envelopes) on panels (iv) to (vi) for malignant breast tissue for the noisy time signal from Tables 1 and 2. At the partial signal length N P = 680, the total shape spectrum on panel (iv) has not converged because the corresponding component spectrum on panel (i) failed to resolve peak #4 (PC) and overestimated peak #5 (PE). However, at N P = 1700, full convergence is obtained for all the component spectra on panel (ii) and for the total shape spectrum on panel (v). On panel (ii), the 2 resonances PC (#4: 3.220 ppm) and PE (#5: 3.221 ppm) are accurately detected. This is accomplished despite the fact that PC completely underlies PE. The residual as the difference between the envelopes on panels (iv) and (v) is buried in the background noise. At longer signal lengths, such as N P = 2038, convergence of the absorption component and total shape spectra remain stable, as evidenced on the bottom panels (iii) and (vi). PC indicates phosphocholine; PE, phosphoethanolamine (the full list of metabolites' acronyms is in “Abbreviations”).
On the left middle panel (ii) of Figure 1 at N P = 1700, the component shape spectra have converged. Thus, peaks #4 and 5 are split apart, with the correct heights as is the case for all the other peaks. It can be seen that PC completely underlies PE. The overlap of the PE and PC peaks is so complete that it is no wonder why the presence of PC via the compound “PC + PE” in the envelope spectrum within the narrow band between 3.220 and 3.221 ppm is inconspicuous on, for example, panels (iv) and (v).
At longer signal lengths, as well, including the full signal length N = 2048, for both the absorption component shape spectrum and the total shape spectrum, convergence remains robustly stable. This is illustrated in the bottom panels of Figure 2 at N P = 2038.
Figure 3 comprehensively presents clinically relevant data in MRS typical of breast cancer. 36 Here, chemical shifts are in ppm concentrations in μM/g, peak widths in 10 3 ppm, and peak heights in au. The noise level is expressed in terms of the RMS of the noiseless time signal. The time signal corresponds to a Larmor frequency of 600 MHz, BW of 6 MHz, its reciprocal is the sampling rate τ. The input data are the time signal displayed in panel (i). To avoid clutter, only the real part of the complex time signal is shown (the imaginary part is similar), consistent with the time signal encoded from cancerous breast tissue. 36 Added perturbation is the Gaussian-distributed zero-mean noise at σ = 0.0289 RMS. The input complex signal is the sum of its noiseless counterpart based on the entry parameters from Table 1 plus noise. The full signal length is N = 2048.

Comprehensive clinically relevant view to magnetic resonance spectroscopy (MRS) in breast cancer. Time signal in panel (i) is the real part of the input data cn
from Equation 1. Envelope spectra: fast Fourier transform (FFT) reconstruction nonconvergence at N
P = 2048 on panel (ii) and fast Padé transform (FPT) reconstruction convergence at N
P = 1700 on panel (iii). Component shape spectrum in the
The output data are spectra in panels (ii) to (iv). Metabolite concentrations are in panel (v). Signal–noise separation is shown in panels (vi) and (vii), where FWHMax (spectral poles) equals FWHMin (spectral dips) for false data. The heights of true and false peaks are presented in panel (viii).
Panel (ii) of Figure 3 shows the absorption total shape spectrum as reconstructed by the zero-filled FFT. At full signal length (N = 2048), the Fourier-reconstructed envelope or total shape spectrum is highly inaccurate with a few shortened, broadened peaks and other peaks not even identified, specifically CHO (peak #3) and GPC (peak #6). As opposed to this, with no zero-filling the absorption total shape spectrum in the FPT fully converged at partial signal length N P = 1700 on panel (iii). Most notably, the component shape spectra also fully converged in the FPT at N P = 1700 on panel (iv), including PC, which is completely underneath PE. Identification and quantification of this inconspicuous PC peak is completely impossible with the FFT and postprocessing fitting, as a single perfect Lorentzian for the compound PE + PC (“4 + 5”) would give no justification to assuming more than 1 peak therein.
The symbols used in panels (v) through (viii) are as follows: input data (x) and output data (O, •). To avoid clutter, the FWHM is doubled at 3.220 ppm, and the corresponding PC is denoted by PC* in panels (vi) and (vii). Identification of false, that is, spurious data are achieved by a 3-fold signature: (1) FWHMax = FWHMin as shown in panels (vi) and (vii) via symbol
The converged concentration map at the partial signal length N P = 1700 is shown on top right panel (v). Therein, it is seen that the concentrations of PC and the other metabolites are all retrieved exactly.
Detection of true, that is, genuine data are achieved by the opposite 3-fold signature: (1) FWHMax ≠ FWHMin alongside coincidence of O and
True metabolites lie within the dashed box in panels (vi) and (vii). Virtually no noise enters this box housing the majority of the densely spaced genuine poles (o) and zeros (•). This is a consequence of the high density of the genuine poles and zeros, which, as such, act as if they were repelling the spurious ones.
One genuine zero associated with PE is absent from panels (vi) and (vii), as it lies outside the windowed chemical shifts and FWHM. Its larger FWHMin yields the longest pole–zero distance to secure stability of PE. This is due to the small difference of 0.001 ppm between the chemical shifts of PE and its nearest neighbor PC.
Many aspects influence the shown distributions and performance of the FPT, for example, noise level, positions, widths and heights of peaks, dip locations, pole–zero distances, distances of poles and zeros from the abscissa in panels (vi), (vii), and so forth. The key clinical significance of parameters in MRS reconstructed by the FPT is that the peak heights in panel (viii) multiplied by FWHMax from panel (vi) or (vii) give metabolite concentrations in panel (v). Overall with N = 2048, the FFT in panel (ii) yields only an envelope, lacks convergence, misses 3 metabolites, and gives 4 broadened and severely shortened peaks of no clinical usefulness. At N P = 1700, the FPT converges, providing the diagnostically critical information: metabolite concentrations in panel (v).
To match the FPT in panel (iii) using N P = 1700 of the time signal sampled at N = 2048 (=2 kB), the FFT needs N = 65 536 (=64 kB) signal points in a single encoding, thus causing a formidable 32-fold lengthening of each transient. In the FPT, further improvement in SNR and total acquisition time is achieved using barely a quarter of the 128 transients needed for acceptable SNR in the FFT. This is a 2-fold extra bonus for MRS via the FPT: higher accuracy: better clinical reliability and higher efficiency: shorter examination time for the patient.
Discussion
This is the first study on breast cancer data to directly compare the performance of the conventional Fourier processing with the FPT. As mentioned, such a comparison can only be made for the total shape or envelope spectrum. The results presented in this article for the input data in the presence of added noise clearly demonstrate the superior resolution capacity of the FPT relative to the FFT under the same conditions.
Let us now, once again, review Figure 3, in order to recall some fundamental concepts, 39 but which now relate specifically to breast cancer diagnostics with MRS. We begin with the upper left panel (i) showing the time signal or input data. This time signal must contain the full sought information, namely the metabolic content of the breast cancer tissue. However, with or without the presence of the added noise, no meaningful insights whatsoever can be gleaned therein. In order to extract or “tease out” the needed information, the given time signal must be mapped into another domain, that is, the frequency domain wherein a spectrum can be computationally constructed. This mapping is permissible because time and frequency are a pair of “conjugate variables,” and such a passage is achieved through mathematical transforms. Currently, in clinical practice, the FFT, which is built into every MR scanner, performs this mapping into the frequency domain.
In clinical practice, panel (i) is never actually visualized because the time signal is automatically processed via the FFT into a spectrum. This is the reason for the common misconception that spectra are acquired, that is, encoded or measured. They never are in MRS and MRSI. Rather, spectra are generated through computations by way of numerical algorithms (such as that in the FFT), using the input time signal (encoded or simulated). The FFT spectrum computed from the real and imaginary part of the time signal is displayed in panel (ii) of Figure 3. Typically, the oncologist or radiologist is directly presented with an FFT spectrum, such as that in panel (ii) and the task is to make an interpretation. Needless to say, the rough peaks and the sinc-undulating baseline (due to zero-padding) of the Fourier-reconstructed spectrum would only introduce further ambiguity, when the clinician is seeking just the opposite. Namely, the aim is to confidently render a decision as to whether or not the examined breast tissue is cancerous without recourse to histopathology or other invasive procedures. Surely, the spectral envelope would improve for time signal lengths larger than N = 2048, but even at N = 65 536 used in the cited encoding, 36 the PC and PE peaks could still not be split apart. This would preclude the clinician from making the sought key diagnosis: the presence or absence of PC as a biomarker of breast cancer.
Proceeding to panel (iii), we see the converged total shape spectrum generated via the FPT. This is the maximum information that can be conceivably obtained from an envelope spectrum. Therein, 6 peaks are clearly displayed along the abscissa (chemical shift) and from whose relative heights, substantial insight can be gleaned about the relative concentrations of several metabolites of interest, including some of the components of tCHO. This is obviously valuable information, which the FPT provides at a very short signal length, whereas the FFT would require a formidable 32 times longer signal (32 × 2048 = 65 536) to generate a spectrum such as that from the FPT shown on panel (iii).
One of the reasons for the high resolution of the FPT is that its ratio of 2 polynomials possesses an extra degree of freedom to cancel out noise from the numerator
It was noted earlier that higher magnetic field scanners have been used in attempts to improve resolution and SNR of MRS spectra from the breast. 28,31,32 Indeed, in that way, the recorded MRS time signal would contain less noise relative to 1.5T clinical scanners. However, the hoped-for level of accuracy for distinguishing cancerous from nonmalignant breast was not achieved thereby. 31 Moreover, the cost per examination would become prohibitive for scanners with stronger magnets, thus undermining the entire aim of more widespread use of MRS in breast cancer diagnostics. Thus, the prospect for screening by MRS would become even more remote if pursued via higher magnetic fields. A more promising alternative to such a hardware upgrade would be to upgrade signal processing and complement the FFT by the FPT in the widely available clinical scanners at 1.5T.
In our recent work 20 based on the superior resolution performance of the FPT compared to the FFT for MRS time signals from ovarian cancer, we outlined, in detail, how this resolution advantage of the FPT would change the approach to MRS data acquisition, by encoding fewer and relatively short MRS time signals. This directly translates into shortened examination time, thereby lowering costs of the MRS procedure, as well as being more comfortable for the patient.
The present results indicate that with Padé processing similar advantages would be possible for MRS examinations of the breast. Moreover, because of the frequent need for volumetric coverage in breast diagnostics, the higher resolution of the FPT for MRS becomes even more critical for MRSI since spectroscopic imaging measurements coupled with 3-dimensional spatial resolution must be done within a reasonable total acquisition time to be clinically useful.
The Possibility to go Beyond Assessments of total choline
A converged envelope or total shape spectrum was generated by the FPT, as displayed in panel (iii) of Figure 3. Even with completely optimal conditions (high magnetic field strength, state-of-the-art coil design, meticulous attention paid to proper signal encoding, shimming, and other technical or “hardware” aspects), within, for example, the chemical shift region of interest, between 3.2 to 3.3 ppm, such an envelope spectrum would be the maximum that could possibly be provided using Fourier processing for proton MRS. We noted earlier that this is due to the fact that the FFT is nonparametric and cannot on its own (ie, without subsequent fitting of peaks) provide any information whatsoever about the underlying components. Based upon the envelope spectrum illustrated on panel (iii), it would be impossible to even know that PC lies therein, namely that there is a PC peak beneath PE, let alone to determine the actual concentration of PC.
As reported in our previous work, 6,39,43 the FPT unequivocally identified and exactly computed PC, as well as the other metabolites in the spectra of normal breast, fibroadenoma, and breast cancer, 36 without added noise. Herein, as illustrated on panels (iv) and (v) of Figure 3, the FPT succeeds in this task for breast cancer data with the addition of random noise of σ = 0.0289 RMS. The FPT also performs successfully for these data with much higher noise levels, such as σ = 2.89 RMS (not shown).
Although for the noiseless problems, convergence was achieved at a partial signal length N P = 1500, such that 741 spurious resonances were also generated, with the addition of noise a somewhat longer partial signal length was required (N P = 1700). Thus, 841, that is, 100 more spurious resonances appeared than in the noiseless case. As we anticipated, all facets of the Padé-based SNS, namely pole–zero coincidence, zero amplitude, and marked instability with change in noise level and/or with varying truncations of the total acquisition time, would be needed to distinguish these highly abundant nonphysical resonances from the genuine metabolites. This is illustrated in panels (vi) to (viii) within the slightly enlarged frequency range of 3.16 and 3.34 ppm. In the “borderline” situation of a near-zero amplitude of CHO (peak #3), it is by the complete stability in the face of a 10-fold increase in noise level when going from panels (vi) to (vii) that this true metabolite is recognized.
Thus, via Padé processing accompanied by the SNS concept, the genuine metabolites that are completely overlapping (and that constitute a mere 1% of the generated resonances) are confidently identified and exactly quantified. Moreover, the FPT also performs excellently under another adverse circumstance involving 9 genuine resonances that have vastly different concentrations ranging from 0.100 μM/g (CHO) to 8.125 μM/g (LAC): [LAC]/[CHO]= 81.25. In particular, the success of the FPT in resolving the PC and PE resonances separated by merely 0.001 ppm is even more noteworthy considering that their concentrations differ by a factor of 22.50, that is, [PE]/[PC] = 22.50. When juxtaposed to these accomplishments of the FPT, it follows that fitting algorithms as the current postprocessing sequel to the Fourier-based reconstruction are inadequate for MRS.
Examination of patients is routinely done on clinical scanners with static magnetic field strength B 0 = 1.5−3T. Stronger magnets (eg, B 0 = 4 or 7T) are not generally approved for patients but have been mainly used for research purposes when encoding time signals from healthy volunteers. No restriction applies to in vitro studies where stronger magnets have been used with, for example, B 0 = 14.1T, with the encoded data 36 by way of which the present time signals were synthesized. Spectra computed with time signals encoded using such strong field magnets can offer much richer metabolic information provided that reliable high-resolution processors are used for quantification. Experience gained via in vitro MRS with these high magnetic field strengths is important in making the inference regarding the corresponding in vivo data. Thus, in particular, the unequivocal separation of the strongly overlapping PE and PC resonances provided by the FPT-based processing of noise-corrupted in vitro time signals 36 with B 0 = 14.1T is a strong incentive to apply the same method to the corresponding in vivo data encoded on clinical scanners with B 0 = 1.5–3T.
Limits of the Resolving Capabilities of the FPT for Overlapping Resonances
In our earlier studies,
39,43
the FPT was applied in conjunction with normal breast tissue, fibroadenoma, and breast cancer noiseless synthesized time signals sampled by way of Equation 1 at N = 2048 and the input parameters
In our previous studies
20,40,48
using synthesized noise-corrupted MRS data for brain and ovary, the input parameters
Some Broader Perspectives: Padé-Optimized MRS Within the Framework of Personalized Cancer Medicine
Magnetic resonance spectroscopy covers both steady states and dynamics. The majority of research thus far has been within steady state MRS and MRSI, where metabolite concentrations are stationary or time independent. Dynamic MRS follows the time evolution of metabolite concentrations after intravenous injection of hyperpolarized substrates that can enzymatically catalyze to CHO, LAC, ALA, and so forth.
The power of Padé-optimized MRS is in being able to monitor metabolism of a large number (25 or so) of metabolites, some of which may be cancer markers. This information can then be correlated with the spatial localization of tumor. This can be done not only for initial diagnostics but also during and after therapy. For the latter, the obtained metabolic pathways can be correlated with the dose response of tissue on molecular and cellular levels. Such a multifaceted approach is aimed to aid both early tumor diagnostics and targeted therapies. The obtained results can be used for further developments in drugs that disrupt specific metabolic pathways essential for tumor cell survival and proliferation. Introduction of such drugs into the clinic has already shown that patients vary widely in their responses. Advanced molecular imaging modalities such as MRS as well as a hybrid of positron-emission tomography plus computerized tomography (PET-CT) are poised to play a paramount role in predicting and detecting these responses. Innovations of this type can improve and guide treatment in individual patients in the spirit of truly personalized cancer medicine.
Early identification of response to treatment can be achieved through dynamic MRS as well as by PET-CT. Shortly after administration of the relevant drug, a marked reduction in metabolic uptake can indicate that the patient is responding to the treatment. This is usually seen well before the occurrence of morphologic changes as detected by purely anatomical imaging modalities. With such information at hand, rather than continuing with the same type of treatment for all eligible patients, an appropriate subdivision becomes feasible by identifying the early responders versus those who are nonresponders and for whom prompt switching of therapy would be appropriate. Advanced molecular imaging can be used to recognize early regional responses of the primary tumor as well as response of metastases. Tumor recurrence can also be identified much sooner and with greater certainty, thereby increasing the chances for successful salvage therapy.
Both steady state and dynamic MRS can become cost effective through mathematical optimization of data analysis via signal processing. For steady state MRS/MRSI, as outlined in this article and elsewhere, 20,48 the FPT transform will markedly shorten examination time providing greater patient comfort and lowered costs. In therapy, together with the expected improvement in patient outcome, dynamic MRS is also expected to improve cost-effectiveness by early detection (within days or even hours) of respondents versus nonrespondents to the administered drug (Note # 1). Such advantages could translate into cost reduction by at least a factor of 10 relative to the cost per annum of conventional treatment. However, the stumbling block for dynamic MRS is again in data analysis. Thus far, as in steady-state MRS/MRSI, most investigations using dynamic MRS employ the “FFT + fitting” approaches. Therefore, the numerous drawbacks documented for steady-state MRS are directly transferred to dynamic MRS. This is further exacerbated by phenomenological techniques via fitting used instead of models with mechanistic kinetics for dose–effect relationships. Here, the clinical reliability of dynamic MRS can be improved by a judicious combination of the FPT with Michaelis-Menten saturation kinetics for enzyme catalysis in a mechanistic description of chemical reactions leading to products such as cancer biomarkers.
Conclusions and Related Clinical Implications for Breast Cancer Diagnostics
The entire field of, for example, analytical chemistry was revolutionized by the single discovery of the FFT, which is the fast algorithm (N log2 N) for the discrete Fourier transform (N 2 ). This innovation made an immediate entry into NMR spectrometers that have built in the FFT, which automatically generates total shape spectra from the encoded time signals. The FPT also generates total shape spectra with comparable computational efficiency using the fast N(ln2 N) 2 Euclid algorithm. 39 This very feature of the FPT should facilitate its immediate incorporation into NMR spectrometers and MR scanners. What is important to realize is that the process of encoding is guided by the theory, be it the FPT or the FFT. When having in mind the subsequent processing by the FFT, encoding time signals is already limited at the onset by the need for a large number of transients so as to improve the SNR by averaging these. By contrast, when processing is done by the FPT, the number of needed transients is dramatically reduced. This occurs because the FPT needs only short total acquisition times that in turn yield better SNR. Further improvements in SNR are achieved by noise-suppression capabilities of the FPT due to its nonlinearity. Overcoming poor SNR in itself would represent a major breakthrough for MRS. At a deeper level, the FPT provides MRS with its “raison d’être,” which is automatic and very efficient quantification. Logistically, this can be done through an interface of the FPT software directly connected to the MR scanners, thus enabling immediate spectral analysis. The practical step toward this would be to equip the MR scanner with the FPT algorithm. This would provide direct display of both the FFT and the FPT envelope spectra. The clear advantage of the FPT would be evidenced, as exemplified in a comparison of panels (ii) and (iii) from Figure 3 of this article. This would be the incentive to proceed by way of the mentioned interface to provide quantification, yielding the clinically most relevant metabolite concentrations, as in panel (v) from Figure 3.
The results of the present study indicate that mathematical optimization of MRS and MRSI is needed in order for the potential of these molecular imaging modalities to be realized for comprehensive breast cancer diagnostics. This can be accomplished by the FPT, as shown in the present proof-of-concept study. Thus far, reliance upon conventional Fourier-based spectral reconstruction with postprocessing through fitting is a major reason for the insufficient accuracy of MRS and MRSI in attempts to distinguish breast cancer from nonmalignant changes. In the presence of random noise as in typically encoded time signals, the FPT reliably distinguishes spurious resonances from true metabolites and exactly computes the concentrations of the latter, including the breast cancer marker, PC. The high resolution of the FPT with markedly reduced input data length, demonstrated herein, translates directly into shortened examination time for the patient when the encoded data are analyzed.
These capabilities strongly suggest that by applying the FPT to MRS time signals encoded in vivo from the breast, MRS and MRSI will fulfill their potential to become an accurate, cost-effective method for breast cancer detection, including for screening and surveillance. Since MRS and MRSI entail no ionizing radiation, new possibilities for screening and early detection will open up, especially for risk groups. Padé-optimized MRS and MRSI could be used with greater surveillance frequency among younger women at high breast cancer risk. With Padé-optimized MRS and MRSI, surveillance after breast cancer treatment could also be more frequent as well as more effective.
Footnotes
Appendix A
Abbreviations
Note
Acknowledgments
The authors are grateful to the research funding agencies listed below.
Declaration of Conflicting Interests
The authors declared no potential conflicts of interest with respect to the research, authorship, and/or publication of this article.
Funding
This work was funded by Cancerfonden, Radiumhemmets Research Fund and FoUU through Stockholm County Council.