
Abstract
Background:
To investigate the diagnostic efficacy of choline (Cho) value of magnetic resonance spectroscopy (MRS) in rabbit with VX2 liver tumor via comparative and quantitative analysis with the choline compounds concentration measured by enzyme linked immunosorbent assay (ELISA).
Methods:
MRS was performed on normal liver and VX2 tumor. The Cho value of VX2 tumor was compared with that of normal liver. Tissues were harvested for ELISA to detect the concentrations of acetylcholine (ACh), glycophorophosphygholine (GPC) and phosphochorine (PC). The diagnostic performance of Cho value and concentrations of choline compounds were assessed by receiver operating characteristic (ROC) curve and area under ROC curve (AUC). The specificity and sensitivity were discussed by the maximum Youden’s index.
Results:
The concentration of ACh was obviously higher than that of GPC and PC both in VX2 tumor and normal liver (P < 0.01). Furthermore, the concentration differences among ACh, GPC and PG were the third power of 10. Both the ACh concentration and Cho value of MRS in VX2 tumor were significantly higher than those in normal liver (P < 0.01). The AUC of ACh in VX2 tumor was 0.883, when the cutoff value was 7259000, the sensitivity and specificity of the diagnosis of liver cancer were 94.4% and 77.8%, respectively. The AUC of Cho in VX2 tumor was 0.807, when the cutoff value was 28.35, the sensitivity and specificity of the diagnosis of liver cancer were 83.3% and 77.8%, respectively.
Conclusion:
The change of Cho value in MRS between liver cancer and normal liver was consistent with the changes of concentrations of choline compounds measured by ELISA, especially the change of ACh concentration. The diagnostic efficiency of Cho value and that of choline compounds concentration in liver cancer were extremely similar, with the AUC more than 0.8. We conclude that MRS may be applied as an important, non-invasive biomarker for the diagnosis of liver cancer.
Background
Hepatocellular carcinoma (HCC) is the most common liver cancer with high degree of malignancy and poor prognosis. About half of the patients with liver cancer in the world are concentrated in China. Around 130,000 people die of HCC every year in China, and HCC ranks second in the mortality rate of malignant tumors. 1,2 At present, there are still some problems in the diagnosis and treatment of HCC, such as difficulty in early diagnosis, high recurrence and metastasis rate. The early clinical manifestations and signs of patients are not obvious. The vast majority of patients have advanced to the middle or advanced stage when they are diagnosed. 3 -5 At this time, they often lose the optimal opportunity of operation due to intrahepatic metastasis, portal vein cancer thrombus, severe cirrhosis and ascites. 6,7 Therefore, it is particularly important and urgent to detect the HCC as early as possible.
As we know, it is difficult to detect the liver cancer of small size clinically and radiologically, while its metabolic products have changed in essence. Therefore, it is particularly important and urgent to detect the HCC as early as possible.
As we know, it is difficult to detect the liver cancer of small size clinically and radiologically, while its metabolic products have changed in essence. Hydrogen-1 (1H) proton magnetic resonance spectroscopy (1H MRS) as a non-invasive means can reflect the metabolic products of substances. The spectrogram includes Cho peak (choline), NAA peak (N-acetylaspartic acid), Cr peak (Creatine), Lip peak (lipid), Glx peak (glutamate), etc. The Cho peak is located at 3.2ppm, which represents the total amount of choline compounds. The change of the peak is related to the synthesis and decomposition of cell membranes and the phospholipid metabolism of cell membranes related. 1H MRS can reflects the contents of these biochemical substances quantitatively or semi-quantitatively in different regions of the body by using chemical shifting effect and the different resonance frequencies of 1H and other nuclei in different compounds under strong magnetic field. 8,9 With the application of high field intensity MR scanner and the development of MRS processing software, MRS has gradually become an important non-invasive method for detecting some metabolites in living tissues. At present, MRS technology is widely used in brain, breast, prostate and so on. 10 -12 But it is rarely applied to liver, except for some reports focusing on hepatitis, cirrhosis and fatty liver. However, to our best knowledge, there are few studies to date about the potential diagnostic value of MRS in HCC. 13 The main reason including the liver motion and the interference of respiration and intestinal movement. Previous studies have reported that most of the MRS technology performed on liver tumor is based on the transformation of water and lipid peak to quantitatively analyze the micro-biochemical changes of tissues, and its quantitative analysis is only obtained in theory. 14,15 It has been demonstrated that the concentration of choline compounds in liver cancer has a significant increase, but there are few reports on the relationship between the concentration of choline compounds and MRS in liver cancer. 16 In this study, MRS has been used as a detection tool to establish VX2 in situ hepatocarcinoma model in rabbits. In order to find out the main substance that affects the change of MRS in VX2 liver tumor and normal liver, we quantitatively analyzed and compared the concentration of ACh, GPC and PC in liver cancer and normal liver tissue.
Methods
Animals
In this study, 18 New Zealand white rabbits with a weight range of 2.0-3.0 kg were purchased from the Animal Experimental Center of Chongqing Medical University. The VX2 squamous carcinoma cell line of rabbit was provided by the Institute of Ultrasound Engineering, Department of Biomedical Engineering, Chongqing Medical University. The animal experiment conformed to the National Institutes of Health Guide for Care and Use of Laboratory Animals (Publication No. 85-23, revised 1985) and was approved by the Laboratory Animal Welfare and Ethics of the Third Military Medical University.
Establishment of Animal Tumor Model
The liver VX2 cells were inoculated into rabbits subcutaneously, and the tumor growth was observed intermittently. When the tumor volume was larger than 8 to 10 cm3, the tumors were harvested, washed with the normal saline, and then subdivided into small pieces of tissues about 1 mm3. For the rabbits were going to receive the VX2 tumor implanted in the liver, intravenous access was gained via a marginal ear vein and 0.1 to 0.2 ml (2.5-5 mg) of sodium pentobarbital was given periodically to maintain anesthesia. After laparotomy, a hole about 1-2 mm deep in the middle lobe of the liver was formed by ophthalmologic forceps and then a small piece of tumor tissue was implanted into the hole. Abdominal wall were sutured after gauze hemostasis. Penicillin was given to rabbits for 3 days after operation to prevent infection.
Magnetic Resonance Imaging and MRS
All 18 rabbits, including liver tumor and normal liver tissue, were underwent Magnetic resonance imaging (MRI) and MRS 2 weeks after implantation. The rabbits were anesthetized by intravenous injection of pentobarbital (3%, 40 mg/kg) through ear margin. MRI was performed by MRI scanner (Siemen Verio 3.0T Germany) with an eight-channel surface phased array coil. The rabbits were subjected to the following MRI sequences (Table 1): Axial T1-weighted spin echo [repetition time (TR) of 450 ms, an echo time (TE) of 9.0 ms, a slice thickness of 5.0 mm, Field of view (FOV) = 210 × 210 mm, matrix = 256 × 192, and average = 2]. Axial, Sagittal, Coronal T2-weighted fast spin echo [TR = 2800 ms, TE = 95 ms, a slice thickness of 5.0 mm, FOV = 210 × 210 mm, matrix = 256 × 192, and average = 4]. Axial T1 weighted image (T1WI)-VIBE 3 dimensional volume interpolation fast disturbing phase Gradient echo [TR = 4.6 ms, TE = 1.7 ms, a slice thickness of 2.0 mm, FOV = 210 × 210 mm, matrix = 320 × 272, and average = 2]. The spectroscopic voxel was performed by using point resolved spectroscopy sequences (TR = 2000 ms, TE = 135 ms, FOV = 210 × 210 mm, matrix = 1 × 1, flip angle 90°, and average = 130). MRS volume of interest (VOI) of normal liver was 2cm × 2cm × 1.8cm, which was located in the left lobe next to the middle hepatic vein, avoiding the large blood vessels and the diaphragmatic surface as much as possible, for the left lobe of rabbit liver is larger than other lobes and proximity to the middle hepatic vein is convenient for sampling. MRS VOI of liver cancer was 2cm × 2cm × 1.8cm, which was based on T1WI and T2 weighted image (T2WI) to cover the lesion without necrosis with minimal inclusion of surrounding tissues (major blood vessels, intrahepatic bile ducts, and lateral margin of liver). Cho peak was assigned at 3.2ppm. The area under the peak is proportional to the metabolite concentration.
Sequence Parameters of Conventional Magnetic Resonance Imaging and 1H Magnetic Resonance Spectroscopy.

Abbreviations: TR, repetition time; TE, echo time; FOV, field of voxel; T1WI, T1-weighted imaging; T2WI, T2-weighted imaging; MRS, magnetic resonance spectroscopy.
MRS Data Processing
First of all, the breath and heart rate of the VX2 rabbits were controlled with anesthetics to minimize interference at the maximum extent. Secondly, the VX2 rabbits were treated with fasting for solids and liquids 4-6h before the scanning to reduce the intestinal peristalsis. Finally, the image data were post-processed with spectroscopy software (Siemens) as follows: apodization, zero-filled, phase correction, baseline correction and the measurement of the area under the peak. The representation of ordinate is the signal intensity of metabolic products, and the representation of abscissa is the degree of the chemical shift. The Cho compound signal is detected as a single peak, which was observed at 3.2ppm.
Choline Compounds Quantification
All 18 New Zealand rabbits were placed in transparent cages with good ventilation. When the New Zealand rabbits were tranquilized after MRI, excessive sodium pentobarbital (dose of 100mg/kg) was injected through the ear vein. After 3-5 minutes, the New Zealand rabbits were euthanized without spontaneous breathing and winking reflex. The tumor tissue and liver tissue were taken out. The sampling range should be in accordance with MRS scanning range as much as possible. The tissue was washed with precooled normal saline, the residual blood was removed, and then the tissue was cut into pieces after weighing. Three grams of tissue were selected from different sites and each 1 gram of tissue sample together with 9 ml physiological saline was added into the glass. It was centrifugated by 3000 rpm/min for 10 minutes, and the supernatant was selected for ELISA detection (Rabbit acetylcholine ELISA kit, Rabbit phosphorylcholine ELISA kit, Rabbit phosphoric acid choline ELISA kit, Guduo, China). The concentrations of acetylcholine (ACh), glycerophosphylcholine (GPC) and phosphocholine (PC) in each sample of liver tissue and tumor tissue were detected respectively and the average concentration was calculated.
Histologic Analysis
A piece of cut tumor tissue and a piece of cut liver tissue from each rabbit was selected and subsequently placed in 10% formaldehyde for fixation. After fixation, the 5μm-thick sequential sections were prepared for hematoxylin and eosin (H&E) staining to evaluate the basic histopathology of the specimens.
Statistical Analysis
IBM SPSS Statistics package (version 25.0, SPSS Inc., Chicago, IL, USA) was used for data management and statistical analysis. Kolmogorov-Smirnov test was used for intra-group normality test. Parameters with normal distribution were expressed as mean ± standard deviation, and independent-samples t test was adopted for data analysis. Parameters that didn’t satisfy normal distribution were expressed by median and interquartile spacing, the 2-independent-samples Mann-Whitney U Test was used for data analysis. Taking liver cancer as the reference, ROC curve analysis was used to calculate the diagnostic efficacy of choline compounds concentration measured by ELISA and that of Cho value of MRS. A two-tailed P value of less than 0.05 was considered statistically significant.
Results
MRI
All cases in this study were successfully completed MRI and 1H MRS examination 2 weeks after implantation and obtained the spectral lines with stable baseline, high SNR (signal to noise ratio) and recognizable main peak for analysis. The rabbit VX2 liver cancer appeared as slightly low intense nodules on T1WI and hyperintense signal on T2WI. The Cho value of liver cancer (Figure 1A) and normal liver tissue (Figure 1B) could be seen at 3.2ppm. The Cho value of liver cancer was significantly higher than that of normal liver (P < 0.01), which was shown in Table 2.

The 1H MRS of liver cancer and liver tissue. A, The Cho peak at 3.2 ppm is significantly increased in liver VX2 tumor. B, The Cho peak of normal liver tissue at 3.2 ppm is significantly lower than that of liver cancer. MRS indicates magnetic resonance spectroscopy; Cho, choline.
Differences of Cho Value and Concentration of ACh in Liver Cancer and Liver Tissue.

Abbreviations: Cho, the value under of choline containing peak; ACh, concentration of acetylcholine.
Concentration of Choline Compounds
The concentrations of ACh, GPC, and PC measured by ELISA were shown in Table 3, and the concentration of ACh was significantly higher than that of GPC and PC. The concentration differences among them were with a gradient of 10 to the third power. So we chose ACh as the object of study and found that the ACh concentration of liver cancer was significantly higher than that of normal liver (P < 0.01), which was shown in Table 2.
Concentrations of Choline Compounds in Liver Cancer and Liver Tissue.
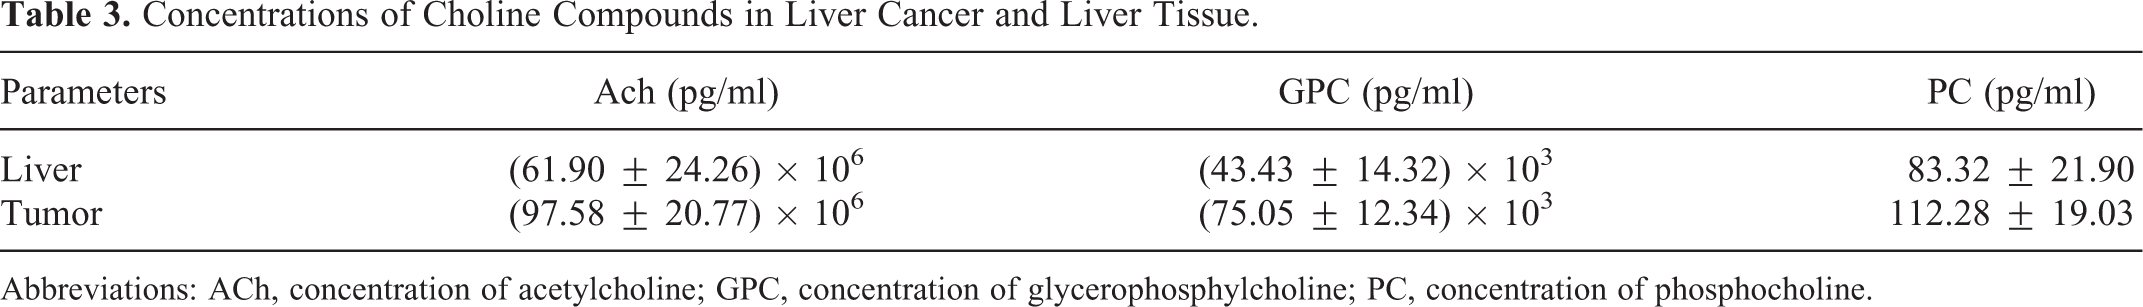
Abbreviations: ACh, concentration of acetylcholine; GPC, concentration of glycerophosphylcholine; PC, concentration of phosphocholine.
ROC Curve Analysis
ROC curve analysis was performed with ACh concentration and Cho value (Figure 2) (Table 4). The AUC of ACh concentration was 0.883, when the cutoff value was 7259000, the sensitivity and specificity for the diagnosis of liver cancer were 94.4% and 77.8%, respectively. The AUC of Cho value was 0.807, when the cutoff value was 28.35, the sensitivity and specificity for the diagnosis of liver cancer were 83.3% and 77.8%, respectively.

The ROC curves for the diagnosis of liver cancer based on Cho value and ACh concentration. ROC indicates receiver operating characteristic; Cho, choline; ACh, acetylcholine.
Diagnostic Efficiency of Cho and ACh in the Diagnosis of Liver Cancer.

Abbreviations: Cho, the value under of choline containing peak; ACh, concentration of acetylcholine.
Histology
The histological results showed that the tumor tissue structure was disordered without obvious degeneration and necrosis, the tumor cell morphology was irregular, the tumor cell size was inconsistent, and the nucleus was heteromorphic (Figure 3A). The liver tissue structure was clear without obvious signs of degeneration and necrosis (Figure 3B).

H&E staining of liver cancer and liver tissue. A, The H&E-stained section shows the tumor cell morphology is irregular, the tumor cell size was inconsistent, and the nucleus was heteromorphic. B, The H&E-stained section shows the liver tissue structure was clear without obvious signs of degeneration and necrosis. H&E indicates hematoxylin and eosin.
Discussion
As we know, conventional MRI can detect pathological changes only when there are morphological changes in tissues and organs, while biochemical and metabolic changes in early stage of disease often precede morphological changes. 1H MRS is developed on the basis of conventional MRI, which can reflect the changes of metabolites in organism from the molecular level. At present, the application of MRS in the diagnosis and treatment assessment of brain tumors is becoming increasingly wide. However, as to the diagnosis and treatment assessment of abdominal tumors, especially for liver tumors, the application of MRS is facing many challenges, due to a variety of factors and conditions. 13 The MRS results are mainly disturbed by the magnetic field uniformity, magnetic field strength and so on. In this study, respiratory inhibition and spectrum processing software were used to alleviate motion interference to some extent during the MR scan.
The significance of Cho peak in 1H MRS is as follows: The Cho peak is located at 3.2ppm, which represents the total content of Cho in tissues, including phosphatidylcholine, phosphatidylcholine, acetylcholine, glycerophosphate choline, etc. Cho is the product of cell membrane metabolism, and its content depends on the level of cell metabolism. The increase of Cho reflects the increased biosynthesis of membrane phospholipids and therefore cellular proliferation. The increase of Cho peak in liver cancer in this study may be related to the proliferation of tumor, the increase of number, mitosis and the increase of phospholipid metabolism in cell membrane. 17 -19
The abnormality of choline compounds can be found in many kinds of cancers. 20 -22 It has been reported that the choline compounds in liver cancer increased significantly. 16 The mechanism is mainly due to the changes of choline kinase, phosphatidylcholine specific phospholipase, glyceridylcholine phosphodiesterase and a variety of choline transporters, consequently leading to the increase of substances such as acetylcholine, choline phosphate, phosphatidylcholine, glyceridylcholine, free choline and other substances.
In previous studies, the concentrations of choline compounds were measured by internal and external phantom or semi-quantitative analysis. 23 The external model containing choline chloride was used to calibrate under 3.0T high field strength. The quantitative strategy was tested by the model with known concentration and normal tissue. Ronald ouwerkerk and other scholars used water signal as internal reference to record the point resolved spectroscopy (PRESS) under the condition of water inhibition and anhydrous inhibition. 24 The linear regression analysis method was used to explore the relationship among choline, liver fat content, body mass index, glycogen content and age. It is suggested that navigator-gated and gradient-echo shimmed press 1H MRS may allow quantification of liver metabolites.
At present, the water lipid phantom is the most common method to quantitatively analyze the concentration of choline compounds. 25 -27 However, there is no report to date about the relationship between the choline compounds concentrations measured by ELISA and the Cho value in MRS. ELISA is a special reagent analysis method based on immune reaction, combining the specific reaction of antigen and antibody with the highly effective catalytic action of enzyme on substrates. It is a relatively mature method for detecting substance concentration with high sensitivity and specificity, which can reduce experimental error to the maximum extent. Therefore, this study focuses on exploring the changes of Cho value and the choline compounds concentrations in liver cancer and liver tissue. The Cho value of liver cancer was significantly higher than that of liver tissue. The concentration of ACh was significantly higher than that of PC and GPC both in liver cancer and liver tissue. It may be speculated that the content of ACh may be the most important factor affecting the Cho value in MRS, for the contents of the other 2 substances were so rare compared with ACh that they might be ignored. It has be reported that ACh is the precursor of cell membrane synthesis. The increase of ACh indicates that the metabolism of cell membrane is vigorous, and the enzyme of cell biosynthesis and catabolism pathway is increased. 28,29 So the increase of ACh in liver cancer may be related to the occurrence and regulation of the tumor. It has been found that acetylcholinesterase (ACHE) decreased significantly in liver cancer, which indicated that there was a system of secretion and regulation of ACh in liver cancer, leading to the remarkable increase of ACh. 30
The ROC curve analysis in this study showed that the AUC of Cho value in MRS and that of ACh concentration measured by ELISA were 0.807 and 0.883, respectively, which indicated that both Cho value and ACh concentration were with the similarly good diagnostic accuracy. However, the measurement of ACh concentration in tissues requires an invasive way to collect samples, which is difficult to implement in clinical work and can only be carried out in a small number of animal experiments. As a non-invasive examination method, MRS can be widely carried out in vivo or in clinical work, which can not only be qualitative, but also be quantitative. In this study, the role of MRS in the qualitative diagnosis of liver cancer has been confirmed.
There are still several shortcomings in this study. Firstly, breathing, heartbeat and blood vessel pulsation cause the magnetic field uniformity to be unstable and affect the signal collection. Consequently, MRS can’t fully reflect the change of material metabolism. Secondly, different susceptibility of multiple organs in the chest and abdominal cavity is easy to lead to poor uniformity, and the stability of the spectrum baseline is not consistent.
Conclusions
1H MRS at 3.0T is feasible to be applied to VX2 liver cancer in rabbits. Both the Cho value in MRS and the choline compounds concentrations measured by ELISA in liver cancer were significantly higher than those of liver tissue. The content of ACh may be the most important factor affecting the Cho value of MRS in liver cancer. As to the qualitative diagnosis of liver cancer, both the Cho value and the ACh concentration had the same good diagnostic accuracy, with the AUC ranged from 0.8 to 0.89. Thus, MRS can be used as a novel, valuable and non-invasive auxiliary examination method for the early diagnosis of liver cancer. Our future research direction is to explore the relationship between the quantitative analysis of MRS and the differentiation degree of liver cancer.
Footnotes
Abbreviations
Authors’ Note
Ruikun Liao and Dan Zhang are the co-first authors. ZT contributed to the study design. RL and DZ carried out the collection and assembly of data and drafted the manuscript. HX did the feature extraction and JM, JY did statistical work. XL, CY prepared figures. XH and BZ participated in the design of the study and helped to draft the manuscript. All authors reviewed the manuscript. All authors read and approved the final manuscript. The datasets generated and/or analyzed during the current study are not publicly available due to data privacy according to the license for the current study, but are available from the corresponding author on reasonable request. The animal experiment conforms to the National Institutes of Health Guide for Care and Use of Laboratory Animals (Publication No. 85-23, revised 1985). Our study was approved by the Laboratory Animal Welfare and Ethics of the Third Military Medical University (approval no. SYXK-PLA-20120031).
Acknowledgments
We appreciate for the efforts of all individuals or teams that were involved in our research.
Declaration of Conflicting Interests
The author(s) declared no potential conflicts of interest with respect to the research, authorship, and/or publication of this article.
Funding
The author(s) disclosed receipt of the following financial support for the research, authorship, and/or publication of this article: This work was supported by the medical research Key Program of the combination of Chongqing National health commission and Chongqing science and technology bureau, China (No.2019ZDXM010); the Basic and Frontier Research Project of Chongqing, China (No.cstc2016jcyjA0294); the Medical Research Key Program of the National Health and Family Planning Commission of Chongqing, China (No.20141016 and No.2016ZDXM026); the Scientific and Technological Innovation Key Program of Chongqing General Hospital, China (No.2016ZDXM03). The funding bodies had played a role in the design of the study, collection, analysis, and interpretation of data and the writing of the manuscript.