
Abstract
Objective:
This study aimed to evaluate the computed tomography number and the variation of dose distribution based on 12-bit, 16-bit, and revised 16-bit images while the metal bars were inserted.
Methods:
The phantoms containing stainless steel, titanium alloy, and aluminum bar were scanned with computed tomography. These images were reconstructed with 12-bit and 16-bit imaging technologies. The “cupping artifacts” computed tomography value of the metal object revised by Matlab software was called the revised 16-bit image. The computed tomography values of these metal materials were analyzed. Two radiotherapy treatment plans were designed using the treatment plan system: (1) gantry was of 0° irradiation field and (2) gantry was of 90° and 270° for 2 opposed irradiation fields. The dose profile and dose–volume histogram of a structure of interest were analyzed in various images. The analysis was based on the radiotherapy plan differences between 3 different imaging techniques (12-bit imaging, 16-bit imaging, and revised 16-bit imaging technologies).
Results:
For low-density metal object (computed tomography value <3071 Hounsfield unit, HU), the radiotherapy plan results were consistent based on 3 different imaging techniques. For high-density metal object (computed tomography value >3071 HU), the difference in radiotherapy plan results was obvious. The dose of 12-bit was 15.9% higher than revised 16-bit on average for the downstream of titanium rod. For stainless steel, this number reached up to 42.7%.
Conclusion:
A 16-bit imaging technology of metal implants can distinguish the computed tomography value of different metal materials. Furthermore, the revised 16-bit imaging technology can improve the dose computational accuracy of radiotherapy plan with high-density metal implants.
Introduction
In clinical radiotherapy, computed tomography (CT) image sometimes contains metal implants. The stainless steel and titanium alloy material implants are mainly used in the implant in vivo. The aluminum material is also commonly used in the supporting structure in vitro. The 12-bit imaging technology is commonly used in CT at present. However, the CT value range of 12-bit imaging technology was −1024 HU to 3071 HU. 1 The CT value of bone tissue with maximum density in human body was within 2000 HU, 2 but the actual CT value of titanium was >6000 HU. 3 The actual CT value of stainless steel was >10 000 HU. 1 The CT value exceeding 3071 HU was considered to be 3071 HU in 12-bit imaging technology. Thus, 12-bit imaging technology cannot accurately describe the CT values of metal implants of different materials. The high-density metal will produce the unreal CT value. Radiotherapy treatment planning system (TPS) will obtain the inaccurate electron density (ED; or tissue density) according to the CT value–density conversion curve, which will in turn cause the following: influence TPS tissue inhomogeneity dose correction results, show inaccurate dose distribution, and produce inaccurate assessment on the tumor tissue as well as normal tissue adsorbed dose.
The CT value range of the 16-bit imaging technology was from −1024 HU to +64 511 HU 4 ; thus, it could better reflect the CT values of the materials with various densities, especially high-density metal material. The 16-bit imaging technology was one of the key factors to improve the accuracy of radiation dose in the metal.
Materials and Methods
Experimental Materials
As shown in Figure 1, the experimental phantom was the intensity-modulated verification phantom produced by the CIRS Company. A circular section metal rod was present in the middle of the phantom. The metal rod textures were aluminum, titanium alloy, and stainless steel and their densities were 2.7, 4.5, and 7.8 g/cm3, respectively. The phantom was scanned with CT (SOMATOM Definition Flash CT produced by Germany Siemens Company) and the original CT image was obtained. The tube voltage was 120 kVp. Effective current was emitted automatically by CT. Axial scan was used for scanning mode. The width of the collimator was 64 × 0.6 mm. The rotation time of the X-ray tube was 0.5 s/circle. The thickness of the scanning layer was 2 mm.

The experimental phantom with a metal rod inserted.
Computed Tomography Image Acquisition and Correction
The images were reconstructed with CT machine’s own 12-bit imaging technology and extended functional imaging (16-bit imaging technology) 5 because “Cupping artifacts” can be observed for high-density metal implants in the interior of the metal object, 6 that is, the metal peripheral CT value was high and middle CT value was low. The value of the metal region was set to a fixed value through Matlab (edition R2014a). The maximum metal CT value of the 16-bit imaging technology was considered the fixed value. The image was called the revised 16-bit CT image. The CT value of the phantom was measured along the red line shown in Figure 1, with the use of Matlab software.
Plan Design
The radiotherapy treatment planning was obtained using Varian Eclipse TPS (edition 11.0), and the dose distributions were calculated as follows based on 3 kinds of CT images: 12-bit CT, 16-bit CT, and revised 16-bit CT images. For irradiation, 2 kinds of radiotherapy plans were designed: (1) Gantry was of 0° single irradiation field. The source skin distance was fixed as 100 cm. The output of the machine was 200 MU. The beam center was considered the center of the phantom. (2) Gantry was of 90° and 270° for 2 opposed irradiation fields. The source axis distance was 100 cm. The beam center was considered the center of the phantom. The output of each field was 100 MU. The radiation field was 10 × 10 cm. X-ray energy was 6 MV. The dose distribution was calculated using analytical anisotropic algorithm, which beneficially improved computational accuracy. 7 The computational dose grid size is 1 mm in TPS.
Results and Discussion
Computed Tomography to ED Calibration
Figure 2 shows the CT to ED curve for 120 kVp tube voltage. For 12-bit CT image, the upper limit of HU value is 3071 HU, and the orresponding relative ED is about 2.5. This means that for high-density matter such as stainless steel and titanium, the relative ED is the same—2.5. For 16-bit CT image, the upper limit is much larger. It can give CT values for different metal implants.
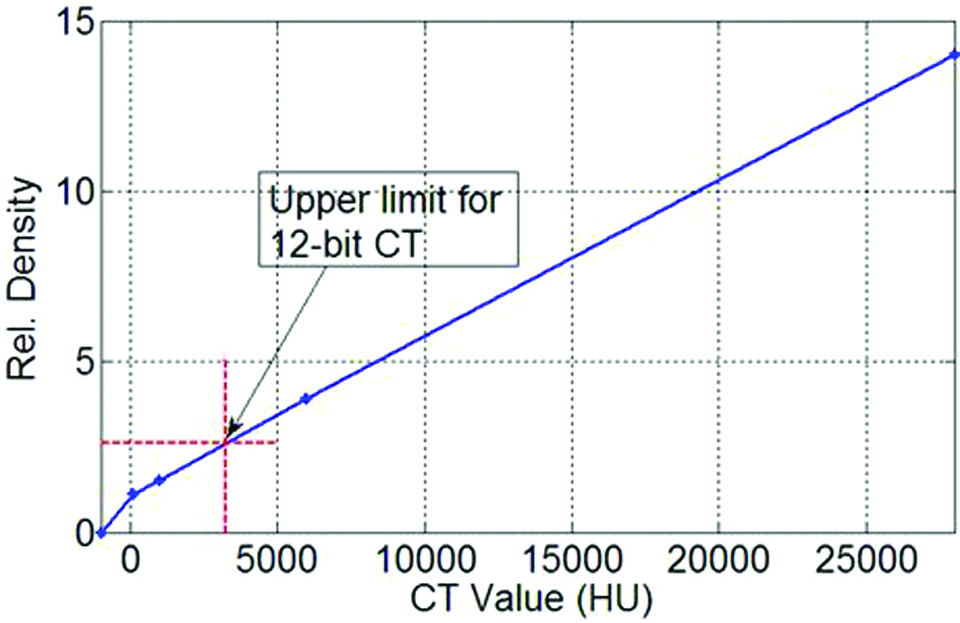
Computed tomography (CT) to electron density curve derived at 120-kVp tube voltage. Rel. Density indicates relative electron density.
Computed Tomography Values of CT Images Obtained Through Different Reconstruction Methods
For 12-bit images, the CT value in the middle of the aluminum rod showed shallower “cupped” distribution, as shown in Figure 3A, that is, the center was slightly low and the peripheral was slightly high. The highest CT value was 2159 HU. The CT value of the metal portion was 3071 HU in Figure 3B and C. The difference in CT value in the red arrowhead portion as shown in Figure 3A-C was due to metal artifact. The higher the metal density, the more severe the artifact.

Computed tomography (CT) value containing metal phantom (A) 12-bit aluminum, (B) 12-bit titanium, (C) 12-bit stainless steel, (D) 16-bit aluminum, (E) 16-bit titanium, (F) 16-bit stainless steel, (G) revised 16-bit aluminum, (H) revised 16-bit titanium, and (I) revised 16-bit stainless steel.
For 16-bit images, Figure 3A was compared with Figure 3D, and both images were consistent, indicating that for aluminum materials, the 12-bit was the same as the 16-bit image. The CT values in Figure 3E and F showed deeper “cupped” distribution. The cupped phenomenon of stainless steel was more serious. The highest CT values of titanium alloy and stainless steel were 7050 and 12 960 HU. The cupping artifact in the metal was caused by the beam-hardening effect. The X-ray from the CT was not monoenergetic when the beam was passing through the metal, and the X-rays with low energy were absorbed first. Only high-energy rays can thread the metal centers. For the same material, the energy of X-rays increased and the attenuation coefficient decreased. So the CT number of metal centers was lower than that of metal edges. The metal density increased, and the cupped artifact was more serious.
In Figure 3G-I, the CT value of the metal portion in 16-bit image was set to a fixed value with Matlab software because the CT value of the object with uniform density was constant, and the CT value of the metal edge was highest.
Treatment Planning Results
Figure 4 was the dose distribution map of a single field.The dose distribution maps of Figure 4A, D, and G were close. The dose distribution maps of Figure 4B and C were close, suggesting that the radiation treatment plan of titanium alloy was similar to that of stainless steel reconstructed based on the 12-bit image. The difference in the isodose distribution map among Figure 4B, E, and H was obvious, especially at 140, 120, 100, and 80 cGy. Compared to Figure 4C, the difference in the isodose distribution map in Figure 4F and I was large, especially for the downstream of the metal rod at 120, 100, 80, and 60 cGy. It implies that for titanium and stainless steel rod, the computed dose distribution based on 12-bit, 16-bit, and revised 16-bit image showed large difference.
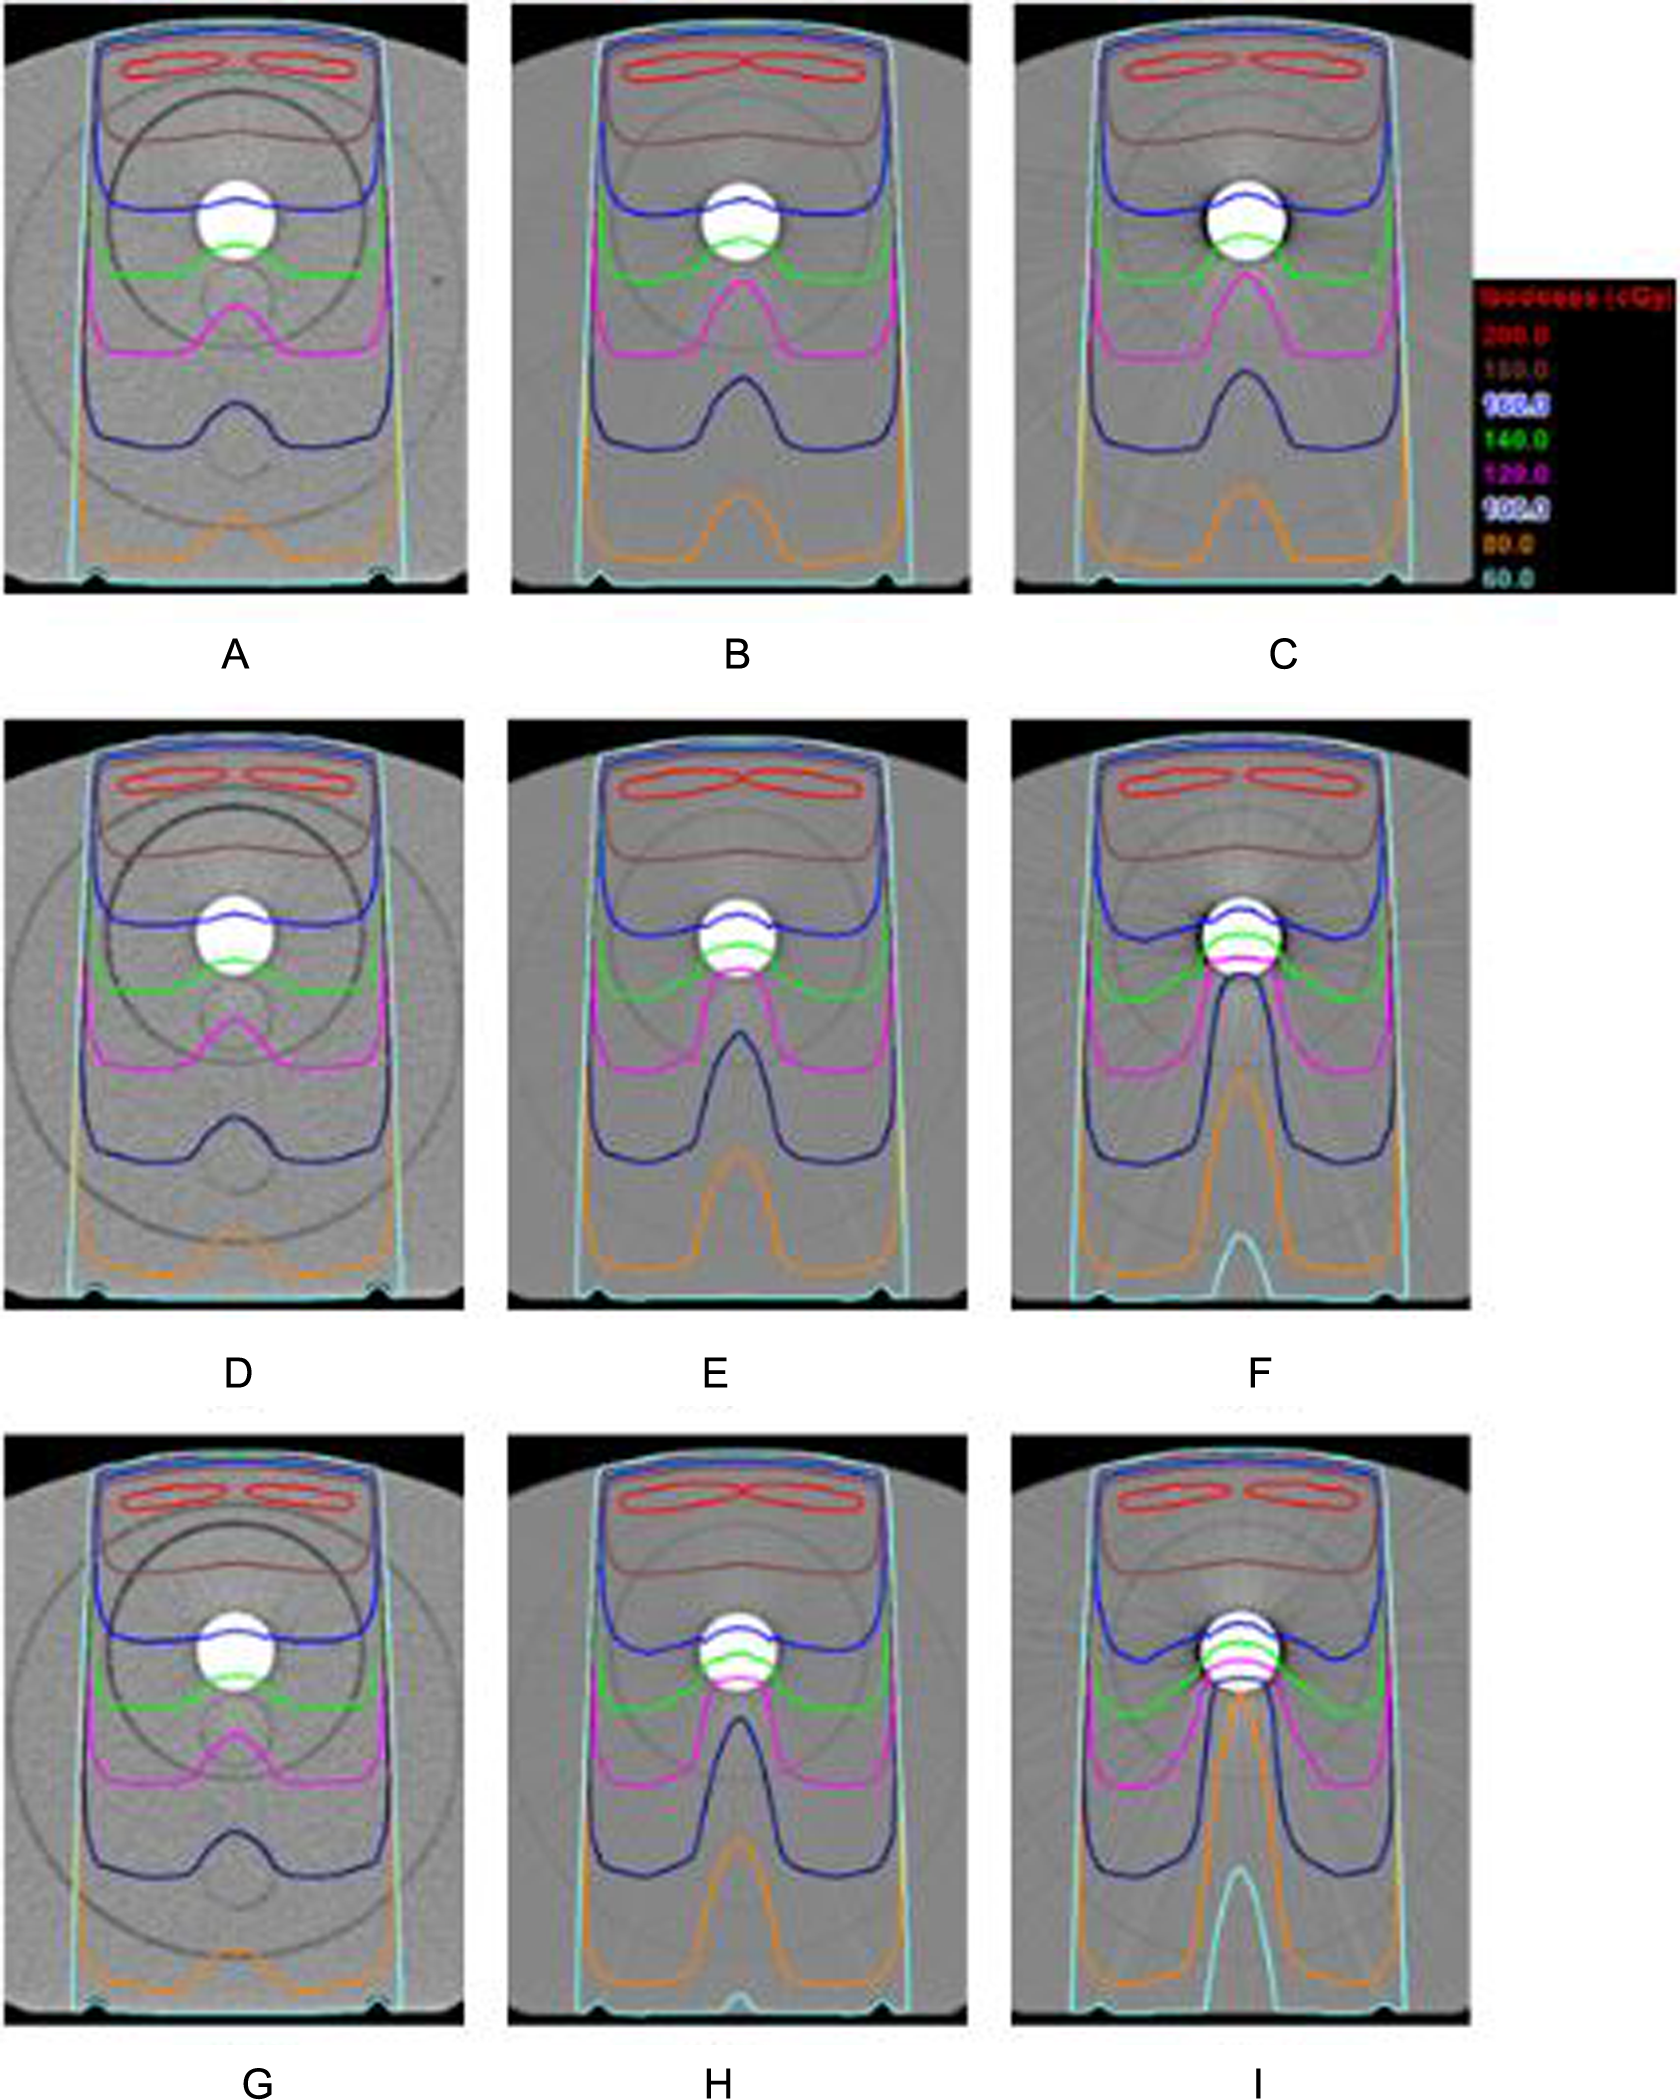
Distribution map of single-field dose (A) 12-bit aluminum, (B) 12-bit titanium, (C) 12-bit stainless steel, (D) 16-bit aluminum, (E) 16-bit titanium, (F) 16-bit stainless steel, (G) revised 16-bit aluminum, (h) revised 16-bit titanium, and (I) revised 16-bit stainless steel.
Figure 5B-D shows the dose profile along the red line in Figure 5A. For aluminum bar, dose profile for 12-bit, 16-bit, and revised 16-bit agreed perfectly. For titanium, dose profile agreed above the metal and discorded below the metal for 12-bit,16-bit, and revised 16-bit. The dose of 16-bit was obviously smaller than the 12-bit below metal and the revised 16-bit was smallest. For the titanium region and the area below the metal, the dose of 12-bit was 15.9% greater than revised 16-bit on average. And this number was 5.04% for 16-bit. For stainless steel, the results were similar to titanium, but the difference was much larger between the 3 curves below the metal. The dose on average for 12-bit and 16-bit was 42.7% and 14.6% greater than revised 16-bit, respectively, for the metal region and the area below the metal.

(A) The sketch of the irradiation beam. Dose profile following the beam trajectory (shown as the red vertical line) while different metal bars were inserted. (B) Aluminum bar. (C) Titanium bar. (D) Stainless steel bar.
To evaluate the effect caused by metal implants in clinical treatment, we delineated a circle (shown in Figure 6A) as the structure of interest. Figure 6B-D shows the dose–volume histogram (DVH) of the structure of interest for every situation in Figure 4. For aluminum bar inserted, the 12-bit, 16-bit, and revised 16-bit curves agreed perfectly. Like Figure 5B, aluminum bar resulted in little difference in DVH for 3 CT images. However, great difference in DVH were observed between 12-bit, 16-bit, and revised 16-bit while titanium bar or stainless steel bar were inserted. For stainless steel, the maximum dose in structure of 12-bit, 16-bit, and revised 16-bit was 130, 114, and 108 cGy, respectively. The maximum dose of 12-bit and 16-bit were 20.4% and 5.6% higher than the revised 16-bit image.

(A) The structure of interest (shown as a red circle) in the phantom. Dose–volume histogram (DVH) of the structure of interest while different metal bars were inserted. (B) Aluminum bar. (C) Titanium bar. (D) stainless steel bar.
Figure 7 shows the dose distribution map of opposed field. A tiny difference in the dose distribution map was observed in Figure 7A, D, and G. The dose distribution map of Figure 7b was closely similar to that of Figure 7C, suggesting that the radiation treatment plan of titanium alloy was similar to that of stainless steel reconstructed based on 12-bit. The difference in the isodose distribution map was obvious in Figure 7 B, E, and H, especially at 160, 150, 140, and 130 cGy Figure 7C, F, and I showed great difference in the isodose distribution map, especially at 160, 150, 140, 130, and 120 cGy. It suggested that the radiation treatment plan differed observably based on 12-bit, 16-bit, and revised 16-bit images for titanium and stainless steel rods.

Dose distribution map of opposed irradiation field. (A) 12-bit aluminum, (B) 12-bit titanium, (C) 12-bit stainless steel, (D) 16-bit aluminum, (E) 16-bit titanium, (F) 16-bit stainless steel, (G) revised 16-bit aluminum, (H) revised 16 bit titanium, and (I) revised 16-bit stainless steel.
As shown in Figures 4 and 7, the 12-bit CT imaging reconstruction technology obtained a metal CT value of <3071 HU for aluminum. The 12-bit and 16-bit reconstruction imaging technologies obtained the same metal CT value, resulting in the same radiation treatment plan. The revised 16-bit reconstruction technology could better calibrate the metal CT value, resulting in uniform metal CT value. However, its effect on the treatment plan was indistinctive. Using the 12-bit CT imaging reconstruction technology, metal CT value >3071 HU was obtained for titanium alloy and stainless steel; the difference in metal CT values for the 12-bit and 16-bit reconstruction imaging technologies, thereby resulting in a large difference in radiation treatment plan. The revised 16-bit reconstruction technology could better calibrate the metal CT value, resulting in uniform metal CT value and having great influence on treatment plan.
Conclusion
In radiotherapy, precision of computed dose distribution of a patient with metal implants is very important. The mistake in dose distribution may affect therapeutic result of tumor or harm the normal tissues. A 16-bit imaging technology with metal implants can distinguish the CT values of different metal materials. Compared to the 12-bit imaging technology, the 16-bit imaging technology and revised 16-bit imaging technology can improve the dose computational accuracy of the radiation treatment plan. In this study, the dose was calculated using analytical anisotropic algorithm, which may affect the accuracy of dose value, especially for the region surrounding the metal. 8 To ensure accuracy, further research will be conducted using Monte Carlo simulations and dosimetric measurement.
Footnotes
Abbreviations
Declaration of Conflicting Interests
The author(s) declared no potential conflicts of interest with respect to the research, authorship, and/or publication of this article.
Funding
The author(s) disclosed receipt of the following financial support for the research, authorship, and/or publication of this article: This work was supported by Changzhou Sci & Tech Program of China (Grant no. CJ20130019), and the Natural Science Foundation of Jiangsu Province Research of China (Grant no. BK20151181).