
Abstract
Objective:
This study employs dual-source computed tomography single-spectrum imaging to evaluate the effects of contrast agent artifact removal and the computational accuracy of radiotherapy treatment planning improvement.
Method:
The phantom, including the contrast agent, was used in all experiments. The amounts of iodine in the contrast agent were 30, 15, 7.5, and 0.75 g/100 mL. Two images with different energy values were scanned and captured using dual-source computed tomography (80 and 140 kV). To obtain a fused image, 2 groups of images were processed using single-energy spectrum imaging technology. The Pinnacle planning system was used to measure the computed tomography values of the contrast agent and the surrounding phantom tissue. The difference between radiotherapy treatment planning based on 80 kV, 140 kV, and energy spectrum image was analyzed.
Results:
For the image with high iodine concentration, the quality of the energy spectrum-fused image was the highest, followed by that of the 140-kV image. That of the 80-kV image was the worst. The difference in the radiotherapy treatment results among the 3 models was significant. When the concentration of iodine was 30 g/100 mL and the distance from the contrast agent at the dose measurement point was 1 cm, the deviation values (P) were 5.95% and 2.20% when image treatment planning was based on 80 and 140 kV, respectively. When the concentration of iodine was 15 g/100 mL, deviation values (P) were −2.64% and −1.69%.
Conclusion:
Dual-source computed tomography single-energy spectral imaging technology can remove contrast agent artifacts to improve the calculated dose accuracy in radiotherapy treatment planning.
In clinical radiotherapy, computed tomography (CT) images sometimes involve a contrast agent 1,2 that contains iodine 3,4 to distinguish normal and tumor tissues. The high density of iodine will produce artifacts in the CT image. 5,6 Such artifacts will generate unrealistic CT values in the image. Consequently, the radiotherapy treatment planning system (TPS) will obtain an inaccurate electron density (or tissue density) from the CT value density conversion curves. Such inaccuracy will influence the correction calculation results of the uneven dosage of TPS tissue. The TPS will fail to obtain the accurate dose distribution and will instead generate an inaccurate evaluation of tumor and normal tissues. Therefore, artifact reduction is one of the key factors to consider in improving the calculation accuracy of TPS radiotherapy dose containing high density of the material in vivo.
Accurate results of dose distribution for medical personnel can improve the evaluation accuracy relative to the radiotherapy effect and side effects on normal tissue. Meanwhile, artifact reduction by a contrast agent can improve the quality of medical images and can thus help medical personnel avoid misdiagnosis.
The use of higher contrast enhancement can improve the image quality of CT 7 ; moreover, the contrast media during treatment planning CT scan may influence dose calculation. 8 Some scholars believe there is little influence of contrast media for treatment planning of these tumors. 9 Choi et al 10 found that the doses (maximum, mean, and the dose of 95% of planning target volume (PTV) received [D95%]) of PTV70 and PTV59.4 calculated from the enhanced CTs were lower than those from the nonenhanced CTs for head and neck cancer (P < .05). Although controversy exists regarding the dosimetric influence of the contrast agent, the existence of contrast agent artifacts and their influence on dose calculation have to be considered.
Dual-source CT (DSCT) is expected to improve this phenomenon. The DSCT has 2 sets of X-ray imaging systems that can produce 2 different energy X-rays, such that 2 groups of images are obtained at the same position at the same time. The energy spectra of 2 groups of images were analyzed and fused to establish the third set of images. 11 The DSCT single-spectral imaging technology can efficiently remove contrast agent artifacts.
Materials and Methods
Establishment of Scanning Phantom
The phantom was a Computerized Imaging Reference Systems CIRS intensity-modulated radiation therapy-verified phantom produced by CIRS, Incorporated, USA. Syringes filled with contrast agent were inserted into 3 hollow columns as indicated by the red arrows in Figure 1A. The syringe diameter was 2 cm, and a certain air gap was observed with a hollow motif cavity. The contrast agent, produced by China Yangtze River Pharmaceutical Group Limited Company, is iohexol injection. The main ingredient was C19H26I3N3O9, with 30 g/100 mL of iodine. Using different ratios of distilled water, we simulated different concentrations of contrast agent in vivo. The iodine contents were 30, 15, 7.5, and 0.75 g/100 mL. The final concentration was used to display the small intestine in radiotherapy.

Phantom in experiments.
Scanning Parameters of DSCT
The model was scanned in a DSCT machine (Somatom definition flash) produced by SIEMENS Company, Germany. The voltages of the 2 X-ray tubes were 80 and 140 kV. The average value of effective current was automatically given by CT. The collimator width was 64 × 0.6 mm, the pitch was 0.8, the rotation time of the X-ray tube was 0.5 s/ring, and the motif scanning thickness was 2 mm.
Image Processing
Two groups of images obtained at 80 and 140 kV were transmitted to Syngo Dual Energy image (SIEMENS) software. Using the principle of energy spectral imaging, we selected the appropriate kV value to process and fuse the artifact. The third group of spectrum images obtained was considered satisfactory by 3 doctors. To facilitate the description, the images obtained at X-ray tube voltages of 80 and 140 kV and through energy spectrum analysis were called the 80 and 140 kV and energy spectrum images, respectively.
Measurement and Statistical Analysis of CT Values
The phantom image was transmitted to the treatment planning software produced by the Pinnacle Company. Pinnacle TPS adds 1000 to the CT number and deletes the remaining negative numbers because CT value of air is considered to be 0 in the TPS. The CT value was measured at the central level along the vertical red line in Figure 1B.
Design and Evaluation of Radiotherapy Treatment Planning
The Pinnacle radiotherapy TPS was used to design different treatment plans and to calculate dose distribution. The PRIMUS PLUS linear accelerator produced by SIEMENS was used for simulation, and adaptive convolution was employed as the dose calculation algorithm. Contrast agent electron density values are corrected in the planning system according to metal.
12
Electron density calibration curve is specified with certain kV. We applied 3-dimensional conformal irradiation to the phantom with a 6-MV X-ray. We used 2 radiotherapy planning designs: one was 0° and 180° opposite field irradiation and the other was 90° and 270° opposite field irradiation. The source skin distance (SSD) of first kind of treatment was 90.0 cm, and SSD of the second kind of treatment source was 84.9 cm. The output of accelerator in each field was 100 MU. The size of field is 30 cm (Y) × 12 cm (X). The isodose distribution of treatment planning was analyzed. The dose of the A to I points in the center level of the motif is analyzed in Figure 1B. The distance between adjacent measuring points was 1 cm. The difference in radiotherapy planning results between the energy spectral image and the other 2 images was evaluated using the following formula:
where P is the relative difference, DS is the measuring dosage value of the measurement point based on spectral imaging, and Dk is dosage value based on the 80 and 140 kV measurement points.
Result
Image Results
Figure 2 shows CT image containing 30 g/100 mL of iodine. The width of the window was 500 HU, and the window level was 750 HU. Figure 2A shows the 80-kV image. A significant high-density artifact region appeared around the contrast agent and throughout almost the entire scanning area. The region of the contrast agent and the surrounding tissue cannot be clearly distinguished. Figure 2B shows the 140-kV image. The artifact mainly concentrated in the upper and inferior part of the contrast agent region. Figure 2C shows the energy spectrum image with only a small twill. The contrast agent region can be clearly distinguished.

Image of contrast agent containing 30 g/100 mL of iodine; (A) is the 80-kV image; (B) is the 140-kV image; and (C) is the energy spectrum image.
The image quality in Figures 3 and 4 was better than that in Figure 2 because of the reduced iodine content of the contrast agent. However, artifacts were serious in the 80- and 140-kV images.
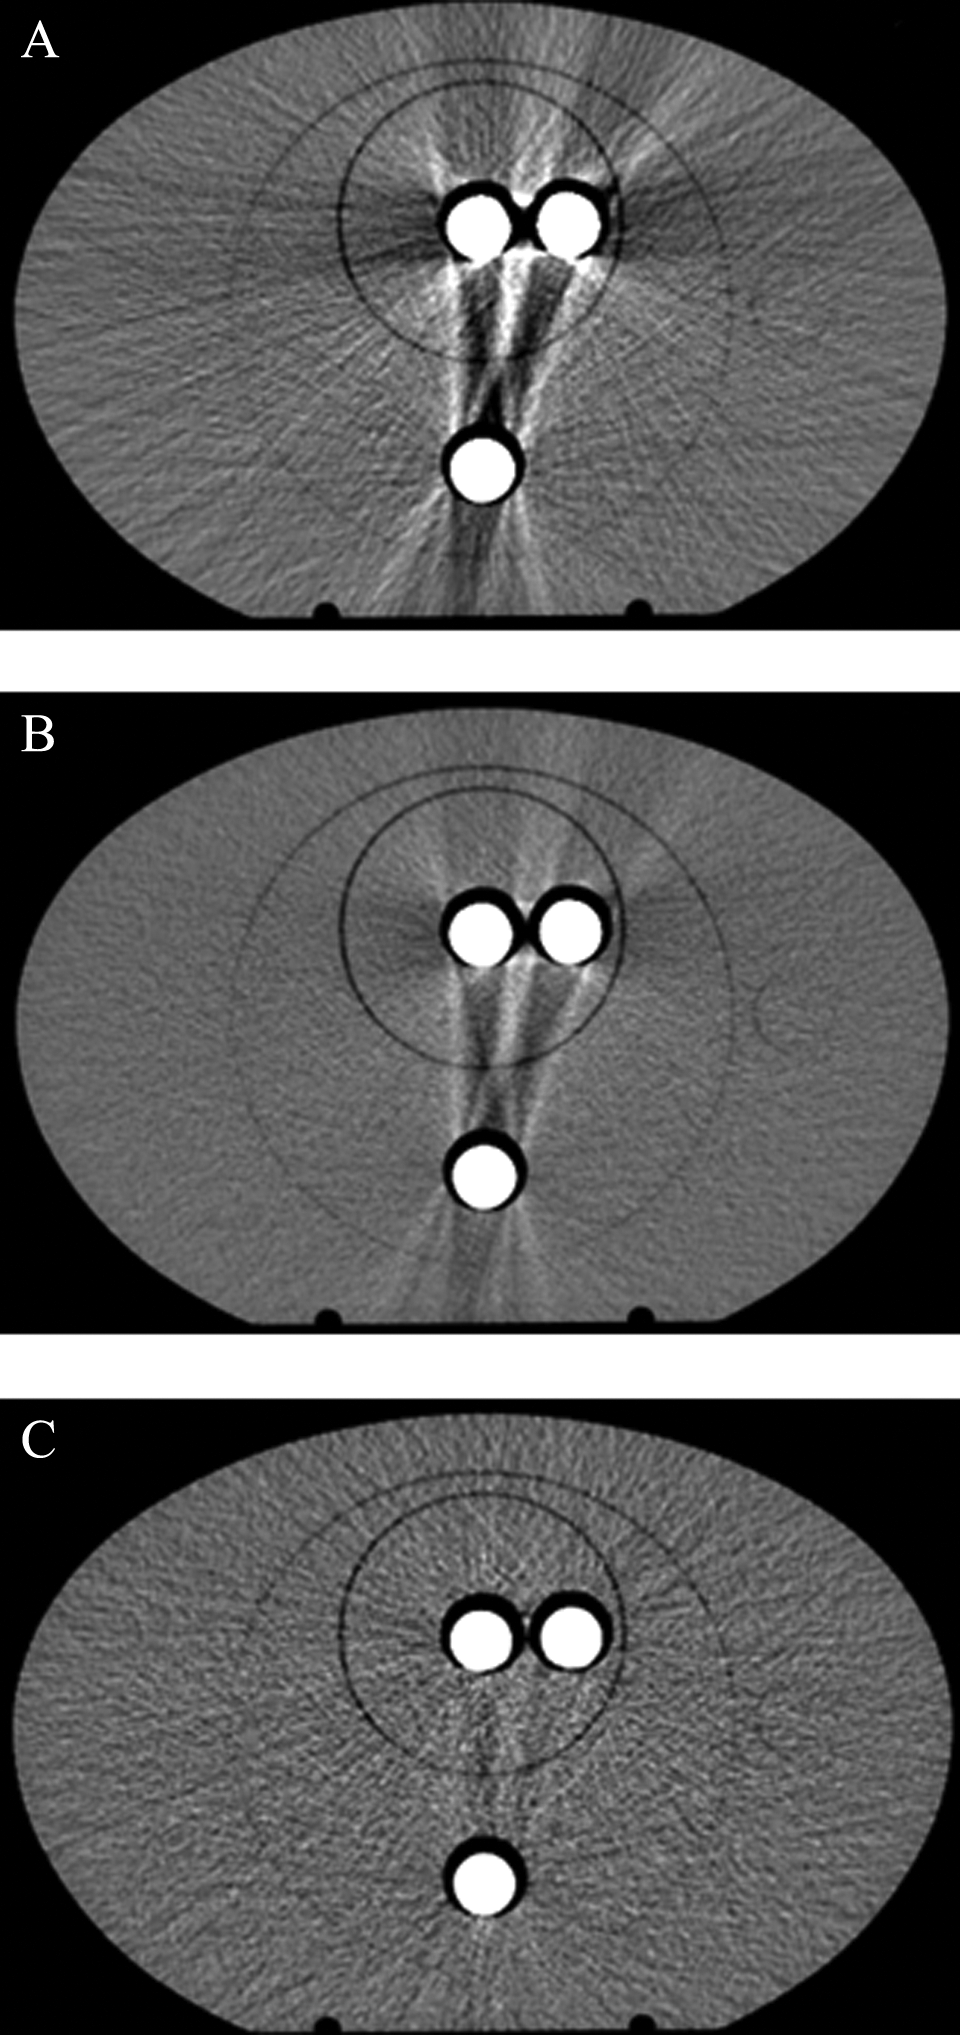
Image of contrast agent-containing iodine with 15g/100 mL; (A) is the 80-kV image; (B) is the 140-kV; and (C) is the energy spectrum image.
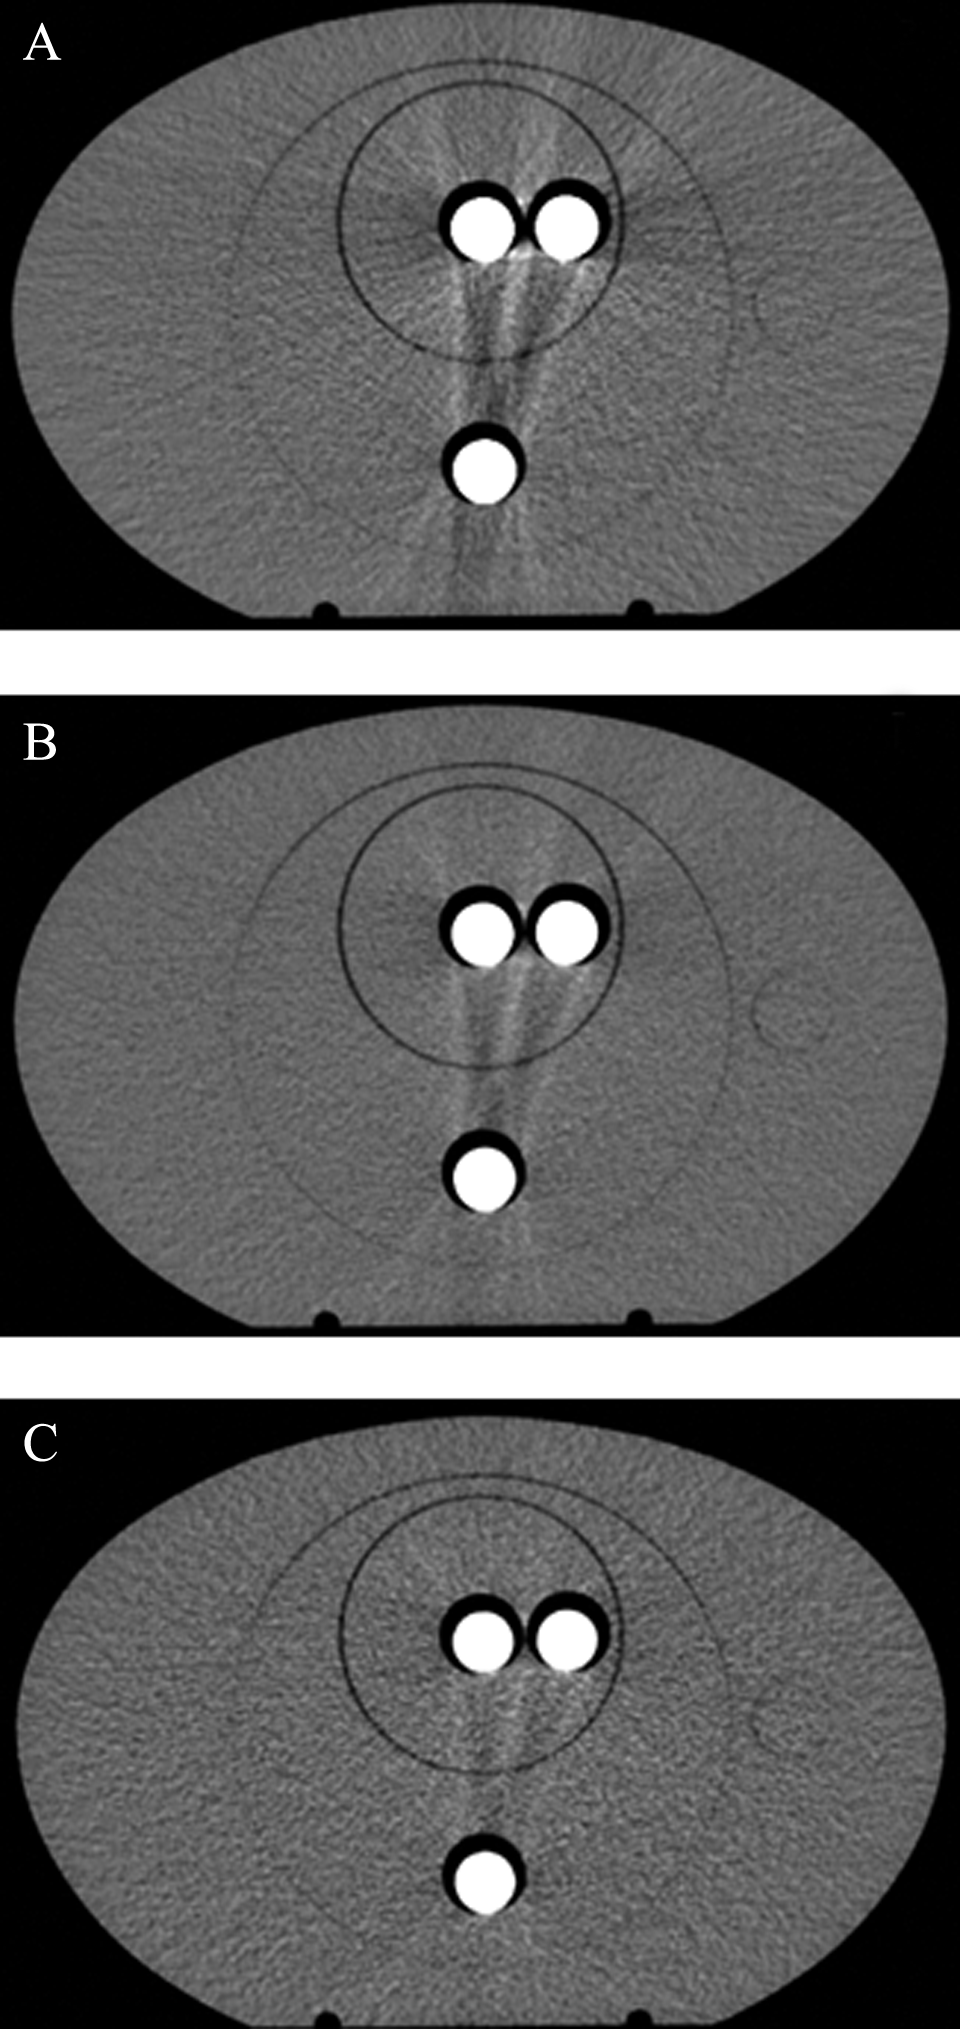
Image of contrast agent containing 7.5 g/100 mL of iodine; (A) is the 80-kV image; (B) is the 140-kV image; and (C) is the energy spectrum image.
According to artificial identification, quality was comparable among the 3 images when the content of iodine agent was 0.75 g/100 mL, as shown in Figure 5. The density of the contrast agent in Figure 5A is higher than that in the other 2 images. The highest contrast agent CT values of the 80 kV, 140 kV, and energy spectrum images are 1290, 1170, and 1090 HU, respectively.

Image of contrast agent containing 0.75 g/100 mL of iodine; (A) is the 80-kV image; (B) is the 140-kV image, and (C) is the energy spectrum image.
Comparison of the Measurement Results of CT Value
The CT value of CIRS phantom was approximately 1000 HU and that of air was 0 HU. The CT values are measured along the vertical red line in Figure 1B.
Figure 6A shows the image when the iodine content is 30 g/100 mL. The CT value of the part with red arrows was less than 1000 HU. The minimum CT value at 12 cm was 270 HU. The part with black arrows was hollow, but the minimum value was 570 HU. The CT value of the part with red arrows was less than 1000 HU in Figure 6B. The minimum CT value was 710 HU at 12 cm. The minimum part with black arrows had a CT value of 240 HU. Only a very small part of the CT value of the phantom deviated from 1000 HU as shown in Figure 6C.

Computed tomography value of the image of contrast agent containing 30 g/100 mL of iodine; (A) is the 80-kV image; (B) is the 140-kV image; and (C) is the energy spectrum image.
Figure 7 shows the image when the iodine content is 0.75 g/100 mL. The part with red arrows indicates small gaps between the motifs. The maximum CT values of the contrast agent were 1290, 1140, and 1080 HU in Figure 7A to C, respectively. As regards the emitting surface of the contrast agent, the CT values of 3 images exhibited a small difference as indicated by the black arrows.

Computed tomography value of the image of contrast agent containing 0.75 g/100 mL of iodine; (A) is the 80-kV image; (B) is the 140-kV image; and (C) is the energy spectrum image.
Comparison of Radiotherapy Treatment Planning
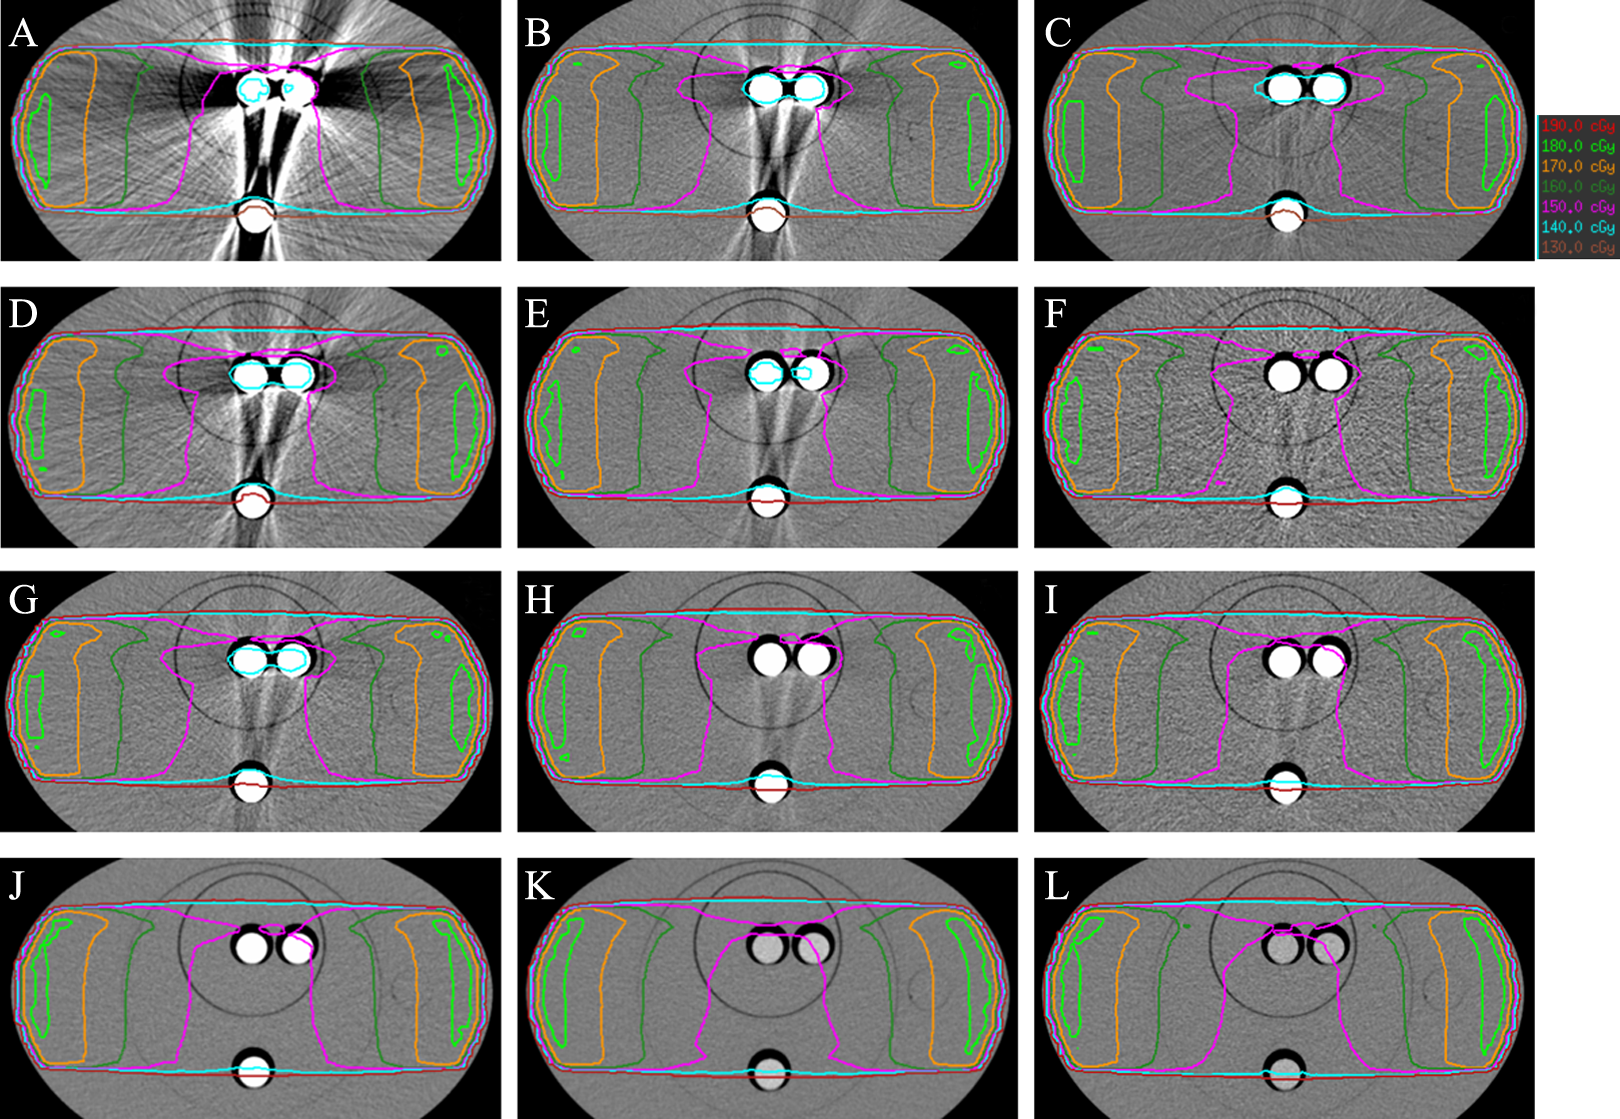
Figure 8A to I shows the isodose distribution map of 0° and 180° opposite fields in radiotherapy treatment planning. Figure 8A to C shows the distribution map of contrast agent with iodine content of 30 g/100 mL. Differences in isodose lines attributed to the contrast agent were observed among the 3 images. The differences in isodose line at 180, 170, and 160 cGy were significant. Figure 8D-F shows the distribution map of the contrast agent with iodine content of 15 g/100 mL. Differences in isodose lines were observed among the 3 images. These differences were attributed to the contrast agent. The differences in isodose line at 180, 170, and 160 cGy were significant. Figure 8G to I shows the isodose distribution map of the contrast agent with iodine content of 7.5 g/100 mL. Differences in isodose line were observed among the 3 images at 180 and 170 cGy. Figure 8H and I shows a slight difference in isodose line at 170 cGy. As regards the distribution map of the isodose line containing contrast agent with iodine content of 0.75 g/100 mL, only a slight difference was observed at 170 cGy. Figure 9A to I shows the 90° and 270° opposite field isodose distribution maps in radiotherapy treatment planning. The result is similar to that in Figure 8.

Comparison of radiotherapy treatment planning results (0° and 180° opposite field): (A) is the 80-kV image containing 30 g/100 mL of iodine; (B) is the 140-kV image containing 30 g/100 mL of iodine; (C) is the energy spectral image containing 30 g/100 mL of iodine; (D) is the 80-kV image containing 15 g/100 mL of iodine; (E) is the 140-kV image containing 15 g/100 mL of iodine; (F) is the energy spectral image containing 15 g/100 mL of iodine; (G) is the 80-kV image containing 7.5 g/100 mL of iodine; (H) is the 140-kV image containing 7.5 g/100 mL of iodine; (I) is the energy spectral image containing 7.5 g/100 mL of iodine; (J) is the 80-kV image containing 0.75 g/100 mL of iodine; (K) is the 140-kV image containing 0.75 g/100 mL of iodine; and (L) is the energy spectral image containing 0.75 g/100 mL of iodine.
Comparison of radiotherapy treatment planning results (90° and 270° opposite field): (A) is the 80-kV image containing 30 g/100 mL of iodine, (B) is the 140-kV image containing 30 g/100 mL of iodine, (C) is the energy spectral image containing 30 g/100 mL of iodine; (D) is the 80-kV image containing 15 g/100 mL of iodine; (E) is the 140-kV image containing 15 g/100 mL of iodine; (F) is the energy spectral image containing 15 g/100 mL of iodine; (G) is the 80-kV image containing 7.5 g/100 mL of iodine; (H) is the 140-kV image containing 7.5 g/100 mL of iodine; (I) is the energy spectral image containing 7.5 g/100 mL of iodine; (J) is the 80-kV image containing 0.75 g/100 mL of iodine; (K) is the 140-kV image containing 0.75 g/100 mL of iodine; and (L) is the energy spectral image containing 0.75 g/100 mL of iodine.
We compared the doses at the horizontal measurement point. Figure 10A shows the dose for point A, with a distance of 1 cm from the edge of contrast agent, on the basis of the 80- and 140-kV images. This result is compared with the spectrum image treatment plan. When the iodine content was 30 g/100 mL, the deviation values (P) were 5.95% and 2.20%. When the iodine content was 15 g/100 mL, the deviation values (P) were −2.64% and −1.69%. When the iodine content was 7.5 g/100 mL, deviation values (P) were −2.30% and −1.42%. When the iodine content was 0.75 g/100 mL, the deviation values (P) were 0% and −0.93%. With the increase in measuring point distance, the P value gradually decreased.

Deviation of dose at measurement point.
At point E with a distance of 5 cm from the edge of contrast agent, when the iodine content was 30 g/100 mL, the deviation values (P) were 4.10% and 1.19%. When the iodine content was 15 g/100 mL, the deviation values (P) were −1.8% and −0.96%. When the iodine content was 7.5 g/100 mL, the deviation values P were −1.48% and −0.96%. When the iodine content was 0.75 g/100 mL, the deviation values (P) were −0.76% and −0.19%.
We compared the doses at the vertical measurement point, as shown in Figure 10B . For point F with distance of 1 cm from the edge of contrast agent and on the basis of the 80- and 140-kV images as opposed to the energy spectrum image treatment planning, when the iodine content was 30 g/100 mL, the deviation values (P) were 3.86% and 1.51%. When the iodine content was 15 g/100 mL, the deviation values (P) were −3.52% and −1.17%. When the iodine content was 7.5 g/100 mL, the deviation values (P) were −2.28% and −1.31%. When the iodine content was 0.75 g/100 mL, the deviation values (P) were −1.22% and −0.39%. With the increase in measuring point distance, P value gradually decreased.
Discussion
Computed tomography scan with contrast agent containing high iodine concentration will produce artifacts primarily because the X-ray produced by the X-ray tube will attenuate after penetrating the contrast agent. This condition will distort the detected projection data, thereby causing the loss of image data around the implant. This case is similar to the condition produced by metal artifacts 13 and is a major drawback of conventional CT. The higher the density of contrast agent is, the more severe artifacts is. With the increase in tube voltage (140 kV), image quality is improved relative to the strong penetration of the ray generated by increasing voltage. The detector can detect more projection data. When patients injected with a high density of material were scanned, the enhanced scanning voltage can improve the image quality to a certain extent, but the lack of scanning voltage improvement will cause data loss on the soft tissue image.
The DSCT energy spectrum is expected to eliminate artifacts generated by high-density material in traditional CT. 7 The effect is identified by the phantom results. The principle is that dual-source, single-energy spectral imaging can arbitrarily select 2 substances for separation. When the substances are scanned by 2 X-rays with different energies, their attenuation also changes. The data under different energies are calculated to obtain the images at different keV values. Adjusting the keV value can yield a satisfactory image. The homogeneous material (contrast agent, air, and mold body tissue) CT values are relatively equal in Figure 6C, and these 3 material of CT values were 4050, 0, and 1000 HU. Not all regions will accurately reflect the uniform material CT value in Figure 6A and B. Comparing 80-kV image, 140-kV image, and the energy spectrum image of low contrast agent density (0.75 g/100 mL of iodine), CT value of the contrast agent region and other minimal region is a small difference. Dual-energy CT scanner improved CT imaging, without increasing dose relative to single-energy CT. Sometimes patients scanned by dual-energy CT would receive significantly less dose for the same noise level compared to single-energy CT. 14
When the concentration of iodine was 30 g/100 mL, the dose value at measuring point was greater than that in the corresponding spectrum images. This finding can be related to the sharp decrease in the CT value of the surrounding tissue with conventional contrast agents. For the 80- and 140-kV images, the maximum deviation values (P) were 5.95% and 2.20%, respectively, as opposed to the energy spectrum image treatment plan. With the decrease in the iodine concentration of the contrast agent, the difference in treatment planning results among the 3 images is reduced. When the iodine content was 0.75 g/100 mL, the quality difference between high kV and low kV was not significant.
The radiotherapy dose curves obtained by different images were not exactly similar mainly because the planned system according to the CT value-density conversion curves determined electron density. The interference of artifacts caused the planned system to obtain inaccurate electron density, which can result in the deviation of dose calculation. An energy spectrum image can better remove the artifacts and can thus cause the dose distribution to be relatively close to the actual value.
Conclusion
Our results showed that the use of contrast agents with high iodine concentration will produce more serious artifacts in conventional CT examination. Energy spectral imaging can efficiently reduce artifacts to improve the dose calculation accuracy of radiotherapy treatment planning.
Footnotes
Declaration of Conflicting Interests
The author(s) declared no potential conflicts of interest with respect to the research, authorship, and/or publication of this article.
Funding
The author(s) disclosed receipt of the following financial support for the research, authorship, and/or publication of this article: This work was supported by the Municipal Social Development Project of Changzhou City, Jiangsu Province, China (CJ20130019).