
Abstract
Purpose:
To present our experiences in understanding and minimizing bowtie-filter crescent artifacts and bowtie-filter normalization artifacts in a clinical cone beam computed tomography system.
Methods:
Bowtie-filter position and profile variations during gantry rotation were studied. Two previously proposed strategies (A and B) were applied to the clinical cone beam computed tomography system to correct bowtie-filter crescent artifacts. Physical calibration and analytical approaches were used to minimize the norm phantom misalignment and to correct for bowtie-filter normalization artifacts. A combined procedure to reduce bowtie-filter crescent artifacts and bowtie-filter normalization artifacts was proposed and tested on a norm phantom, CatPhan, and a patient and evaluated using standard deviation of Hounsfield unit along a sampling line.
Results:
The bowtie-filter exhibited not only a translational shift but also an amplitude variation in its projection profile during gantry rotation. Strategy B was better than strategy A slightly in minimizing bowtie-filter crescent artifacts, possibly because it corrected the amplitude variation, suggesting that the amplitude variation plays a role in bowtie-filter crescent artifacts. The physical calibration largely reduced the misalignment-induced bowtie-filter normalization artifacts, and the analytical approach further reduced bowtie-filter normalization artifacts. The combined procedure minimized both bowtie-filter crescent artifacts and bowtie-filter normalization artifacts, with Hounsfield unit standard deviation being 63.2, 45.0, 35.0, and 18.8 Hounsfield unit for the best correction approaches of none, bowtie-filter crescent artifacts, bowtie-filter normalization artifacts, and bowtie-filter normalization artifacts + bowtie-filter crescent artifacts, respectively. The combined procedure also demonstrated reduction of bowtie-filter crescent artifacts and bowtie-filter normalization artifacts in a CatPhan and a patient.
Conclusion:
We have developed a step-by-step procedure that can be directly used in clinical cone beam computed tomography systems to minimize both bowtie-filter crescent artifacts and bowtie-filter normalization artifacts.
Keywords
Introduction
Image-guided radiation therapy (IGRT) is important to ensure accurate delivery of radiation dose to tumors and to decrease dose to normal structures. 1 Cone beam computed tomography (CBCT) is one of the most important modalities for IGRT and has been routinely used in clinics to set up patients by registering the CBCT image with the corresponding simulation computed tomography image. 2 The image quality of CBCT is critical for accurate and reliable patient positioning, especially when automatic image registration is used. However, the image quality of CBCT is suboptimal due to many factors. One of these factors is geometric nonideality. 3 –6 Because the gravity center of a heavy linear accelerator (LINAC) does not match to the rotation center, and the CBCT system, including the radiation source, rotation center, and imager (detector), is not a solid piece, the components of the CBCT system may shift during rotation, and their positions move away from “ideal positions.” This geometric variation during gantry rotation may reduce the spatial resolution, induce geometric artifacts, and potentially degrade the accuracy of imaging guidance. 3 –10 Studies have been proposed to address the issues by modeling the system geometry, estimating the variation in model parameters, and incorporating the geometric variation into the CBCT reconstruction algorithm. 3,4,11,12
This geometric variation also causes alignment variation in a bowtie-filter (BF) with the radiation source and the imager when the BF is added to the CBCT system. The BF was originally used to reduce the radiation dose to patients and has been found to reduce the scatter in projection images and improve CBCT image quality. 13,14 However, this alignment variation causes a variation in the BF projections during gantry rotation and induces a crescent-shaped band when the projections are reconstructed into CBCT images. 15,16 This band is thus named the BF crescent artifacts (BCA). Research has been reported to reduce the BCA. 15,16 One approach used a model to fit this variation measured by in-air blank scans and consequently corrected this variation in the normalization process. 15 Another used a group of in-air blank scans to represent the BF position variation with the gantry rotation. 16 Both of the methods demonstrated promising results. However, residual artifacts still present after the correction for both approaches, and the underlying cause of the residual artifacts may not be well understood. In addition, both studies used in-air projections to normalize the BF modulation, differing from the clinical CBCT in the Varian On Board Imager (OBI) system (Varian Medical System, Palo Alto, California), which uses a projection of a norm phantom with the BF to do the work. 17 Therefore, the effectiveness of the 2 strategies in correcting the BCA for the clinical system is not clear. Moreover, a misalignment of the norm phantom, which still presents after a physical calibration, could induce a BF normalization artifact (BNA).
The purpose of this study is to investigate the combined effects of BCA and BNA in a clinical CBCT system and to develop a practical and optimal procedure to minimize their effects. Specifically, we will (1) apply the principles of the 2 previously proposed approaches in the clinical CBCT system to compare their effectiveness in reducing the BCA, (2) study the underlying cause of the residual BCA by investigating the BF position and profile variations, (3) propose an analytical approach to minimize the norm phantom misalignment and thus reduce the BNA, and (4) finally present a step-by-step combined procedure to minimize the BCA and BNA for the clinical CBCT system.
Materials and Methods
The CBCT system with a full-fan BF in the Varian OBI was used in the study, and the full-fan mode was studied because BCA are mostly apparent in this mode. A cylindrical norm phantom with 25 cm diameter and 28 cm height was used as the test phantom (unless specifically elucidated). A total of 360 projections were acquired over 200° rotation using the “high-quality head” protocol. The study was composed of the following 4 parts: (1) investigate the BF position and profile variations and their repeatability, (2) apply the principles of the 2 previously proposed BCA correction approaches in the clinical system using the system’s reconstruction software, (3) study the impact of norm phantom misalignment and methods to minimize it, and (4) present a step-by-step combined procedure in reducing BCA and BNA.
Bowtie-Filter Position and Profile Variations
It was reported that BCA were induced by translational position variation in either the BF or the radiation source. 15,16 Similar to those studies, translational position variation in the BF during gantry rotation and its repeatability were investigated. Because the BF was designed to modulate only in one direction, it seems that only the translational variation in the direction of modulation would induce the BCA. However, BF position variation during gantry rotation is complicated. A rotational variation may exhibit as translational motion in both directions for a point on the BF. It may also change the profile of the BF projection. Therefore, in this study, we also studied the BF projection profile variation due to these position variations. Assume that U and V are local coordinates of the detector system; U is tangent to the detector center rotation orbit and V is perpendicular to the detector center rotation orbit. The BF rotates with the detector, and thus, the same U and V coordinates can apply to the BF. The BF is designed to modulate in U direction. Metal bearing balls (BBs) attached to the BF were used to study the translational position variations and their repeatability. The projection profile at V = 0 was used to represent the BF profile. The translational position variation in the U direction was used to fit with a model to correct the BCA in one of the correction strategies.
Previous BCA Correction Strategies
We applied the 2 previously proposed BCA correction strategies 15,16 in our clinical CBCT system. Strategy A used a model to predict the BF position shift and applied the shift for each gantry angle with an in-air BF projection to correct for the BF position variation. 15 Strategy B used a set of BF projections at each gantry position acquired in-air to correct the variation. 16 The Varian CBCT system uses a norm phantom projection instead of an in-air projection to normalize the BF modulation. To utilize the CBCT reconstruction software in the system, instead of correcting the normalization file, we corrected each of the projections to apply the BCA correction strategies. The corrected projection was expressed as:

where θ is the gantry angle, Proj (U, V, θ) is the projection at gantry position θ, Projcor(U, V, θ) is the corresponding corrected projection, Air (U, V, θ0) is the in-air projection of BF at the normalization calibration gantry angle θ0, and AirBCAcor (U, V, θ) is the in-air projection of the BF at any gantry angle θ to correct the BF position variation effect. For strategy A, AirBCAcor (U, V, θ) was obtained by shifting the U value of the Air (U, V, θ0) for each gantry angle according to a model or expressed as:

where SU is the correction shift depending on the gantry angle θ and can be determined by fitting the data of BF position varying with the gantry rotation in U direction. It can be fitted with the following equation:

A similar sinusoidal model was used previously by Zheng et al. 15 The sinusoidal model was used because the gravity center, and the rotation center of a gantry do not coincide and only the shift in U direction causes BCA. For strategy B, AirBCAcor (U, V, θ) were simply obtained using the set of projections in a blank scan obtained earlier. Thus,

The projections of the test phantom were converted into the raw data format and modified into Porjcor using Equation 1, with both strategies, and finally converted back into the Varian hnd data format in the CBCT system and reconstructed into CBCT images using the software in the OBI system.
Correction for BNA
As mentioned earlier, a projection of BF with a norm phantom instead of with air is used to normalize the BF modulation in the Varian OBI CBCT system. The normalization projection was acquired by averaging 5 projections at the gantry angle of 0° with BF mounted, and the normal phantom was placed at the isocenter position. The reason behind using the norm phantom is to reduce the nonlinear effect so that the normalization projection has relatively a small intensity variation. 17 However, adding the norm phantom into the normalization process may also induce error if the norm phantom is not aligned properly. In fact, even with the best effort, it is difficult to perfectly align the norm phantom with the isocenter due to the uncertainty of the isocenter and the limited line width of laser or cross hairs. In addition, the radiation source and the detector may shift position after system service and with time due to wear of mechanical parts. We studied the effect of the misalignment of the norm phantom and named the image artifacts induced by the misalignment as BNA. Bowtie-filter normalization artifact affects the whole reconstruction images and could be visualized in 2 ways: one is the bright ring at the boundary of the norm phantom radius and the other is to worsen the existing BCA and make it half dark and half bright. We proposed a 2-step procedure to minimize the BNA: (1) we recalibrated the normalization projection using a vendor recommended physical calibration procedure and (2) we used an analytical approach to further minimize the misalignment because the physical calibration cannot achieve perfect alignment. We defined a term of symmetrical index (SI) for the norm phantom projection image and calculated the SI varying with an integer shift ▵ pixels to determine the misalignment. The idea of SI is using the middle point of the sampling line in the U direction on the projection image as the mirror symmetry center at first and calculating the sum of absolute intensity difference of paired symmetric pixels based on the center. Then the center is shifted left and right Δ pixels to find out the location with the minimum sum, and the shift associated with the location is defined as Δopt. So the SI is defined as:
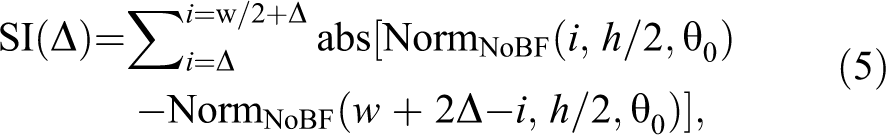
where NormNoBF (U, V, θ0) is the projection of norm phantom without the presence of BF at the calibration gantry angle θ0; w and h are the width and height of the projection image. If the index was outside the projection, the missing intensity was obtained by a linear extrapolation.
We noted that NormNoBF (U, V, θ0) can be obtained by measuring Norm (U, V, θ0) and Air (U, V, θ0), the projection with both the norm phantom and the BF, and the in-air projection with the BF, using the following relation:

Thus, the SI in Equation 5 can be calculated without taking the actual normalization projection of the norm phantom without the BF. By calculating the SI for various shifts ▵, we can determine the misalignment to be the shift with the minimal SI, and we defined it as ▵opt. Thus, we can correct the misalignment by shifting the U coordinates with ▵opt for Norm (U, V, θ0), which is stored in the vendor reconstruction system and Air (U, V, θ0) in Equation 1. The 2 BNA-corrected projections become

and

Since Norm (U, V, θ0) has been corrected for BNA, the in-air projection Air (U, V, θ0) need to be corrected accordingly to compensate the artificial shift in stored NormBNAcor (U, V, θ0). The CBCT images of the test phantom with various shifts were reconstructed to study the effect of the misalignment in image artifacts. Strategy A was used for each of the ▵ shifts to reduce the interference of the BCA effect so that the misalignment effect can be more clearly presented.
A Step-By-Step Combined Procedure to Reduce BCA and BNA
To perform combined BNA and BCA corrections, Equation 1 is changed to:

We evaluated the combined BNA and BCA correction approaches by comparing various combinations of 3 BNA-correction approaches, which are (1) none, (2) first-step BNA correction (physical calibration), and (3) final BNA correction (include analytical approach), with 3 BCA-correction approaches, which are (1) none, (2) strategy A, and (3) strategy B for the norm phantom. Standard deviation of Hounsfield unit (HU) along a sampling line in an axial CBCT image was used to quantify the evaluation. Based on the results, we developed a step-by-step combined procedure to reduce BNA and BCA in a Varian OBI CBCT system.
Our proposed BNA correction procedure for each OBI system has the following 3 steps illustrated in Figure 1:
Follow the instructions of ‘Normalization Scans’ part from the OBI manual, rotate the gantry at θ0 (usually at 0° for the MV x-ray, and 90° for the kV x-ray), align the norm phantom in the isocenter position, and scan the Norm (U, V, θ0). Remove the norm phantom, and scan the Air (U, V, θ0). Calculate SI (Δ) according to Equations 5 and 6; determine the Δopt, and correct Air (U, V, θ0) and Norm (U, V, θ0) into AirBNAcor (U, V, θ0) and NormBNAcor (U, V, θ0) using Equations. 7 and 8, respectively. AirBNAcor (U, V, θ0) is stored in the vendor machine and NormBNAcor (U, V, θ0) is stored too as the normalization projection.

Illustration of Bowtie-Filter normalization artifact (BNA) and bowtie-filter crescent artifacts (BCA) correction process; step 1: scan Norm (U, V, θ0); step 2: scan Air (U, V, θ0); step 3: calculate Δopt and correct Air (U, V, θ0) and Norm (U, V, θ0) into AirBNAcor (U, V, θ0) and NormBNAcor (U, V, θ0); step 4: scan and store AirBNAcor (U, V, θ); step 5: scan and correct Proj (U, V, θ); step 6: reconstruct Projcor (U, V, θ).
The proposed BCA correction procedure applying strategy B includes a preparation step (step 4) for each OBI system, and 2 correction steps (steps 5-6) for each imaging object illustrated in Figure 1:
4. Scan in air with BF mounted only and collected the in-air projections asAirBNAcor (U, V, θ0).
The above-mentioned correction steps need to be done only once for each machine and may be checked monthly or annually for quality assurance.
5. Scan Proj (U, V, θ) for the scanned object; correct Proj (U, V, θ) into Projcor (U, V, θ) using Equation 9.
6. Replace Proj (U, V, θ) with Projcor (U, V, θ) in the reconstruction folder in the OBI system for CBCT reconstruction with the Feldkamp-Davis-Kress reconstruction algorithm. 18
A computer program to perform these steps has been developed. A CatPhan was tested to demonstrate the combined BNA and BCA correction procedure. A real patient with a brain tumor undergoing radiotherapy and daily CBCT image guidance was also used retrospectively to test the procedure. The location of the projection images in the computer system for daily IGRT was identified, and the projections were imported into the computer program. After combining BNA and BCA corrections, the projections were exported back to the directory for CBCT image reconstruction utilizing the reconstruction software in the system.
Results
Bowtie-Filter Position and Profile Variations
Figure 2 shows the BF translational position variation during gantry rotation represented by a BB in both the U and the V directions for 6 scans (with 3 in clockwise and 3 in counterclockwise scan direction). The displacement was plotted relating to (which is 90° in this study). We noted that the variation was up to 8 pixels (∼3 mm) across the gantry angles for both U and V directions, and they were slightly different between clockwise and counterclockwise scans. The variations were composed of a systematic component, which can be predicted by the gantry angle, and a random component, which cannot be predicted by the gantry angle. The random variation was negligible in the U direction compared to the systematic variation, and the 3 scans were repeatable. Therefore, the variation in this direction can be well predicted by the gantry angle. It was fitted by a model presented by Equation 4. The fitting parameters were a1 = 3.45, a2 = 1.17, a3 = −176.4, and a4 = 3.06, with R2 = 0.99 for clockwise, and a1 = 3.79, a2 = 1.10, a3 = −158.9, and a4 = 3.59, with R 2 = .98 for counterclockwise. This model was used for Strategy A to correct for the BCA. Considering that the BF only modulates in the U direction, this model should excellently correct for the BCA with minimal residue artifacts. However, we noted a nonnegligible random variation in the V direction. The impact of this large random variation on the residue BCA was not known.

Bowtie-Filter (BF) position variations with the gantry angle in U and V directions and their repeatability. A, Clockwise scans and (B) counterclockwise scans.
Figure 3 shows the BF projection intensity profile variations (along the U direction at V = 0) with gantry rotation. Figure 3A shows the amplitude variations in the profile with gantry angles for 4 scans (2 clockwise and 2 counterclockwise). The amplitude for each scan was normalized at θ = 190°. The amplitude varied noticeably with a systematic component predictable by the gantry angle and a random component. The variation was different between clockwise and counterclockwise, and the repeatability of the 2 scans for either clockwise or counterclockwise was comparable to random variation. Scans performed weeks later did not change the variations. In addition, we noted that the amplitude was unusually small at the starting of a scan (starting at θ = 90° for clockwise and θ = 290° at counterclockwise) and quickly increased to normal after several projections. We speculated that this unusual behavior was due to image lag 19 and would not be further investigated in this study. Figure 3B shows 9 sampling BF projection profiles for different gantry angles (θ = 110°, 130°, 150°, 170°, 190°, 210°, 230°, 250°, 270°) for a counterclockwise scan (counterclockwise scan 1 in Figure 3A). The profiles varied noticeably in terms of translational shifts and amplitude variations. The amplitude variation was up to 2.3%. Figure 3C shows the replot of the 9 profiles after shift correction using Equation 3 and amplitude correction with linear scaling using the data of a different scan (counterclockwise scan 2 in Figure 3B). The variation in shift vanished, and the amplitude variation was partially reduced. Figure 3D shows the replot of the 9 profiles in Figure 3B after shift correction using Equation 3, and amplitude correction using the data of the same scan (counterclockwise scan 1 in Figure 3A). The variations in both shift and amplitude were mostly reduced. The amplitude variation in Figures B, C, and D would correspond to BCA correction strategy A, B, and an ideal strategy. However, because the bowtie filter profile cannot be obtained when scanned with a phantom, we were not able to reconstruct a CBCT image with this ideal correction strategy.

Study of Bowtie-Filter (BF) profile variations. A, Amplitude variation of BF intensity profile with gantry angle for 4 different scans, 2 clockwise and 2 counterclockwise. B, Plots of 9 BF projection intensity profiles for different gantry angles (θ = 110°, 130°, 150°, 170°, 190°, 210°, 230°, 250°, 270°) across the entire scan. C, Replots of the 9 BF projection intensity profiles in (B) with translational shift correction and amplitude correction using the amplitude variation data in a different scan. D, Replots of the 9 BF projection intensity profiles in (B) with translational shift correction and amplitude correction using the amplitude variation data in the same scan.
Correction for BCA
We compared the CBCT images before and after 2 different BCA correction strategies for the test phantom in the OBI clinical CBCT system. The axial cut of the reconstructed CBCT image before BCA correction is shown in Figure 4A. The BCA exhibited as a circular band of ∼7.5 cm in radius with the center at the isocenter, a dark crescent band at the left, and a bright crescent band at the right. This radius related to the particular geometric shape of the BF used in the OBI system. The BCA were apparently reduced after correction for both strategies, as shown in Figure 4B and C. However, residual BCA still existed for both approaches. It should be pointed out that strategy A uses a position variation model for correction. It only corrects the translational shift but not the amplitude variation for the BF profile. On the other hand, strategy B uses a set of in-air projections for correction. It corrects both the translational shift and the systematic part of the amplitude variation. However, due to the presence of severe BNA, the difference between strategies A and B was difficult to detect visually. We also noted that all of the 3 images showed a bright half circular band at the left edge of the images. This band was a part of the BNA due to poor normalization calibration of the system, and both BCA correction approaches seemed to not affect it.

Comparison of the cone beam computed tomography (CBCT) images in an axial cut before and after bowtie-filter crescent artifacts (BCA) corrections with 2 different strategies. A, Before BCA correction; (B) after BCA correction with strategy A; and (C) after BCA correction with strategy B.
Correction for BNA
Results in section B earlier showed that our clinical CBCT system had severe BNA due to poor calibration. This BNA could be largely reduced by the first-step BNA correction approach, a physical calibration according to the vendor manual, and the bright ring at the boundary of the norm phantom radius disappeared mostly. However, the negative effect on BCA still existed. The BNA could be further reduced by an analytical approach using a numerically calculated shift of Δopt. Figure 5 shows the SI (Δ) varying with shift Δ based on our acquired Norm (U, V, θ0) and Air (U, V, θ0) after careful alignment of the norm phantom. We noted that the SI was minimal when Δ = 1∼2 (pixel); thus, we determined that the norm phantom had a misalignment of Δopt = 1 (pixel), which was 0.388 mm in the detector plane and 0.26 mm at the isocenter plane. A shift of Δ = 1 pixel in the normalization calibration file would correct for the misalignment and further reduce the BNA. To test the effect of this misalignment in image artifacts, we compared the corresponding CBCT images of the test phantom with various Δ values. Strategy A in BCA correction was used in these images to reduce the interference of the BCA effect so that the misalignment effect could be more sensitively detected. As shown in Figure 6, when Δ ≤ −1, the image started to have a thin bright band at the left edge, an indication of the BNA as shown in Figure 4. In addition, it exhibited a bright crescent band at the left side and a dark crescent band at the right side of the 7.5 cm ring. These results suggest that the BNA could worsen the existing BCA. When the Δ was increased to Δ = 4, the left crescent band turned to dark and the right one turned to bright. Apparently, at the middle of them (when Δ = Δopt = 1), the artifacts was minimal, and we achieved the optimal BNA reduction.

Symmetrical index (SI) varying with shift Δ based on our acquired Norm (U, V, θ0) and Air (U, V, θ0) after careful alignment of the norm phantom. A, Shift = −2; (B) shift = −1; (C) shift = 0; (D) shift = 1; (E) shift = 2; (F) shift = 3; and (G) shift = 4.

Comparison of the cone beam computed tomography (CBCT) images in an axial cut for various shift Δ (Δ = −2, −1, 0, 1, 2, 3, 4). Strategy A in bowtie-filter crescent artifacts (BCA) correction was also used in these images to reduce the interference of the BCA effect. A1, 63.2; (A2) 48.9; (A3) 45.0; (B1) 37.7; (B2) 19.6; (B3) 19.4; (C1) 35.0; (C2) 19.4; and (C3) 18.8.
Step-By-Step Combined Procedure to Reduce BCA and BNA
Figure 7 shows the comparison of the combined effect of BCA and BNA corrections. The first, second, and third columns are images for the BCA correction methods of none, strategy A, and strategy B, respectively. The first, second, and third rows are images for the BNA correction methods of none, first-step of BNA correction (physical calibration), and final BNA correction with analytical approach, respectively. The physical calibration largely removed the bright (white) band of the BNA at the edge of the image, indicating the importance of the Quality Assurance of the CBCT system. Both BCA strategies effectively removed the majority of the BCA artifacts. To evaluate these correction approaches quantitatively, we sampled the HUs along a line in the middle of the axial image of the norm phantom presented as a red sampling line in Figure 7A1. The sampled HUs for A1, A3, B3, C1, C2, C3 were plotted in Figure 8 for visual comparison. The standard deviations of the sampled HUs to the real HU of norm phantom (−50) were 63.2, 48.9, 45.0, 37.7, 19.6, 19.4, 35.0, 19.4, and 18.8 HU for A1, A2, A3, B1, B2, B3, C1, C2, and C3, respectively. These results showed that the analytical approach slightly reduced the BNA from the physical calibration, and strategy B was slightly better than strategy A. It is understandable that strategy B is better than strategy A because it not only corrects the translational variation but also the amplitude variation.

Comparison of the cone beam computed tomography (CBCT) images in an axial cut for combined effect of bowtie-filter crescent artifacts (BCA) and Bowtie-Filter normalization artifact (BNA

Hounsfield unit (HU) varying with the position along a sampling line in the middle of the axial image of the norm phantom presented as a red sampling line in selected images. A, The HU profiles of A1, A3, C1, and C3. B, The HU profiles of B3, C2, and C3.
We have tested the step-by-step combined procedure containing Strategy B to reduce the BCA and BNA in a CatPhan and in a patient with real brain tumor. Figure 9 shows the comparison of CBCT images for the CatPhan and the patient without and with our combined correction with strategy B. The results showed that the correction procedure remarkably reduced the BNA and BCA and improved the image quality. However, it should be pointed out the simple physical calibration played the most important role in reducing the artifacts.

Comparison of the cone beam computed tomography (CBCT) images in an axial cut before and after our step-to-step combined procedure to reduce the Bowtie-Filter normalization artifacts (BNA) and bowtie-filter crescent artifacts (BCA) in a CatPhan and a patient. A, Catphan image before correction; (B) CatPhan image after correction; (C) patient head image before correction; and (D) patient head image after correction.
Discussion
We have studied the BF-related artifacts in the Varian OBI CBCT system. We first studied the BF position and profile variations and found that the BF position variation not only induces the translational shift of the BF profile but also the amplitude variation defined as the change in the maximum intensity with different gantry angles. We tested 2 previously proposed BCA reduction strategies in the system and found that both strategies effectively reduce the BCA, while strategy B is slightly better than strategy A, possibly because strategy B can partially correct the amplitude variation. We also found that imperfect alignment of the norm phantom in the BF calibration process induces a BNA, which not only exhibits as a half bright arc at the image edge but also has a negative effect on BCA. The physical calibration reduced the BNA largely, and the analytical approach further minimized it. We have finally developed a step-by-step combined procedure to reduce both the BCA and BNA and demonstrated in a CatPhan and a real patient that the artifacts can be largely reduced using the vendor reconstruction software in the clinical system. This is the first report on developing a procedure and software that can be directly used to reduce the BF-related artifacts in a clinical system.
It has been reported independently by Virginia Commonwealth University (VCU) and Duke University groups that the BCA is due to BF profile variation during gantry rotation. 15,16 The 2 groups proposed 2 different approaches to reduce the BCA. However, the cause of the BF profile variation has been controversial (for example, it was argued that the profile variation is due to BF motion or radiation source motion). Moreover, for both approaches, significant residual artifacts existed and it could be obvious with severe BNA in Figure 6, and the cause of the residual artifacts was not understood. We considered that the profile variation is the combined effect of position variations in the CBCT system, including the BF, radiation source, and detector. The variation is composed of a systematic component, which is mainly due to imbalance of the gravity of the system and can be corrected by the 2 approaches, and a random component, which is mainly due to mobile objects in the system and cannot be corrected. It is reasonable to speculate that the residual BCA is induced by residual BF profile variation, which is mainly due to random variation that cannot be corrected by a gantry angle-dependent model. Similar to the VCU group, we observed a large random component of translational variation in the V direction, which is mainly due to the wobbling of the BF. However, this random component seemed to have little effect on the BCA because the BF has no modulation in the V direction.
We found that the BF profile variation could also exhibit as an amplitude variation, and there was a random component in this amplitude variation, as shown in Figure 3. This random amplitude variation may correlate to the random translational variation in the V direction. Interestingly, we noted that strategy B, which partially corrects the amplitude variation, was slightly better in reducing the BCA than strategy A, which only corrects the translational variation. These suggest that the amplitude variation contributes to the BCA, and the residue random amplitude variation contributes at least part of the residue BCA. A change of the BF design to fix the mobility of the BF may reduce the random variation. One possible solution is adding a scaled bowtie mask based on the histogram of a tissue. 20 Another possible solution is that online position measurement, such as using a grid attached to the BF, may detect the random variation and correct it. It has been reported that such a grid in front of a patient can be used to reduce scatter and detect the remaining scatter and thus improve the CBCT image quality. 21
However, the random variation may be only a part of the cause for the residue BCA. Strategy B corrects at least 50% of the amplitude variation, but the improvement in the BCA over strategy A was not visually proportional. We noted a large amplitude variation due to imaging lags in Figure 3A. The impact of this variation was not understood. Further studies are needed to improve our understanding of the BF-related artifacts.
Conclusion
We have studied the BF-related artifacts in the Varian OBI CBCT system. We first studied the BF position and profile variations during gantry rotation and found that the BF exhibited not only a translational shift but also an amplitude variation in its projection profile. In addition to the BCA, we found that an imperfect alignment of the norm phantom in the BF calibration process induced a BNA, which may generate artifacts around the radius of norm phantom and worsen the BCA. We have developed an optimal step-by-step combined procedure to reduce both the BCA and BNA. The procedure was found to improve image quality in a CatPhan and a real patient.
Footnotes
Abbreviations
Declaration of Conflicting Interests
The author(s) declared no potential conflicts of interest with respect to the research, authorship, and/or publication of this article.
Funding
The author(s) disclosed receipt of the following financial support for the research, authorship, and/or publication of this article: This study is supported by Award Number 1R01CA166948 from the NIH and National Cancer Institute.