
Abstract
Purpose:
It is desirable that dosimetric deviations during radiation treatments are detected. Integrated transit planar dosimetry is commonly used to evaluate external beam treatments such as volumetric-modulated arc therapy. This work focuses on patient geometry changes which result in differences between the planned and the delivered radiation dose. Integrated transit planar dosimetry will average out some deviations. Novel time-resolved transit planar dosimetry compares the delivered dose of volumetric-modulated arc therapy to the planned dose at various time points. Four patient cases are shown where time-resolved transit planar dosimetry detects patient geometry changes during treatment.
Methods:
A control point to control point comparison between the planned dose and the treatment dose of volumetric-modulated arc therapy beams is calculated using the planning computed tomography and the kV cone-beam computed tomography of the day and evaluated with a time-resolved γ function. Results were computed for 4 patients treated with volumetric-modulated arc therapy, each showing an anatomical change: pleural effusion, rectal gas pockets, and tumor regression.
Results:
In all cases, the geometrical change was detected by time-resolved transit planar dosimetry, whereas integrated transit planar dosimetry showed minor or no indication of the dose discrepancy. Both tumor regression cases were detected earlier in the treatment with time-resolved planar dosimetry in comparison to integrated transit planar dosimetry. The pleural effusion and the gas pocket were detected exclusively with time-resolved transit planar dosimetry.
Conclusions:
Clinical cases were presented in this proof-of-principle study in which integrated transit planar dosimetry did not detect dosimetrically relevant deviations to the same extent time-resolved transit planar dosimetry was able to. Time-resolved transit planar dosimetry also provides results that can be presented as a function of arc delivery angle allowing easier interpretation compared to integrated transit planar dosimetry.
Introduction
Technological development in radiotherapy has allowed for increased complexity in the delivery of external beam radiotherapy (EBRT). With the introduction of volumetric-modulated arc therapy (VMAT), radiation dose can be delivered highly conformally, reducing the dose to the organs at risk (OARs). Volumetric-modulated arc therapy uses many degrees of freedom during dose optimization; gantry angle, field shape, and dose rate are continuously varied making quality assurance (QA) more difficult than for static irradiation techniques. The QA of VMAT is predominantly performed with specialized arc verification equipment, that is, ArcCHECK (Sun Nuclear Corporation, Melbourne, Florida), MatriXX (IBA, Schwarzenbruck, Germany), Octavius (PTW, Freiburg, Germany), and Delta-4 (ScandiDos, Uppsala, Sweden). 1,2 Alternatively to specialized equipment, the electronic portal imaging device (EPID) has been demonstrated to be an accurate tool for integrated planar dosimetry and, more recently, for time-resolved planar dosimetry (TRPD). 3 -7
It is desirable that dosimetrically relevant deviations to the planned dose are detected at the time of delivery. Performing pretreatment QA can reduce the occurrence of some deviations, such as those resulting from machine faults. Other deviations, resulting from changes in patient geometry, can only be identified on the day of treatment or during the treatment itself and are the focus of this work.
During the course of fractionated EBRT, changes in patient anatomy can frequently and rapidly occur, for example, tumor regression, weight loss, atelectasis and pleural effusion in lungs, and variation in bowel or bladder filling, all potentially displacing the tumor/normal tissues or changing local tissue densities. 8 -10 These changes may result in differences between the planned and the actually delivered radiation dose and may require corrective actions. Currently, to detect these dose delivery changes in VMAT, 2-dimensional (2D) integrated or 3-dimensional (3D) integrated EPID dosimetry are used in some centers. 11 -14
For integrated transit planar dosimetry (ITPD), the ability to analyze the cause of a dose difference is limited, requiring much time and experience, and does not correlate well with changes in the dose–volume histogram (DVH). 15,16 Due to the integral nature of these methods, there are also some deviations that will average out based on the arc trajectory alone, resulting in minor or no indication of deviation.
The aim of this proof-of-principle study was to demonstrate that time-resolved transit planar dosimetry (TRTPD) as a method for analyzing dosimetry data for VMAT at various time points does not have the same geometrical shortcomings of integrated methods and offers added value in detecting dose delivery deviations caused by patient anatomical changes.
Materials and Methods
Equipment and Time-Resolved Transit Planar Dose Acquisition
Patient images were acquired on TrueBeam linear accelerators (Varian Medical Systems, Palo Alto, California) with an on-board kV cone-beam computed tomography (CBCT) device. All TRTPD dose images were calculated with an in-house developed algorithm which accurately converts transit planar images into transit planar dose distributions. 17 Briefly, this model takes the treatment planning system-generated plan file and, using the control point (CP) discretized fields within the plan, generates multiple 2D pretreatment dose to water distributions at the level of the EPID, one for each segment (duration between CPs). The pretreatment doses are converted into pretreatment fluences and geometrically translated from the level of the EPID to a plane just at the exit of the linac head. Separately, for each segment geometry, a CT is used to extract a radiological path length and mass center at each ray line connecting the EPID with the source. This allows each segment geometry of the CT to be described in terms of the equivalent cm of water, equivalent homogeneous phantom (EHP). The transit dose distributions per segment can then be generated by calculating both the primary dose contribution via attenuation of the 2D segment fluences through the EHP and scatter dose contribution via fitted water scatter kernels. Integrating all segments of these TRTPD distributions produces ITPD distributions. Using the TRTPD distributions and CBCT patient geometry, we can obtain TRTPD distributions of treatments using the geometry of the day. Figure 5 gives an overview of the procedure, which also includes a γ evaluation against a TRTPD dose image based on the planning CT. For the comparison, we have used a time-resolved γ evaluation which includes the global dose difference (DD) and distance-to-agreement (DTA) criteria of (3%, 3 mm). 18 -20 From each CP, a γ fail rate was obtained by calculating the percentage of pixels, where γ exceeded unity within the CP’s field shape. This is represented as a polar plot (Figure 1) as a function of gantry angle. The γ function was extended to quantify failure of the dose/DTA criterion |γ| > 1 with negative or positive DD expressed as a blue/red color in the figures using the sign of the DD obtained in the γ calculation. It should be noted that the color is only an indication of the sign of the DD, and it is not necessarily an indication of a failure of the DD criterion. |γ| > 1 may also occur when only the DTA criterion fails. For the ITPD, the doses in all CPs over time were summed and compared with a static γ evaluation with global criteria of (3%, 3 mm). In this work, DVHs of the 3D planned dose were compared against a 3D reconstructed dose based on the kV CBCT, where the latter has been redelineated by experienced physicians. 21

A, The calculated CP-by-CP transit planar dose images during treatment are compared to the CP-by-CP transit dose predictions based on the planning computed tomography (CT). A time-resolved γ function is used for the evaluation. From the CP γ result, different metrics can be extracted, for example, the percentage pixels >+1 or <−1, which is shown as the polar plot in the back of the figure by red or blue indications, respectively. The magnitude of the failure is expressed by the radius (the numbers along the dotted lines), whereas angle represents the gantry angle. B, The method for calculation of the time-resolved transit planar dose. The method uses as calculation geometry the CT or cone beam CT (CBCT), a 2-dimensional (2D) time-resolved planar pretreatment dose, and the beam parameters from the treatment plan itself. With an adapted algorithm of van Elmpt et al, 17 * a 2D transit planar dose is acquired. The 2D time-resolved pretreatment dose uses the algorithm of Podesta et al. 3 *
Patient Characteristics
Four patients were studied. Patient A had a cT4N3M0 small-cell lung cancer (SCLC) of the right upper lobe and developed pleural effusion during the course of radical chemoradiotherapy (30 × 1.5 Gy twice daily). Patient B was referred for palliative treatment for a metastasized bladder cancer and had rectal gas pockets in proximity of the planning target volume during the planning CT, which were absent during treatment. Patient C underwent chemoradiotherapy (35 × 2 Gy) for a cT4aN2cM0 squamous cell carcinoma of the oral cavity and lost weight and had regression of the primary tumor and cervical lymph node metastases. Patient D underwent chemoradiotherapy (23 × 2.75 Gy) for a cT3N2M0 non-small-cell lung cancer (NSCLC) of the right lower lobe and showed tumor regression during the treatment course. Patients A, B, and D were treated with 2 half-arcs of 10 MV photons, whereas patient C was treated with complex 4 half-arcs of 6 MV photons.
Results
For the first 3 patients, data are shown based on a single fraction while the change was consistent for the remainder of the treatment. However, for the last patient the dose difference gradually increased throughout the treatment.
Patient A (Figure 2) is a SCLC patient who developed pleural effusion during the first few fractions of irradiation, thus displacing the primary tumor and changing the delivered dose distribution. Integrated transit planar dosimetry indicated no failure in the γ analysis. However, the geometry change led to a reduced coverage of the clinical target volume of ∼3% as can be seen in the DVH. Time-resolved transit planar dosimetry detected this geometric change, as shown in the third row. The γ fail rate per gantry angle highlights that in particular the angles passing directly through the effusion show the highest fail rates, angles from 310

Case A: With in the top row, a computed tomography (CT) slice and a cone-beam CT (CBCT) slice with the lungs (dark blue) and clinical target volumes (CTVs; light blue) delineated as well as the pleural effusion (red, in CBCT fraction 4). The second row shows the integrated transit planar dosimetry (ITPD) γ evaluation for the 2 arcs of the plan, and the third row shows the time (angle)-resolved γ fail rate per control point [CP; P(γ > 1) red radius, P(γ < −1) blue radius]. The last row shows the dose–volume histogram (DVH) for the CTV.
The patient with metastasized bladder cancer, patient B, showed a hotspot in the rectum during treatment (see DVH in Figure 3). This was due to gas pockets present during the planning CT scan, but absent later. This error did not clearly show up in the ITPD. Only 0.8% of pixels failed the detection criteria. Time-resolved transit planar dosimetry showed that under many angles (from 160
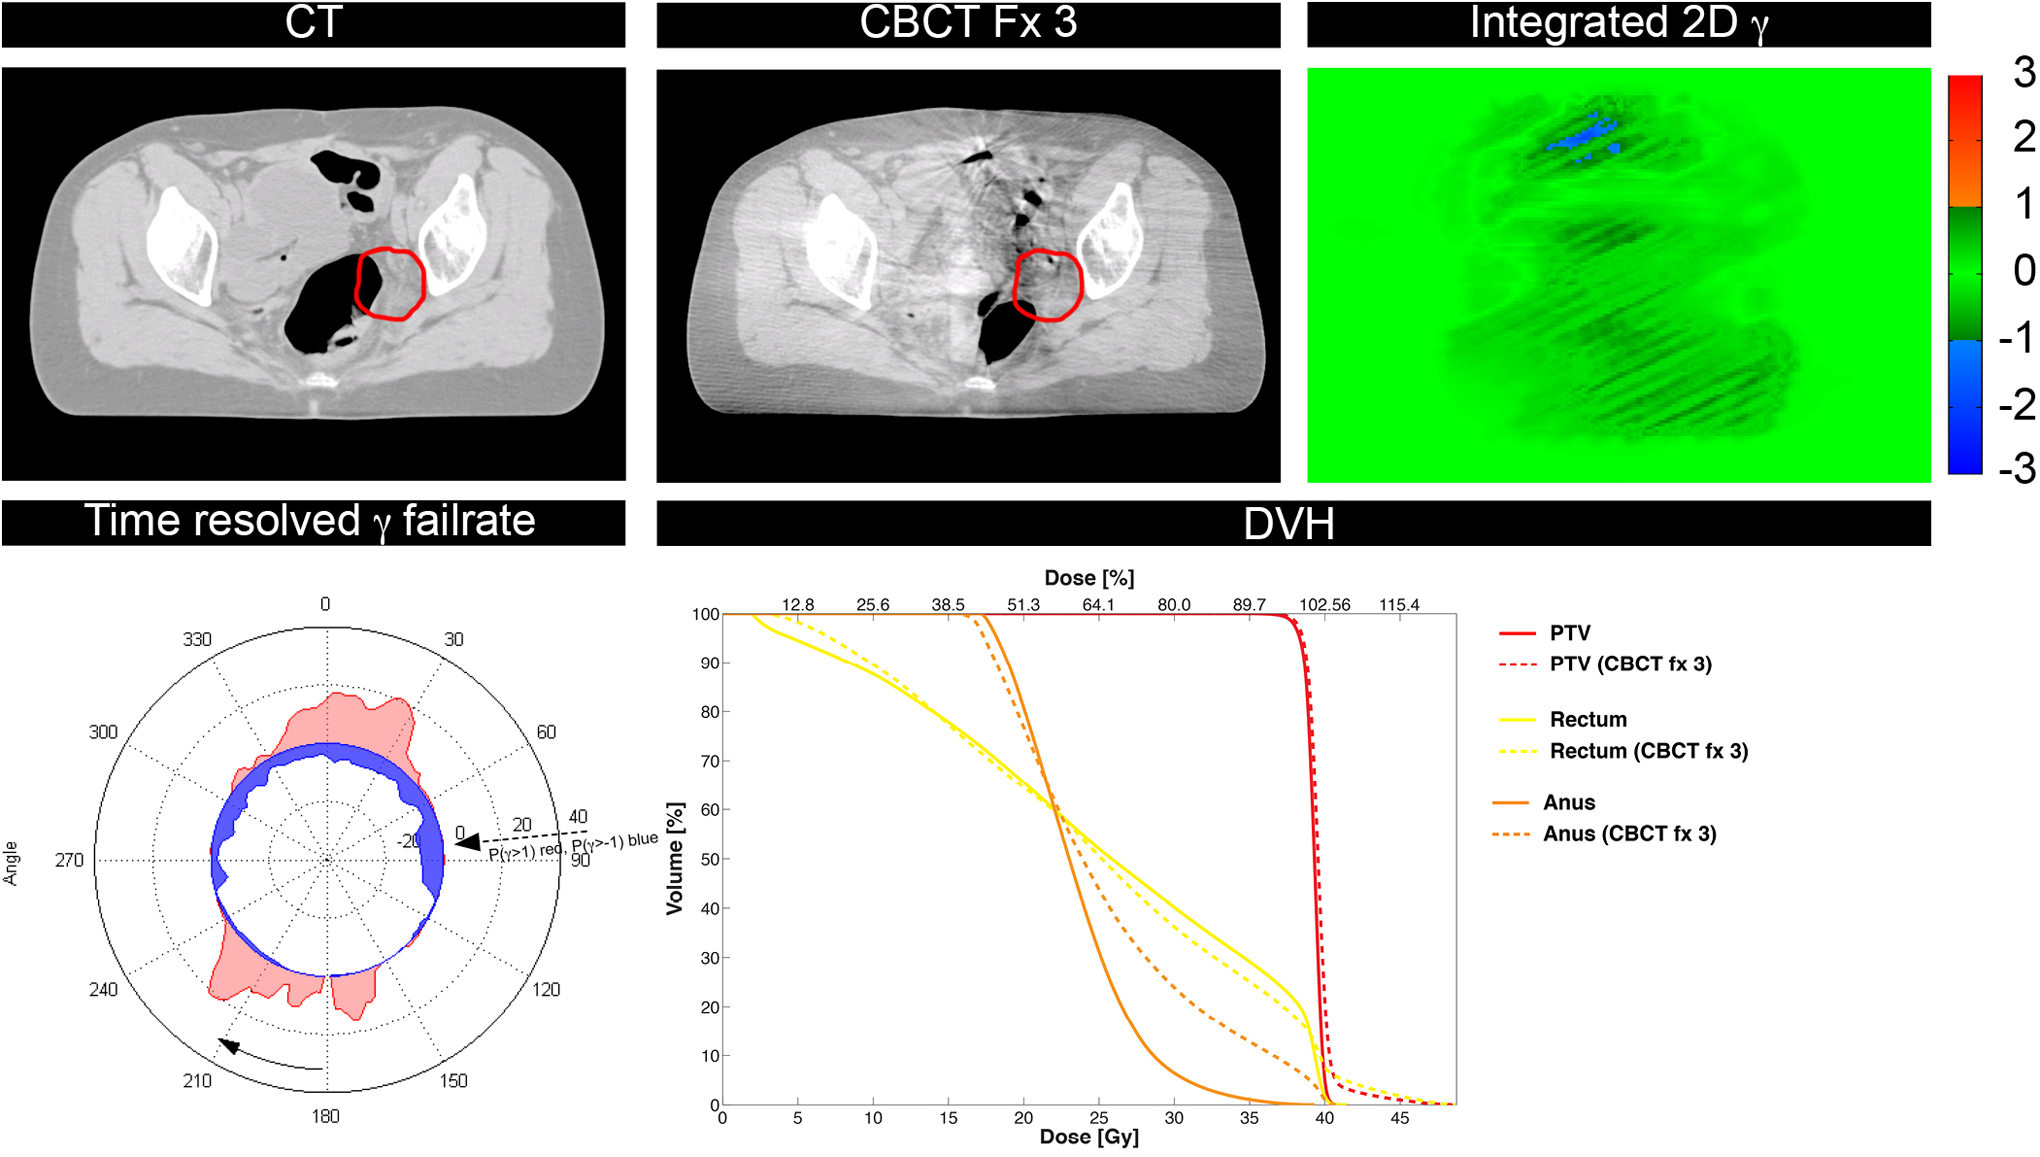
Case B: In the computed tomography (CT) slice and the cone-beam CT (CBCT) slice, the planning target volume (PTV; red) has been indicated, whereas next to these slices, the integrated transit planar dosimetry (ITPD) γ is shown. The second row shows the time (angle)-resolved γ fail rate per control point [CP; P(γ > 1) red radius, P(γ < −1) blue radius] and the dose–volume histogram (DVH) of the planned and delivered dose.
Patient C (Figure 4) had a squamous cell carcinoma of the oral cavity and was treated with a complex 4-arc VMAT plan with high modulation of the treatment fields. During chemoradiotherapy, the patient lost weight and both the primary tumor and the lymph node metastases went into regression, leading to an overdosage of Dmean of the primary tumor of ∼4%, as can be seen in the DVH (Figure 4). However, this geometrical change was not caught by ITPD, the fraction of γ pixels exceeding unity was 4.5% in the arc, whereas the polar plot of the TRTPD clearly showed a consistent failure for large arc sections.

Case C: In the top row, a computed tomography (CT) slice and a cone-beam CT (CBCT) slice are shown with planning target volume (PTV; red line) delineated. Next to the CT and CBCT slice, the ITPD γ image is shown for one the arcs. On the second row, the time-resolved γ fail rate per control point [CP; P(γ > 1) red radius, P(γ < −1) blue radius] polar plot is shown, with next to it the dose–volume histogram (DVH).
Finally, patient D is a NSCLC patient with tumor regression from fraction 5 onward compared to the kV CBCT of fraction 2 (Figure 5). With TRTPD, this error was caught between fractions 5 and 10, whereas the ITPD would have detected it only between fractions 10 and 15 (γ pixels exceeding unity at fraction 5: 0.2%, at fraction 10: 3.5%, and at fraction 15: 15.9%, respectively, compared to the dose calculated on the kV CBCT of fraction 2). The tumor had shrunk by more than 7 mm between fractions 5 and 10. The DVHs (Figure 6) indicate an increasingly inhomogeneous dose distribution and slightly increased dose to the tumor.
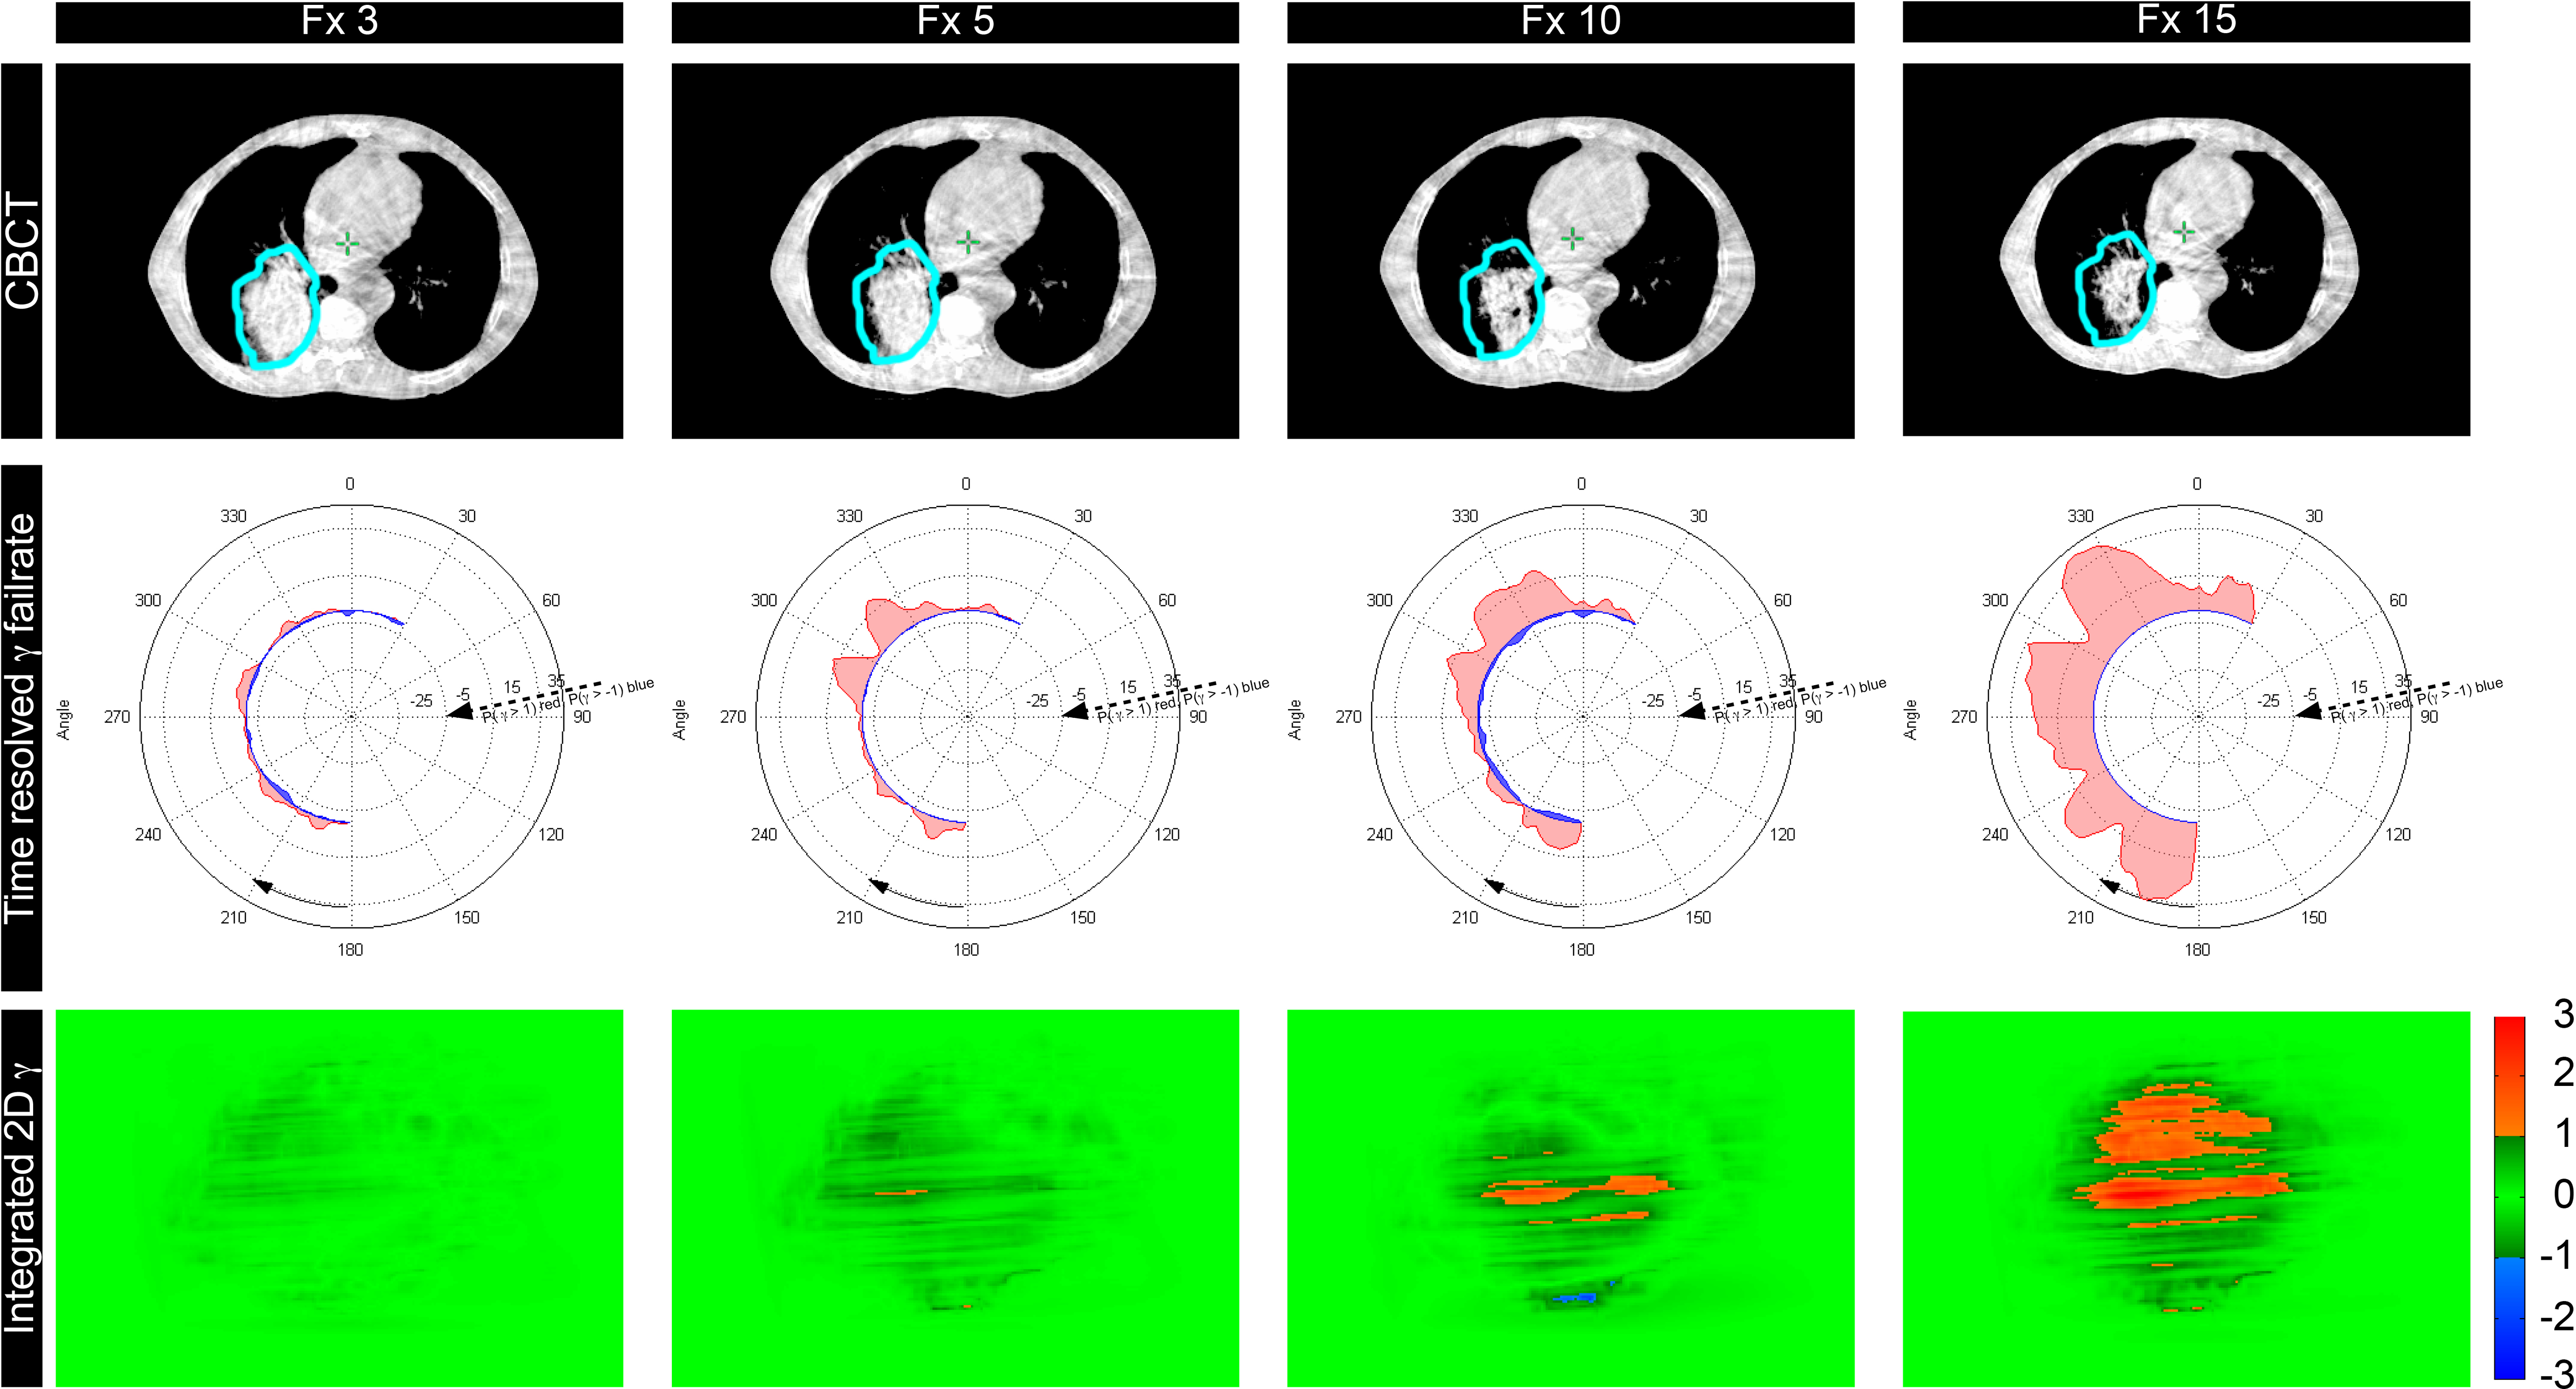
Case D: The top row shows cone-beam computed tomography (CBCT) slices for different fractions with the originally delineated CTV (light blue) delineated. The second row shows the time-resolved γ fail rate per CP [P(γ > 1) red radius, P(γ < −1) blue radius], and the third row shows the integrated transit planar dosimetry (ITPD) γ images.

The dose–volume histograms (DVHs) of case D. The solid line is the reference DVH of the clinical target volume (CTV) based on the dose calculated on the kV cone-beam computed tomography (CBCT) of fraction 2. The other dashed lines show CTV DVH from fraction 3 to 15. The right panel shows the shrinkage of the gross tumor volume (GTV).
Discussion
Advantages of TRTPD
The purpose of this proof-of-principle study was to show the potential advantages of TRTPD in comparison with ITPD. These are: 1) dose differences can be identified more accurately, with a possibly higher sensitivity, and earlier during a treatment, although more research is necessary and large patient populations need to be investigated for each category of change to determine the sensitivity and specificity; 2) the interpretation of dose discrepancies per arc angle is easier in comparison to ITPD where no angular information is present; and 3) the angular dose differences information can be used for treatment adaptation. Interpreting the polar plot information is important to validate the cause of the dose discrepancy, together with a visual inspection of the kV CBCT and delineated structures.
Although time-integrated 3D portal dosimetry might be directly comparable to the planned dose, accurate comparison and evaluation is more time consuming and maybe not necessary for all patients. Planar dose methods might be a faster method to detect cases to be subject to further investigation. For lung cancer, geometric changes are apparent in about 23% of the patients, while a smaller amount of patients are benefitting of adaptive radiotherapy strategies. Integrated transit planar dosimetry and TRPD are fast planar dosimetry methods able to detect dose differences. However, it has been shown that ITPD has little to no predictive power. 15,16,22 We have shown that relevant dose differences can be hidden by ITPD. 22 Integrated transit planar dosimetry might show little to no failure, whereas with time-integrated 3D portal dosimetry, relevant dose differences are detected. Time-resolved planar dosimetry shows to be a promising method in detecting those cases.
Another advantage of TRTPD is that gated or tracked treatment plans can be verified. With gating or tracking, beam-on times or MLC positions are selected based on the path of the tumor during a breathing cycle. Timing is critical in these treatments for triggering the beam-on or to change the MLC motion following the path of the tumor. Time-resolved transit planar dosimetry offers a tool to verify these types of treatments from time point to time point. It has been shown that time-resolved dosimetry offers added value in assessing dynamic treatments. 23
Comparing TRTPD to Integrated Dosimetry
Besides 2D transit dose verifications, 3D integrated dose reconstructions based on EPID dosimetry have also been reported in the literature. 11,12,21 This method has the advantage that it is immediately comparable to the planned dose via γ metrics and DVHs. Practical issues arise, however, when using the geometry of the day, due to the fact that redelineations are required to accurately recalculate the DVHs or γ metrics. Furthermore, with kV CBCT, images are difficult to redelineate in comparison with a planning CT image due to the difference in image quality and the presence of artefacts. Although efforts have been made to propagate contours with either deformable registration or atlas-based segmentation, redelineation during daily clinical practice is time consuming and impractical for large numbers of patients. 24,25 Aside from the workload issues, Zhen et al 26 showed that integrated 3D γ metrics show little to weak correlation with changes in DVHs, whereas Rozendaal et al 27 have found a correlation between 3D γ metrics (γmean) and relevant changes in the DVH. Time-resolved transit planar dosimetry may identify patients where in-depth analysis and redelineation are necessary, and therefore, it may reduce the workload necessary for 3D integrated dosimetry. Time-resolved transit planar dosimetry dose calculation is much faster than 3D integrated dosimetry, allowing for fast online dose verification.
It has been reported for intensity-modulated radiation therapy (IMRT) that ITPD can hide clinically relevant dose changes, partially due to the gradients in the integrated treatment fields. 15,16 The AAPM Task Group (TG-119) defined action levels for IMRT commissioning for integrated planar dosimetry and determined the confidence limits. 28 They suggest using γ criteria of (3%, 3 mm) for DD and DTA and at least a 90% in-field pass rate. A recent report on γ analysis concluded that the DD and DTA are not independent but linked to the mean gradient. 29 They showed that by accepting a minimum γ pass rate in IMRT or VMAT fields, the actual detection limit of a γ analysis depends on the gradient in the dose. Our results confirm that ITPD for VMAT treatments can hide relevant dose differences.
Our study did not use measured but only calculated EPID dose images. There are more EPID dosimetry techniques each with an uncertainty, and it is unclear how this propagates into the results. To reduce the uncertainty and focus on geometry changes, we have used EPID predictions. However, for clinical implementation of time-resolved dosimetry, a γ analysis taking into account only the spatial and dose information may be too restrictive to cover all uncertainties. A time-resolved γ analysis with an additional criterion, the time to agreement, may be necessary, as was recently shown by our group. 18 These are technical challenges which need to be solved to more accurately measure and evaluate the dose.
Plan Optimization and Adaptation
The decision to change a treatment plan is normally taken by the treating physician based on multiple criteria such as patient positioning, visually apparent anatomical changes, differences in the DVH, and so on. The information supplied by TRTPD could be used to create a more robust adapted treatment plan by inserting avoidance sectors for gantry angles where frequently dose discrepancies occur. This may possibly lead to less treatment plan adaptations.
Site-Specific Evaluation
Although the cases presented show that TRTPD can detect certain dose differences, all types of geometry change should be evaluated. Especially in the lung, many geometry changes occur due to pleural effusion, atelectasis, or tumor volume change, influencing the dose delivery and requiring treatment adaptation (patient A). 10
In the bowel area, gas pockets are a frequently occurring source of geometry change. Although this is normally a randomly occurring event and should not influence fractionated treatment drastically, a consistent change in bowel filling can affect the dose to the target volume or OAR (patient B). Dose differences in the rectum may cause side effects such as rectal bleeding. For patient B, the gas pocket present at CT planning resulted in an increased Dmax in the rectum.
In the head and neck region, tissue shrinkage is frequently observed. For patient C, the shrinkage immediately influenced the dose to the target area, and many OARs were affected in this area.
Finally, for tumor regression (patient D), this is more complex as was shown in a recent report on the correlation between more tumor regression and decreased locoregional control in a subset of patients. 30 It may be tempting to adapt the treatment plan to the smaller tumor volume, but at present, there are no data suggesting the absence of microscopic disease in the decreasing volume. Additional studies are necessary to decide on optimal treatment adaptation to improve outcome for patients with NSCLC having shrinking tumors.
Further investigation is needed to correlate TRTPD observed differences with relevant geometry changes and to interpret the polar plot information when applied in daily clinical practice. Furthermore, the total uncertainty of the TRTPD method needs to be investigated to define optimal evaluation criteria and gain insight in the detection limits of transit planar dosimetry.
Conclusion
Four different clinical scenarios were presented where ITPD did not detect deviations in the dose delivery, whereas TRTPD was able to detect the patient geometry changes. Time-resolved transit planar dosimetry can be explored to increase the robustness of treatments with respect to geometry changes. Time-resolved transit planar dosimetry can play an essential role in the treatment monitoring of gated or tracked treatment modalities due to its time-resolved measurement of the dose delivery.
Footnotes
Acknowledgments
The authors would like to thank Dr Wouter van Elmpt, Ben Vanneste, Dr Frank Hoebers from MAASTRO CLINIC, Prof. Dr. Dirk de Ruysscher from the Katholieke Universiteit Leuven, Stefan Scheib, PhD, and Christof Baltes, PhD, from Varian Medical Systems for their expertise and advice.
Authors’ Note
L. Persoon and M. Podesta contributed equally to this work.
Declaration of Conflicting Interests
The author(s) declared no potential conflicts of interest with respect to the research, authorship, and/or publication of this article.
Funding
The author(s) disclosed receipt of the following financial support for the research, authorship, and/or publication of this article: This project was partially funded by Varian Medical Systems (project: TimePort-II).