
Abstract
This study investigated the biological effects of microRNA-126 overexpression in human MG63 osteosarcoma cells. A recombinant plasmid expressing microRNA-126, pcDNA6.2-microRNA-126, was constructed and transfected into MG63 cells. Using real-time fluorogenic quantitative polymerase chain reaction, the microRNA-126 expression was measured in microRNA-126-MG63 group, Ctrl-MG63 group, and blank group. Cell proliferation, cell cycle distribution, cell migration, and invasion were analyzed using methyl thiazolyl tetrazolium assay, flow cytometer, wound-healing assay, and transwell assay, respectively. As expected, microRNA-126 expression was higher in microRNA-126-MG63 group than in Ctrl-MG63 group and blank group (both P < .05). After 48/72 hours of transfection, cell proliferation in microRNA-126-MG63 group was significantly reduced compared to blank group (both P < .05). Compared to blank group, cell population in G0/G1 stage was significantly higher in microRNA-126-MG63 group, accompanied by lower cell numbers in the S and G2/M phases and decreased proliferation index (all P < .05). Wound-healing assay showed a wider scratch width in microRNA-126-MG63 group and reduced cell migration than blank group (both P < .05). Cells overexpressing microRNA-126 exhibited reduced ADAM9 expression levels compared to other 2 groups (all P < .05), suggesting ADAM9 is a target of microRNA-126. Cell proliferation, migration, and invasion rates were reduced in microRNA-126 group after 48/72 hours of transfection, compared with blank group (all P < .05). Cotransfection of pcDNA6.2-microRNA-126 and pMIR-ADAM9 into MG63 cells led to higher cell proliferation, invasion, and migration rates, compared with transfection of pcDNA6.2-microRNA-126 alone (all P < .05). In summary, our data show that microRNA-126 inhibits cell proliferation, migration, and invasion in human osteosarcoma cells by targeting ADAM9.
Introduction
Osteosarcoma (OS) is an aggressive malignant tumor involving primitive transformed cells of the mesenchymal origin and commonly arises in the bones around knee. 1,2 Osteosarcoma accounts for around 20% of bone cancers, and its incidence rate is approximately 4.6% to 5.6% for approximately 0–19 years age range per year per million persons worldwide. 3 The signs and symptoms of OS are nonspecific, which often delays the accurate diagnosis of the underlying disease, resulting in poor prognosis and the high metastatic capacity of OS. 4 Osteosarcoma is a very aggressive cancer, and metastasis occurs even when the tumors are very small, requiring whole body treatment for OS, as opposed to localized treatment. 5 The precise etiology of OS remains poorly understood, but previous studies have identified a few fundamental mechanisms regulating OS development and progression. 6 Although 5-year overall survival has improved for childhood cancers from 58% to 82% in the past 3 decades, the overall survival for pediatric OS remains static over the same time period at 60%. 7 Similarly, the therapeutic efficacy of chemotherapy and radiation therapy for OS treatment also remains stagnant. 1 Therefore, useful biomarkers for early diagnosis and clinical monitoring of treatment response are in urgent need to improve the outcomes. 4
MicroRNAs (miRNAs) play critical roles in a wide variety of cellular processes, including cell proliferation, differentiation, and apoptosis. 4,8 Dysregulation of miRNA expression occurs commonly in diverse cancers such as breast cancer, lung cancer, cervical cancer, and colorectal cancer, and is directly linked to tumor initiation and progression. 9 -12 Consistent with this, a previous study detected altered expression of multiple miRNAs in human OS cell lines and in tissue samples derived from patients with OS. 13 MicroRNA-126 is encoded by the intron 7 of egfl7 and regulates vascular functions and vascular integrity. 14 Previous studies reported that miRNA-126 is highly expressed in vascular tissues such as heart, liver, and lung, and reduced miRNA-126 expression is associated with tumor proliferation, invasion, and cancer progression. 14,15 Consistent with this, miRNA-126 is downregulated in nonsmall cell lung cancer and restoration of high miRNA-126 expression reduces tumor angiogenesis and suppresses tumor growth in lung cancers. 16 Although the influence of miRNA-126 has been reported by previous studies in several other types of cancers, the effects of miRNA-126 in development of OS remain largely unexplored, with its involvement suspected in few pathways, such as Sirt-1 and Sox-2, whose expression is likely regulated by miRNA-126 in OS. 4,17 In search of additional influential pathways, exogenous miRNA-126 was overexpressed in a human OS cell line known for its low endogenous expression levels of miRNA-126. Using this cell line model, the effects of miRNA-126 overexpression on cell proliferation, migration, and invasion were examined to identify cellular pathways regulated by miRNA-126.
Materials and Methods
Osteosarcoma MG63 Cell Transfection and Grouping
MG63 cell lines were obtained from the Laboratory of Department of Pediatric Orthopedics and Bone Oncology, Linyi People’s Hospital Affiliated to Shandong University, China. Cells were cultured in RPMI 1640 medium (HyClone, Logan, Utah) supplemented with 10% fetal bovine serum, 100 U/mL penicillin, 100 μg/mL streptomycin, and 2 mmol/L glutamine. Cell cultures were maintained at 37°C in 5% carbon dioxide (CO2). Cells were generally harvested at 80% to 90% confluency and seeded into a 24-well plate at 3 × 10⁴ cell/mL concentration. The experimental set up consisted of 3 groups: (1) blank group; (2) Ctrl-MG63 group, and (3) miRNA-126-MG63 group. Cells were serum starved for 12 hours before transfection. For transfection in miRNA-126-MG63 group, Lipofectamine 2000 (Invitrogen, Carlsbad) was mixed with recombinant pcDNA6.2-miRNA-126 plasmid and Opti-MEM solution (Solarbio Inc., Beijing, China). For transfection in Ctrl-MG63 group, Lipofectamine 2000, pcDNA6.2-GW/EmGFP-miR empty plasmid (provided by Surgery Research Center in the Second Hospital of Hebei Medical University), and Opti-MEM were mixed. Finally, for transfection in blank group, the same amount of Lipofectamine and Opti-MEM was used, without the addition of any plasmid DNA. Cells grown in logarithmic phase were transfected as described above following manufacturer’s instructions. After 48 hours of transfection, the plasmid encoded GFP marker expression was detected using an Olympus IX-71 inverted fluorescence microscope (Japan). The GFP-positive cells were quantified by flow cytometry and further expanded under standard cell culture conditions. Real-time fluorogenic quantitative polymerase chain reaction (RFQ-PCR) was employed to measure miRNA-126 expression levels in all related experiments.
Design and Synthesis of miRNA-126 Small Interfering RNA
A Basic Local Alignment Search Tool search was applied to identify the mature sequences of has-miRNA-126 in miRBase to synthesize specific interference fragments. Primers for RFQ-PCR were: sense miRNA-126: 5′-TGCTGCATTATTACTTTTGGTACGCGCTGTGACACTTCAAACCTCGTACCGTGAGTAATAATG-3′; anti-sense miRNA-126: 5′-CCTGCGCATTATTACTCACGGTACGAGTTTGAAGTGTCACAGCGCGTACCAAAAGTAATAATCC-3′. All oligonucleotides were synthesized by Shanghai Biological Engineering Co., Ltd (China). Sense and antisense oligonucleotides were annealed to generate duplex miRNA-126 DNA. The miRNA-126 duplex was ligated to linearized pcDNA6.2-GW/EmGFP-miR plasmid. The ligated products were transformed into competent bacteria, and 6 bacterial colonies were selected for plasmid isolation and subsequent diagnostic double digestion with BamH I and Xho I (TaKaRa company, Japan). The confirmed recombinant plasmid containing the miRNA-126 sequence was named as pcDNA6.2-GW/EmGFP-miRNA-126 (or pcDNA6.2-miRNA-126; Figure 1). Sequence conformation was performed by Shanghai Biological Engineering Co., Ltd, and Chromas software was used for sequence comparison.

pcDNA6.2-microRNA-126 plasmid map (The sequence of mature has-microRNA-126 was identified in miRBase using Basic Local Alignment Search Tool (BLAST) to synthesize the miRNA-126 sequence-specific interference. Sense and antisense oligonucleotides were annealed to generate duplex microRNA-126 DNA. The microRNA-126 duplex was ligated to linearized pcDNA6.2-GW/EmGFP-miR plasmid. The ligated products were transformed into competent bacteria. Six bacterial colonies were selected for plasmid isolation and double digested with BamH I and Xho I. The recombinant plasmid was named pcDNA6.2-GW/EmGFP-microRNA-126 (pcDNA6.2-microRNA-126)).
Real-Time Fluorogenic PCR on miRNA-126 Expression on MG63 Cells Transfected With pcDNA6.2-miRNA-126
Total RNA was extracted from cultured cells 48 hours after transfection using MirVanaTM miRNA isolation kit (ABI, Ambion, Austin, TX, USA) and reverse transcribed into complementary DNA (cDNA). The reverse transcription reaction conditions for miRNA-126 were 16°C for 30 minutes, 42°C for 30 minutes, and 85°C for 30 minutes. As a control, glyceraldehyde phosphate dehydrogenase (GAPDH) was reverse transcribed at 42°C for 1 hour, followed by 70°C for 10 minutes, and the resulting product was stored at 4°C until further use. An SYBR Green real-time PCR assay was used to measure the miRNA-126 and GAPDH expression. Specific primers were miRNA-126: forward, 5′-ACACTCCAGCTGGGT CGTACCGTGAGTAAT-3′; reverse, 5′-TGGTGTCGTGGA GGAGTC-3′; GAPDH: forward, 5′-GAAGGTCGGAGTCAA CGGATT-3′; reverse, 5′-ATGGGTGGAATCATATTGGAA-3′. The miRNA-126 reaction conditions were 95°C for 5 minutes, 95°C for 15 seconds, and 60°C for 15 seconds, total 40 cycles. The GAPDH reaction conditions were 95°C for 10 minutes, 95°C for 15 seconds, and 60°C for 1 minutes, total 50 cycles. Fluorescence signals were recorded at 84°C. Dissolution curves were plotted after completion of RFQ-PCR. The expression levels of miRNA-126 were quantified using 2−▵▵Ct method, with GAPDH as internal parameter.
Proliferation of MG63 by Methyl Thiazolylte-Trazolium After pcDNA6.2-miRNA-126 Transfection
The MG63 cells in exponential growth phase were detached using 0.25% trypsin solution. Cell density was adjusted to 2 × 10⁵ cell/mL for single cell suspension. A volume of 500 μL single cell suspension was seeded into 24-well plates and after cells reached 80%confluency, and transfections were performed as described before. All transfections were carried out in triplicates. After 24 hours of transfection, cells were trypsinized and resuspended in 1 mL medium, diluted 5 times, and seeded into 96 well-plates (6 identical replicates in each group). The cells were incubated with 10 μL methyl thiazolylte-trazolium (MTT, 5 mg/mL; Sigma, St Louis, Missouri) per well after growth for 24, 48, and 72 hours at 37°C in 5% CO2 incubator. After incubation with MTT for 4 hours, an inverted microscope was used to observe formazan crystallization. The culture medium was aspirated, and the crystals were dissolved using 100 μL dimethyl sulfoxide (Sigma) per well. The optical density was measured using an enzyme-linked immunosorbent assay plate reader at 570 nm wavelength (reference wavelength 630 nm).
Detection of Cell Cycle Time by a Flow Cytometer
Single cell suspension of MG63 cells (2 mL) was transferred into a 96-well plate and cultured for 72 hours. Subsequently, cells were detached, centrifuged at 2000 rpm for 5 minutes at 4°C, and resuspended in 300 μL of phosphate-buffered saline (PBS). Next, 700 μL of precooled absolute ethyl alcohol (final concentration 70%) was added dropwise, and cells were placed at 4°C overnight and centrifuged at 800 rpm for 10 minutes. After removing the supernatant, the cells were rinsed twice with PBS, resuspended in 500 μL PBS containing 100 U/mL RNaseA with subsequent incubation for 30 minutes in 37°C in the dark. Next, 2 mg/mL propidium iodine was added to the cells at a final concentration of 50 μg/mL and incubated for 30 minutes in the dark. Cell cycle was analyzed using FACScan flow cytometer (Becton Dickinson, Franklin Lakes, New Jersey). Data analysis was conducted with ModFitLT3.3 software. Proliferation index (PI) was analyzed with fluorescence as horizontal ordinate and cell number as vertical coordinate. The cell cycle distribution results, comparing cell numbers at each stage, were obtained using the formula:
Detection on Migration of MG63 Transfected With pcDNA6.2-miRNA-126 by Scratching Assay
Single cell suspension of MG63 cells (2 mL) was transferred to 6-well plates. After transfecting cells for 16 hours, fresh complete medium was replaced and cells were cultured for an additional 12 hours. A 200 μL sterile micropipette tip was used to make a scratch, the cells were washed in PBS twice to remove dislodged cells and serum-free medium was added. A IX70 inverted fluorescence microscope was used to photograph (×100) 5 randomly selected fields within the wound zone to measure the wound width at 0 and 48 hours as a measure of “wound healing.”
Cell Migration and Invasion of MG63 Transfected With pcDNA6.2-miRNA-126 by Transwell Assay
Cell invasion was measured using transwell assay. After trypsinization and seeding in serum-free medium, the cells were plated on matrigel-coated transwell chambers precoated with 100 µL medium containing 10% fetal bovine serum (FBS). Fetal bovine serum (10%) in the lower chamber served as a chemoattractant. Then, the 24-well plate was incubated at 37°C in 5% CO2. After 24-hour transfection, the noninvaded cells were removed with a cotton swab. The migrated cells were fixed in 95% ethanol for 20 minutes and washed with PBS 3× 5 minutes. Subsequently, cells were stained with crystal violet for 5 minutes, followed by PBS wash for 3× 5 minutes. An invented microscope was used to count the migrated cells. The cell invasion results were presented with mean ± standard deviation (SD). The same procedure was essentially followed to measure transwell cell migration toward a chemoattractant by replacing matrigel-coated transwell chambers with uncoated transwell chambers.
The Construction of ADAM9 Vector and Luciferase Assay
The 3′-untranslated region (UTR) of ADAM9 was amplified using cDNA as template. The PCR products were purified by agarose gel extraction and subcloned downstream of the luciferase coding sequence in the pMIRGLO vector, resulting in pMIR-ADAM9 recombinant plasmid. Site-directed mutagenesis was performed to alter 4 bases in pMIR-ADAM9. This mutant plasmid was named pMIR-ADAM9-Mut. A DNA sequence analysis confirmed the identities of pMIR-ADAM9 and pMIR-ADAM9-Mut. The HEK293 cells were cultured in a 10 cm culture dish until cells reached 80% confluency. After PBS wash twice, cells were detached using 1 mL 0.25% trypsin solution and resuspended in 5 mL Dulbecco modified Eagle’s medium plus 10% FBS. The single cell suspension was adjusted to 2 × 10⁵/mL cell density and then transferred into 24-well plates (500 μL per well). After cells reached 90% confluency, the following cotransfections were performed: pcDNA6.2-miRNA-126 + pMIR-ADAM9 group, pcDNA6.2 + pMIR-ADAM9 group, and pcDNA6.2-miRNA-126 + pMIR-ADAM9-Mut group (all transfections in triplicate). After 48 hours, cells were lysed using cell lysis buffer (100 μL per well), placed at room temperature for 15 minutes and subjected to freeze–thaw cycles at −80°C. The cell lysates were collected into 1.5 mL Eppendorf tubes and, then the samples were centrifuged and supernatants were assayed for firefly (40 μL) and renilla luciferase (40 μL) activity for detection of fluorescence intensity.
Western Blot
Protein concentration in cell lysates was determined using bicinchoninic acid protein assay kit. Total protein (50 μg) was loaded onto 10% sodium dodecyl sulfate–polyacrylamide gel, electrophoresed under standard conditions, and wet-transferred onto polyvinylidene fluoride membrane. The membranes were blocked with 5% skimmed milk, and the primary antibodies used were ADAM9 (No: ab186833; Abcam; 1:1000) and β-actin (No: ab6276; Abcam; 1:5000) for overnight incubation at 4°C. After washing 3 times, the membranes were incubated for 1 hour at room temperature with goat anti-rabbit secondary antibody (No: ab6721; Abcam; 1:2000) conjugated with horseradish peroxidase. Blots were developed with ECL Plus reagent (Amersham). Grey values were measured using gel imaging system (Synegene Ltd, Cambridge, Massachusetts) and Gene Tools software (Synegene Ltd, Cambridge).
Statistical Analysis
Statistical analysis was performed using SPSS version 19.0 software. Continuous data were presented as mean ± SD, and data were tested with normality test. Comparisons between 2 groups of nominal variables were made by Student’s t test. Homogeneity of variance and one-way analysis of variance followed by least significant difference test were employed for multiple comparisons. Correlation analyses were calculated by Pearson’s tests. A probability value of less than .05 was considered as statistically significant.
Results
Polymerase Chain Reaction Identification of pcDNA6.2-miRNA-126
Plasmid DNA was isolated from positive clones, and successful miRNA-126 cloning was verified by PCR. As shown in Figure 2, the PCR results showed an expected 277bp band confirming all 6 clones were positive for the presence of miRNA-126 sequence. The pcDNA6.2-miRNA-126 plasmid was double digested with BamH I and Xho I and analyzed on 2.0% agarose gel. A 5.6kb linearized pcDNA6.2-GW/EmGFP band and a 155bp band containing miRNA-126 were observed, as expected (Figure 3). As shown in Figure 4, DNA sequencing results finally confirmed the insert fragment as identical to human miRNA-126 from GenBank sequence, validating the recombinant pcDNA6.2-miRNA-126 plasmid.

Verification of pcDNA6.2-microRNA-126 plasmid by polymerase chain reaction (PCR) and electrophoresis results showed 277bp band (M: Marker; 1-6: clones amplified by PCR).
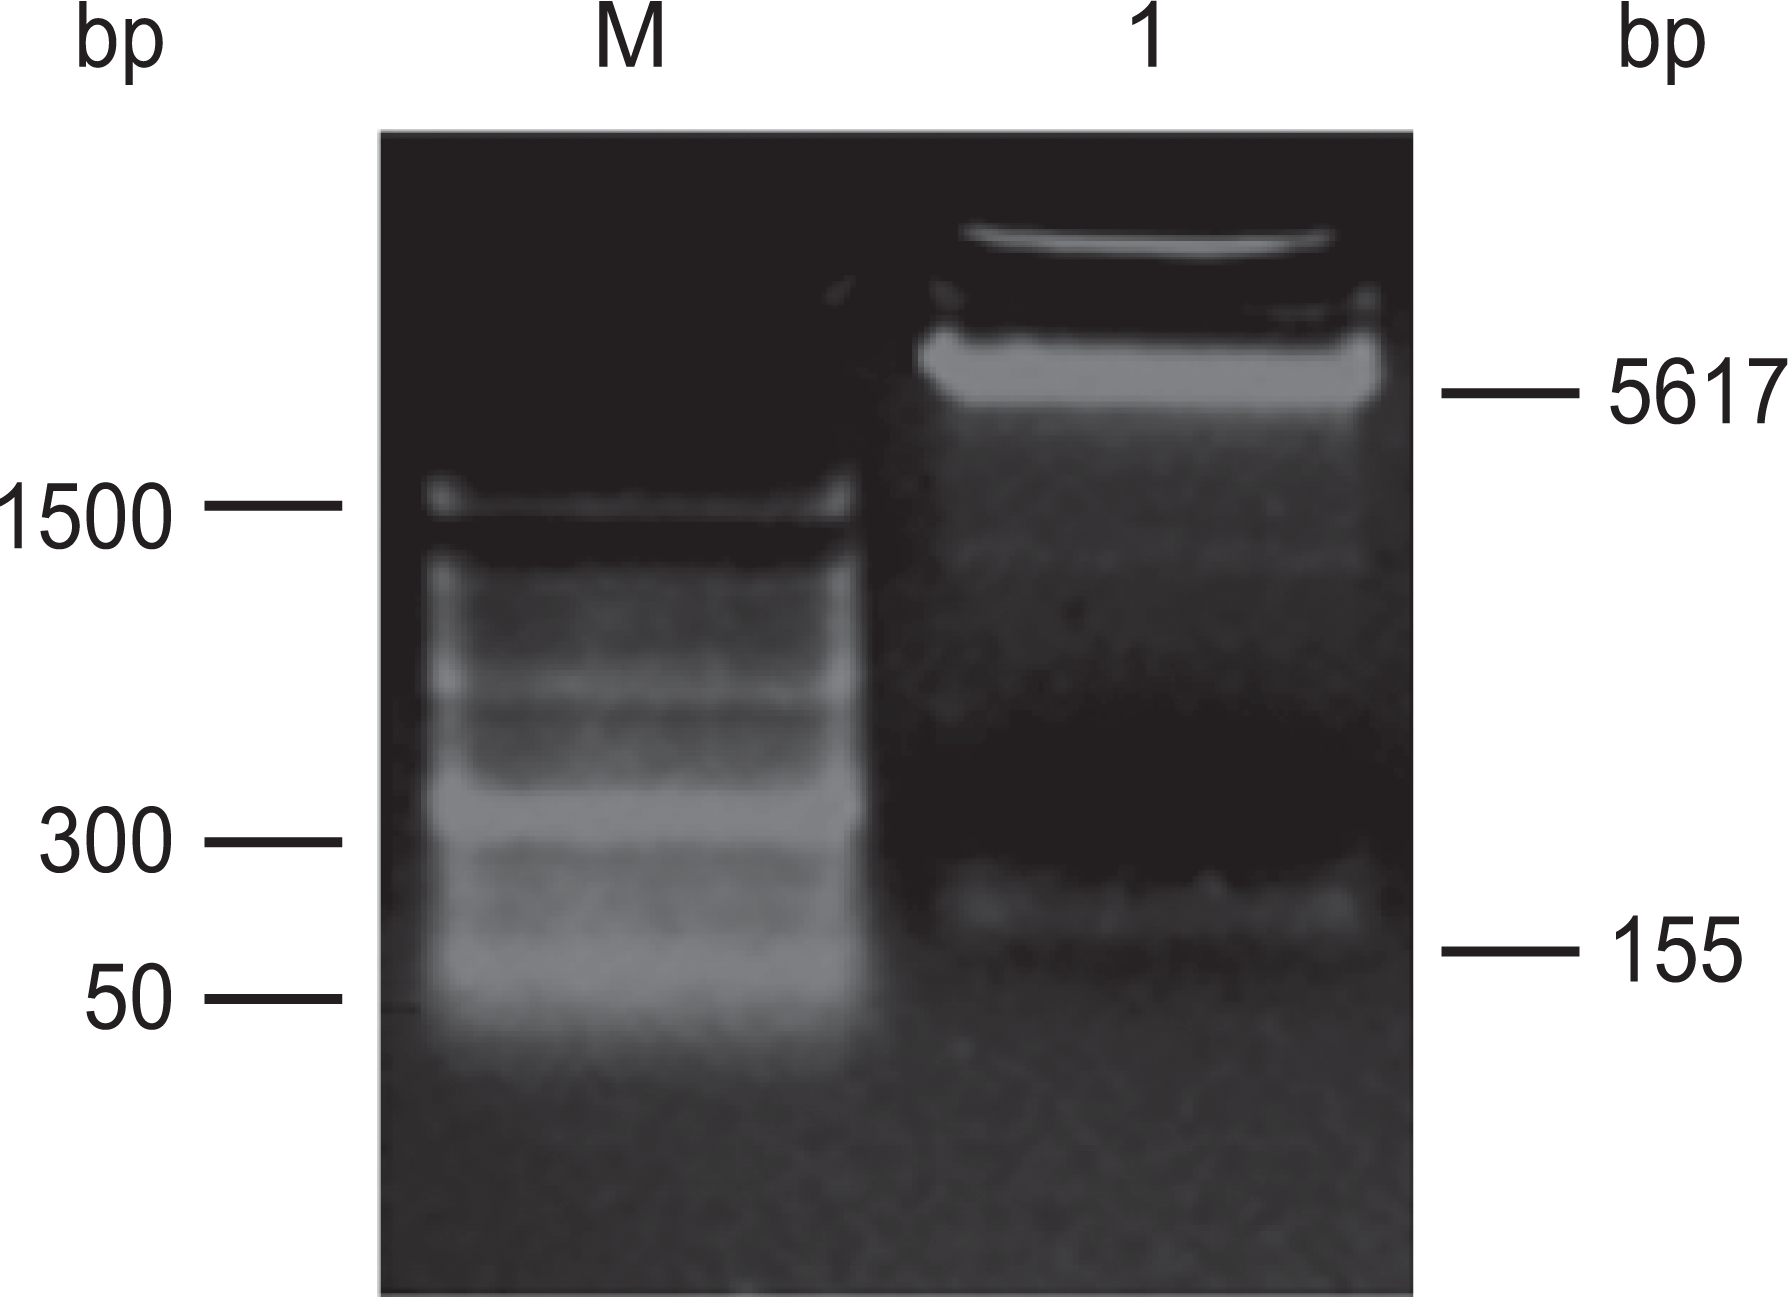
Identification of pcDNA6.2-microRNA-126 plasmid by BamH I/Xho I double digestion, showing pcDNA6.2-GW/EmGFP (5.6kb) and expected band of 155bp (M: Marker; 1: electrophoresis of pcDNA6.2-microRNA-126 plasmid after BamH I/Xho I double digestion).
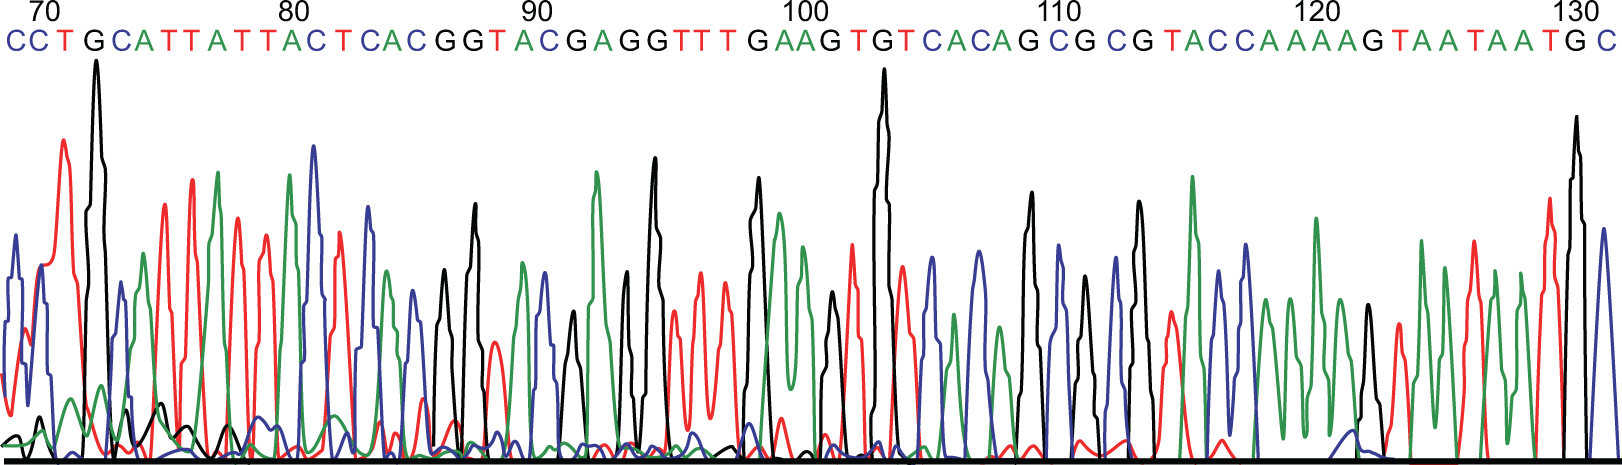
Sequencing results of pcDNA6.2-microRNA-126 plasmid, which was a perfect match with GenBank sequence.
MicroRNA-126 Expression Levels in MG63 Cells Were Upregulated by pcDNA6.2-miRNA-126
Forty-eight hours after MG63 cells were transfected with pcDNA6.2-miRNA-126, the GFP positive cells were estimated to be around 60% based on observations using a fluorescence microscope (Figure 5). The RFQ-PCR results showed that the relative expressions of miRNA-126 in the blank group, Ctrl-MG63 group, and miRNA-126-MG63 group were 0.759 ± 0.069, 0.723 ± 0.048, and 1.835 ± 0.102, respectively. The RFQ-PCR results indicated that the expression level of miRNA-126 in miRNA-126-MG63 group was significantly higher than the Ctrl-MG63 group and blank group (both P < .05). No difference was observed in the miRNA-126 expression levels between Ctrl-MG63 group and blank group (P > .05; Figure 6).

Expression of GFP in MG63 cells transfected with pcDNA6.2-microRNA-126 using a fluorescence microscope (×100).

Expression of microRNA-126 in human osteosarcoma MG63 cells by real-time fluorogenic quantitative polymerase chain reaction (n = 10). A, Compared with blank group, P < .05. B, compared with Ctrl-MG63 group, P < .05).
pcDNA6.2-miRNA-126 Transfection Inhibited the Proliferation of MG63 Cells
Cell proliferation rate was compared between the 3 groups. At 24 hours of transfection, the cell proliferation rates were similar between the 3 groups (all P > .05). However, after 48 and 72 hours of transfection, the cell proliferation rate in miRNA-126-MG63 group was significantly lower than Ctrl-MG63 group and blank group (both P < .05), while the cell proliferation rate between Ctrl-MG63 group and blank group was not different (P > .05; Table 1 and Figure 7).
Cell Proliferation Rate on 3 Groups at Different Time Points by Methyl Thiazolylte-Trazolium.a

an = 10.
bCompared with blank group, P < .05.
cCompared with Ctrl-MG63 group, P < .05.

Cell proliferation rate in three groups at different time points by methyl thiazolylte-trazolium (n = 10).
pcDNA6.2-miRNA-126 Transfection Inhibited the Cell Cycle of MG63 Cells
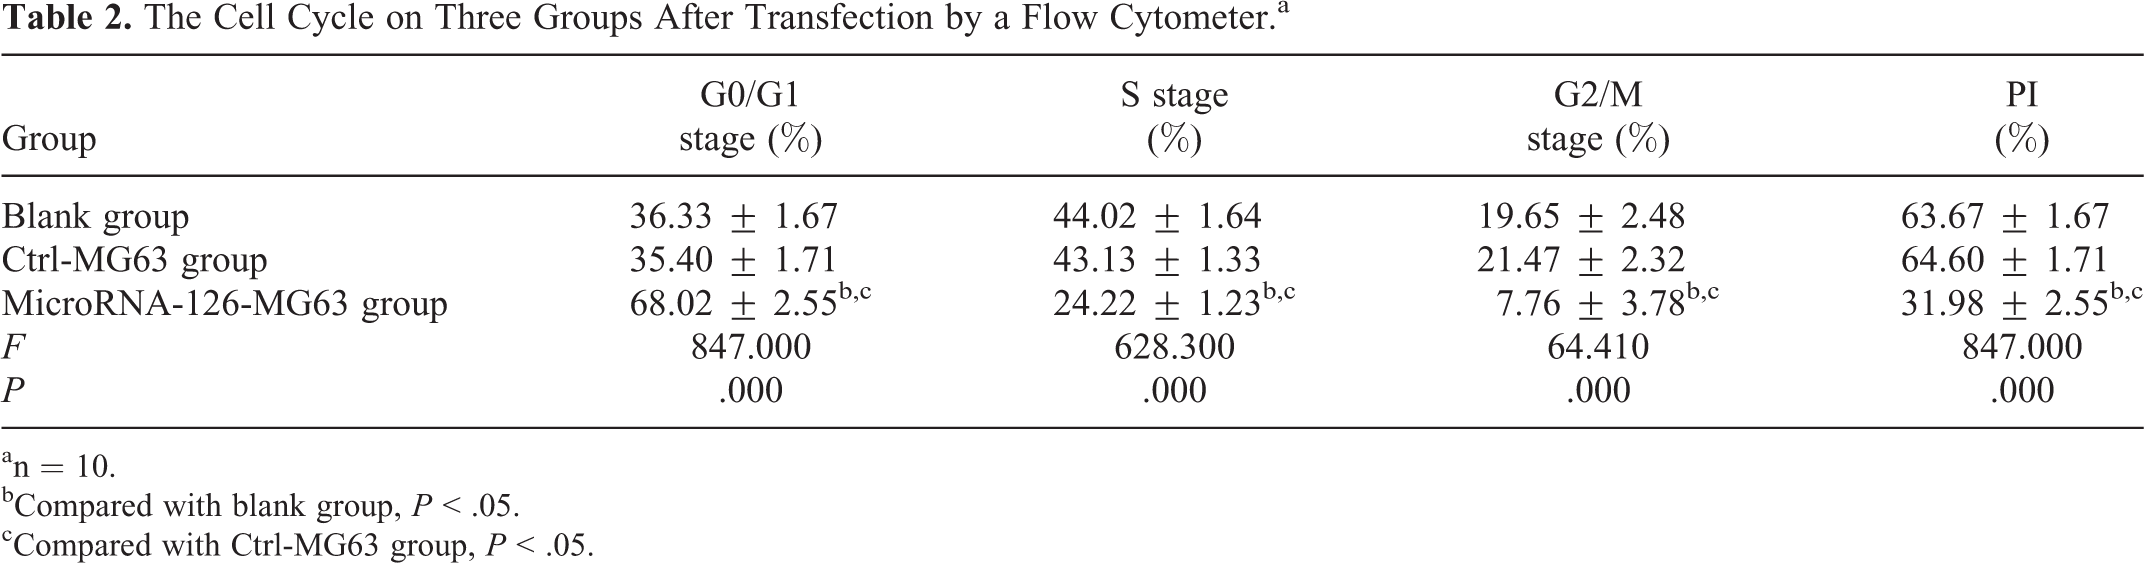
The proportion of cells in G0/G1 stage in the miRNA-126-MG63 group was 68.02 ± 2.55%, which was higher than the blank group (36.33 ± 1.67%) and Ctrl-MG63 group (35.40 ± 1.71%; both P < .05). On the other hand, the number of cells in S phase in the miRNA-126-MG63 group was significantly lower than the blank group and Ctrl-MG63 group (miRNA-126-MG63 group vs blank group: 24.22 ± 1.23 vs 44.02 ± 1.64; miRNA-126-MG63 group vs Ctrl-MG63 group: 24.22 ± 1.23 vs 43.13 ± 1.33, both P < .05). The cells in G2/M stage in miRNA-126-MG63 group was 7.76 ± 3.78%, which was significantly lower compared to the blank group (19.65 ± 2.48%) and the Ctrl-MG63 group (both P < .05). Consistent with this, the PI in miRNA-126-MG63 group was markedly reduced compared with blank group and Ctrl-MG63 group (miRNA-126-MG63 group vs blank group: 31.98 ± 2.55 vs 63.67 ± 1.67; miRNA-126-MG63 group vs Ctrl-MG63 group: 31.98 ± 2.55 vs 64.60 ± 1.71, both P < .05). We did not observe any significant differences in the proportion of cells in G0/G1, S phase, G2/M, and PI between the blank group and Ctrl-MG63 group (all P > .05; Table 2 and Figure 8).
The Cell Cycle on Three Groups After Transfection by a Flow Cytometer.a
an = 10.
bCompared with blank group, P < .05.
cCompared with Ctrl-MG63 group, P < .05.
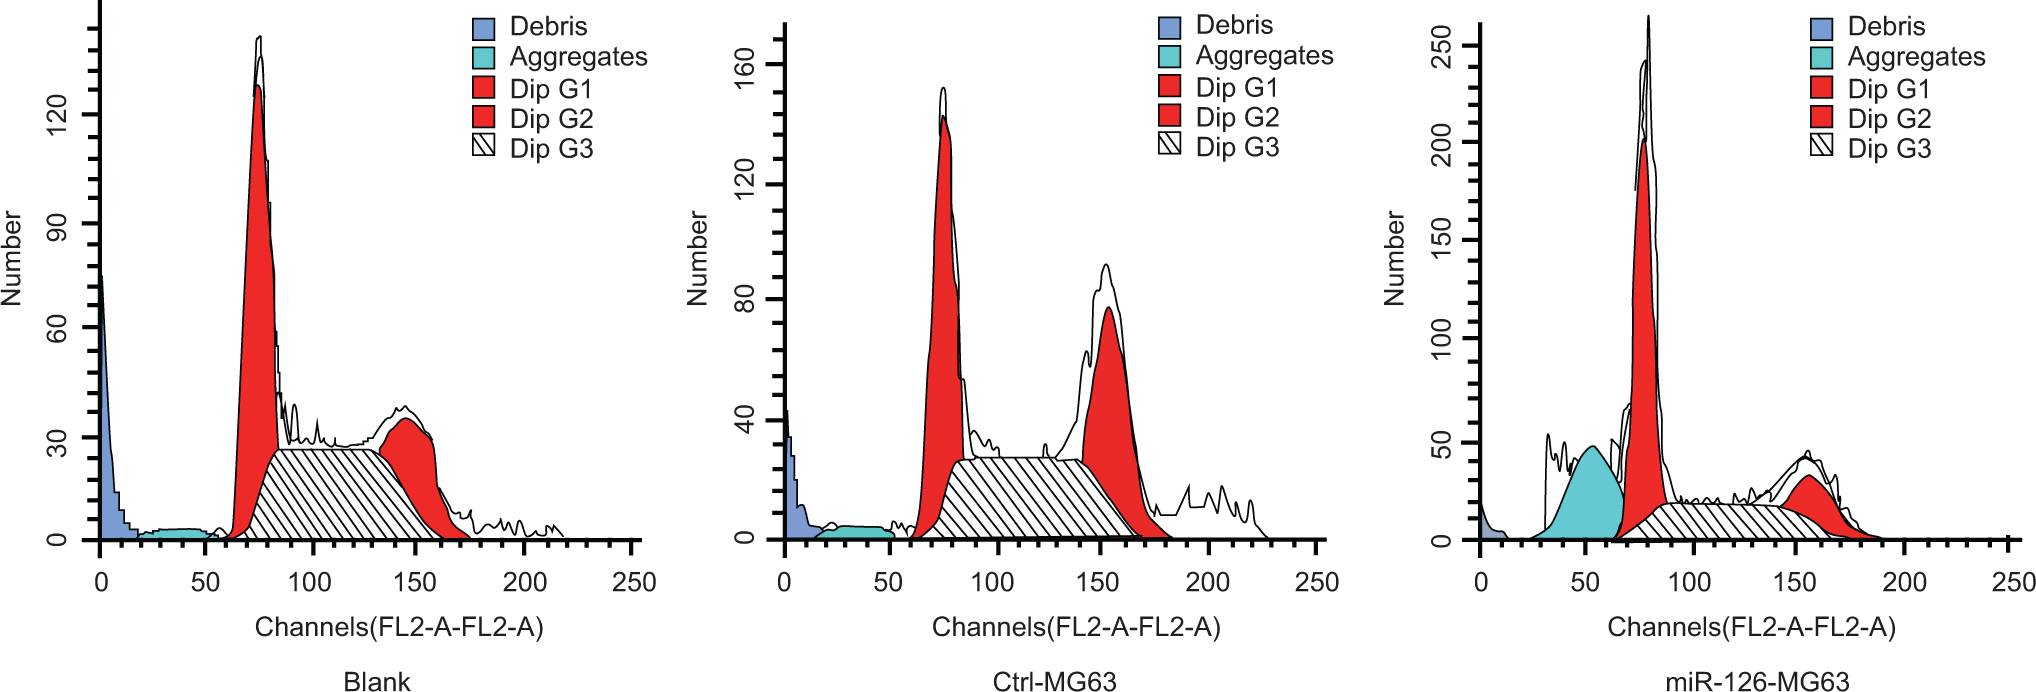
The cell cycle analysis in 3 groups after transfection by flow cytometer (n = 10).
pcDNA6.2-miRNA-126 Transfection Inhibited MG63 Cells Migration
As shown in Figures 9 and 10, scratch test revealed that 48 hours after transfection, the scratch width in miRNA-126-MG63 group was 298.3 ± 4.382 µm, which was significantly wider than the Ctrl-MG63 group (99.89 ± 4.017 µm) and the blank group (102.7 ± 3.753 µm), showing statistically significant differences (both P < .01). As expected, the Ctrl-MG63 group and the blank group did not show significant differences in scratch width (P > .05).

MG63 cells migration by scratch test observed using inverted fluorescence microscope at different time points in the 3 groups (×100).

The pcDNA6.2-microRNA-126 transfection inhibited migration of MG63 cells in vitro. A, Compared with blank control group, P < .05. B, compared with Ctrl-MG63 group, P < .05).
pcDNA6.2-miRNA-126 Transfection Inhibited MG63 Cells Invasion
The transwell migration results are presented in Figure 11, confirming that chemotactic migration of cells in the miRNA-126-MG63 group (227.3 ± 17.60) was significantly lower compared to the blank group (441.7 ± 20.19) and Ctrl-MG63 group (429.8 ± 24.33; both P < .05), with no such differences detected between blank group and Ctrl-MG63 group (P > .05; Figure 11). Transwell invasion assay also verified that miRNA-126-MG63 group exhibited the lowest invasion capacity (103.7 ± 10.12) in comparison to both the blank group (243.8 ± 22.71) and the Ctrl-MG63 group (251.1 ± 25.30; both P < .05), while no such differences were detected between the blank group and Ctrl-MG63 group (P > .05).

Transwell migration assay to detect the cell migration and invasion (×200, n = 3), our results demonstrated that the migrated cells and invasive cells in miR-126-MG63 group lower compared to the blank group and Ctrl-MG63 group, suggesting that microRNA-126 transfection inhibited MG63 cells migration and invasion. A, Compared with blank group, P < .05. B, compared with Ctrl-MG63 group, P < .05.
Luciferase Assay Results
Cotransfection of pcDNA6.2-miRNA-126 and pMIR-ADAM9 in MG63 cells resulted in a dramatic reduction in luciferase activity. However, no significant differences in luciferase activity were observed upon transfection with pcDNA6.2 (empty vector) and pMIR-ADAM9. Our results showed that cotransfection of recombinant vectors pcDNA6.2-miRNA-126 and pMIR-ADAM9-Mut did not lead to a significant change in luciferase activity, along with no difference in luciferase activity when pcDNA6.2 (empty vector) and pMIR-ADAM9 (empty vector) alone were transfected (Figure 12). Indeed, our luciferase assay results confirmed that miRNA-126 efficiently regulated luciferase expression through the 3′UTR of ADAM9.

MicroRNA-126 targeting of ADAM9 3′-untranslated region (UTR). A, TargetScan found that ADAM9 3′-UTR contains binding sites for microRNA-126. B, MicroRNA-126 targeting ADAM9 gene. A, Compared with pcDNA6.2+pMIR-ADAM9, P < 0.05. b, compared with pcDNA6.2- microRNA-126 and pMIR-ADAM9-Mut, P < 0.05.
MicroRNA-126 Regulates the Expression of ADAM9
Western blot analysis showed that ADAM9 expression in miRNA-126-MG63 group was remarkably lower than both blank group and Ctrl-MG63 (both P < .05). The difference in expression of ADAM9 between blank group and Ctrl-MG63 was not statistically significant (P > .05; Figure 13).

The miR-126-MG63 group presented with the lowest ADAM9 expression compared with other 2 groups, suggesting microRNA-126 regulates the expression of ADAM9. A, Compared with blank group, P < .05. B, Compared with Ctrl-MG63 group, P < .05.
MicroRNA-126 Inhibits the Proliferation, Invasion, and Migration of MG63 Cells Via Regulation of ADAM9
After 48 and 72 hours of transfection with pcDNA6.2-miRNA-126, the MG63 cell proliferation rate was sharply reduced in comparison to the blank group (P < .05). However, the cell proliferation rates in MG63 cells increased dramatically after cotransfection with pcDNA6.2-miRNA-126 and pMIR-ADAM9, compared to transfection with pcDNA6.2-miRNA-126 alone (P < .05; Figure 14). Similar results were obtained for cell invasion and chemotactic migration of MG63 cells, indicating that MG63 invasion and migration were significantly increased in the blank group and upon cotransfection with pcDNA6.2-miRNA-126 and pMIR-ADAM9, compared with transfection of pcDNA6.2-miRNA-126 alone (P < .05; Figure 15).

MicroRNA-126 inhibits the proliferation of MG63 via regulation of ADAM9 in 24, 48 and 72 hours.
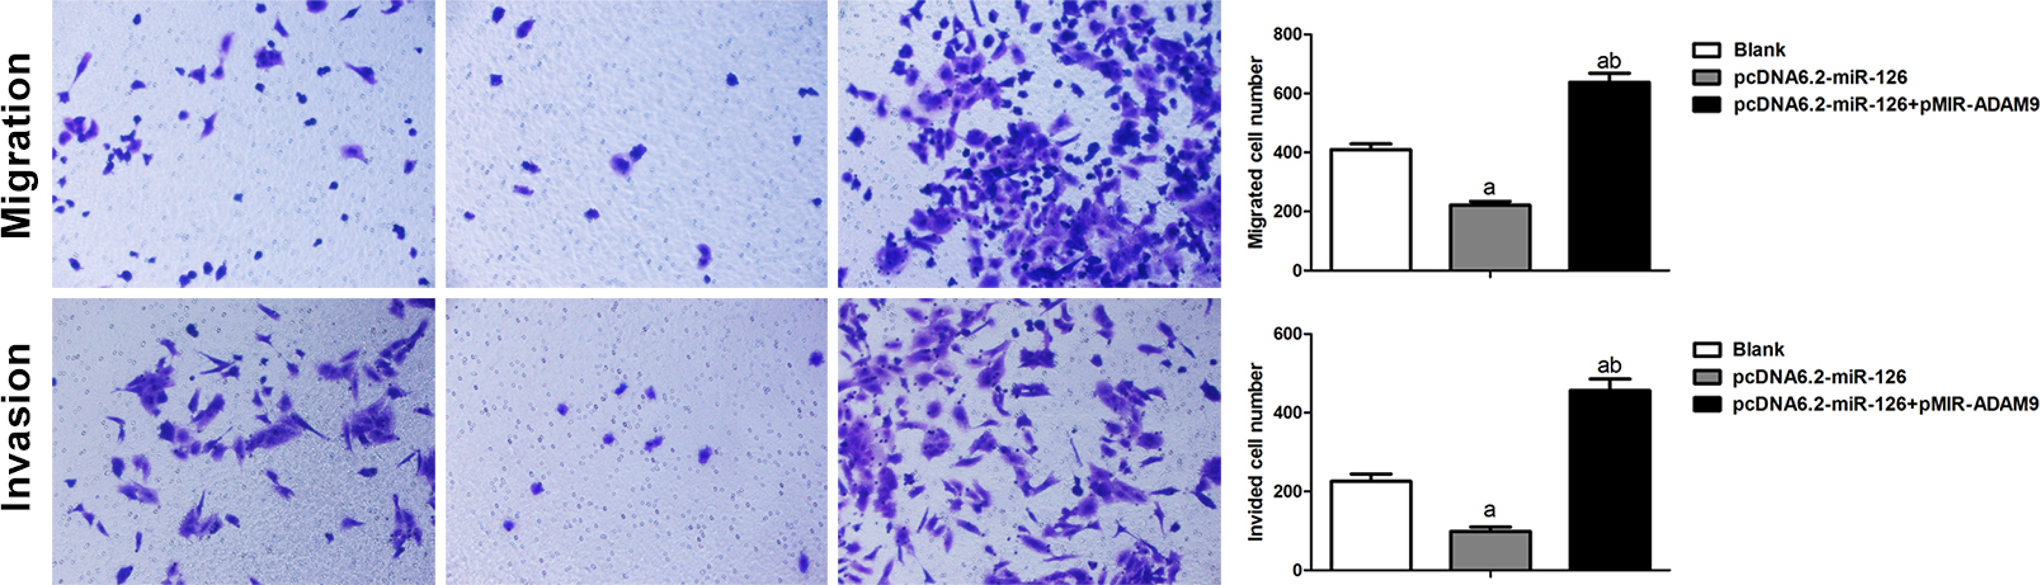
MicroRNA-126 inhibits the migration and invasion of MG63 via regulation of ADAM9 (×100, A, Compared with blank group, P < .05; B, Compared with pcDNA6.2-microRNA-126 group, P < .05).
Discussion
MiRNAs are small (22-25 nucleotides) noncoding RNAs found in plants and animals and regulate gene expression by binding to complementary sequences located in the 3′UTR of target messenger RNAs (mRNAs). 18 In humans, miRNAs control around 30% of all fundamental cellular pathways related to cell proliferation, differentiation, cell growth, and apoptosis. 19 Importantly, crucial pathways regulated by miRNAs are disrupted in diseased states since most cancers and many other human diseases invariably exhibit aberrant miRNA expression profiles that significantly influence the disease progression. 4 Therefore, an understanding of the underlying miRNA mechanisms in specific diseases and their target pathways may lead to better design of novel approaches for diagnosis and therapy. To understand the function of miRNA-126 relevant to OS, miRNA-126 expression in MG-63 cells and its effects on cell proliferation, migration, and invasion was studied. In this study, we present evidence that miRNA-126 inhibits cell proliferation and invasion in OS cells and decreased miRNA-126 levels may be tightly correlated with aggressive OS progression, influencing multiple cellular pathways.
The MTT assay was used to quantify the effects of miRNA-126 on cell proliferation in OS cells. The results showed that overexpression of miRNA-126 inhibited cell proliferation, suggesting an inverse relationship between miRNA-126 expression levels and cell proliferation pathways in MG-63 cells. Consistent with our results, Xu et al showed that miRNA-126 expression levels were significantly reduced in 4 OS cell lines and overexpression of exogenous miRNA-126 in these cell lines inhibited cell proliferation by reducing Sirt1 levels. 4 Sirt1 is a NAD+-dependent histone deacetylase implicated in multiple biologic processes and functions by modifying the activities of crucial transcription factors such as p53, nuclear factor-κB, peroxisome proliferator-activated receptor-gamma coactivator-1 (PGC-1), and nuclear receptors. 20,21 Consequently, Sirt1 overexpression blocks apoptosis and senescence and promotes cell proliferation and angiogenesis. Consistent with this, inhibition or downregulation of Sirt1 induces growth arrest in cells and promotes senescence and apoptosis. 22 -24 Sirt1 is highly expressed in tumor cells compared to normal osteoblasts, which is also consistent with our study results.
In this study, we showed that upregulation of miRNA-126 inhibits cell invasion and chemotactic cell migration in MG-63 cells. In support of our results, a recent study in OS cells concluded that miRNA-126 targets ADAM 9 mRNA by directly binding to its complementary site located within the 3′-UTR of ADAM9, 25 suggesting that miRNA may inhibit proliferation, invasion, and migration of MG-63 OS cells via regulation of ADAM9 levels. As expected, a previous study showed that infection with a lentivirus expressing miRNA-126 resulted in a significantly reduced levels of both ADAM-9 mRNA and protein in these cells. It is interesting to note that ADAM-9 also participates in tumorigenesis, invasion, and metastasis. 26,27 ADAM-9 is secreted by human osteoblasts and functions as an insulin-like growth factor binding protein-5 protease, with an important role in bone formation. 28 We also compared the effects of miRNA-126 on cell cycle in MG63 cells transfected with various recombinant plasmids, and our results demonstrated that PI and the proportion of cells in S phase and G2/M phase were remarkably decreased in the miRNA-126-MG63 group, compared to all the other groups.
There are several highlights of this study that should be noted. First, a eukaryotic recombinant plasmid expressing miRNA-126, pcDNA6.2-miRNA-126, was successfully constructed and tested. Second, a systematic analysis was performed by designing 3 groups, namely, miRNA-126-MG63 group, Ctrl-MG63 group, and blank group, to identify the function of miRNA-126 in OS, which strengthens the credibility of our conclusions. In addition, cell cycle analysis confirmed the effects of miRNA-126 in cell cycle regulation, thus our results support each other and strengthen our overall conclusions through comprehensive analysis of miRNA-126 influence on OS cells. Thus, our study is more comprehensive and present significant supporting data compared to the very limited data available from previous studies.
In summary, our results provide strong evidence that miRNA-126 inhibits cell proliferation, migration, and invasion in OS MG63 cells via regulation of ADAM9. Thus, miRNA-126 plays an essential role in the regulation of OS cell proliferation and may function as a tumor suppressor. Understanding the precise role played by miRNA-126 will not only advance our knowledge of OS biology but will also be helpful in evaluating the diagnostic and therapeutic potential of miRNA-126 in OS.
Footnotes
Acknowledgments
We would like to acknowledge the helpful comments on this article received from our reviewers.
Declaration of Conflicting Interests
The author(s) declared no potential conflicts of interest with respect to the research, authorship, and/or publication of this article.
Funding
The author(s) received no financial support for the research, authorship, and/or publication of this article.