
Abstract
Purpose:
This work reports the extension of a semiempirical method based on the correlation ratios to convert electronic portal imaging devices transit signals into in vivo doses for the step-and-shoot intensity-modulated radiotherapy Siemens beams. The dose reconstructed at the isocenter point Diso, compared to the planned dose, Diso,TPS, and a γ-analysis between 2-dimensional electronic portal imaging device images obtained day to day, seems to supply a practical method to verify the beam delivery reproducibility.
Method:
The electronic portal imaging device images were obtained by the superposition of many segment fields, and the algorithm for the Diso reconstruction for intensity-modulated radiotherapy step and shoot was formulated using a set of simulated intensity-modulated radiotherapy beams. Moreover, the in vivo dose-dedicated software was integrated with the record and verify system of the centers.
Results:
Three radiotherapy centers applied the in vivo dose procedure at 30 clinical intensity-modulated radiotherapy treatments, each one obtained with 5 or 7 beams, and planned for patients undergoing radiotherapy for prostatic tumors. Each treatment beam was checked 5 times, obtaining 900 tests of the ratios R = Diso/Diso,TPS. The average R value was equal to 1.002 ± 0.056 (2 standard deviation), while the mean R value for each patient was well within 5%, once the causes of errors were removed. The γ-analysis of the electronic portal imaging device images, with 3% 3 mm acceptance criteria, showed 90% of the tests with Pγ < 1 ≥ 95% and γmean ≤ 0.5. The off-tolerance tests were found due to incorrect setup or presence of morphological changes. This preliminary experience shows the great utility of obtaining the in vivo dose results in quasi real time and close to the linac, where the radiotherapy staff may immediately spot possible causes of errors. The in vivo dose procedure presented here is one of the objectives of a project, for the development of practical in vivo dose procedures, financially supported by the Istituto Nazionale di Fisica Nucleare.
Introduction
Due to the increasing complexity of radiotherapy dose delivery and the trend to reduce margins around the tumor, it is necessary to verify the agreement between delivered and planned dose. The dose delivered to patients can be influenced by several factors throughout the course of treatment, for example, technical errors, patient setup, anatomical changes. Pretreatment dosimetry by means of 2-dimensional (2D) dosimeters or directly by the electronic portal imaging devices (EPIDs) 1,2 is commonly used to assess the accuracy of computed treatment planning system (TPS) and dose distributions of intensity-modulated radiotherapy (IMRT) beams, but the method is time consuming and the dose differences detected with pretreatment verification are difficult to translate to dose differences inside the patients. 2 However, studies about the implementation of in vivo dose (IVD) systems show that a relevant number of clinically unacceptable errors, due to inadequate quality control, may remain undetected even when pretreatment verifications are used. 2 –4 Moreover, in the last years, several major incidents leading to significant complications, and even to death of patients, have been widely discussed by the media. 5 The IVD tests have been recommended by different organizations, 6,7 and we believe they will become mandatory in many countries to fulfill legal requirements. 8,9 The IVD is actually one of the major challenges in radiotherapy, and several researchers 10 have demonstrated the advantages of reconstructing the delivered dose by amorphous-silicon EPIDs (aSi-EPIDs) that present favorable characteristics such as fast image acquisition and high resolution. 11 Several methods have been successfully developed for dose reconstruction in patient in terms of point dose, 2D, or full 3-dimensional (3D) dose distribution. 12 –18 Nowadays, the routine application of IVD is not widespread because of the workload involved. 10 The authors have recently developed an IVD procedure for 3D conformal radiotherapy (3D-CRT) beams, delivered by different linacs (Elekta, Varian, and Siemens), 19 based on 2 tests: the first test for the isocenter dose reconstruction and the second test based on the comparison between EPID images obtained in different therapy sessions to verify for each beam treatment reproducibility. In particular, this procedure adopts an easy commissioning based on (1) a set of generalized correlation functions obtained fitting the experimental ratios between the transit signals and the doses at phantom midplane and (2) a simple calibration procedure for the different aSi-EPID models. Moreover, using the record and verify (R&V) network of the center, the IVD tests can be obtained in quasi real time, assuring that the radiotherapy staff can immediately spot any dose variations. 13,20 The present work reports the IVD algorithm, developed for step-and-shoot IMRT beams of Siemens linacs, using EPID images weighted according to the per-segment accumulated dose by pixel. The easy commissioning of the method and the possibility to obtain the results in quasi real time are the reasons of the development of this procedure that can be used in clinical practice.
Materials and Methods
Linac Units and TPS
Three Siemens (Oncor Impression, Oncor Expression, and Artiste) linacs (Siemens, Concorde, California), operating, respectively, at the Ospedale Belcolle of Viterbo, at the Ospedale Oncologico Businco of Cagliari, and at the Centro Oncologico Fiorentino of Sesto Fiorentino, were used in this work (Table 1) to develop an IVD procedure for step-and-shoot IMRT beams.
The Main Characteristics of the Facilities Used in This Work by the 3 Centers.
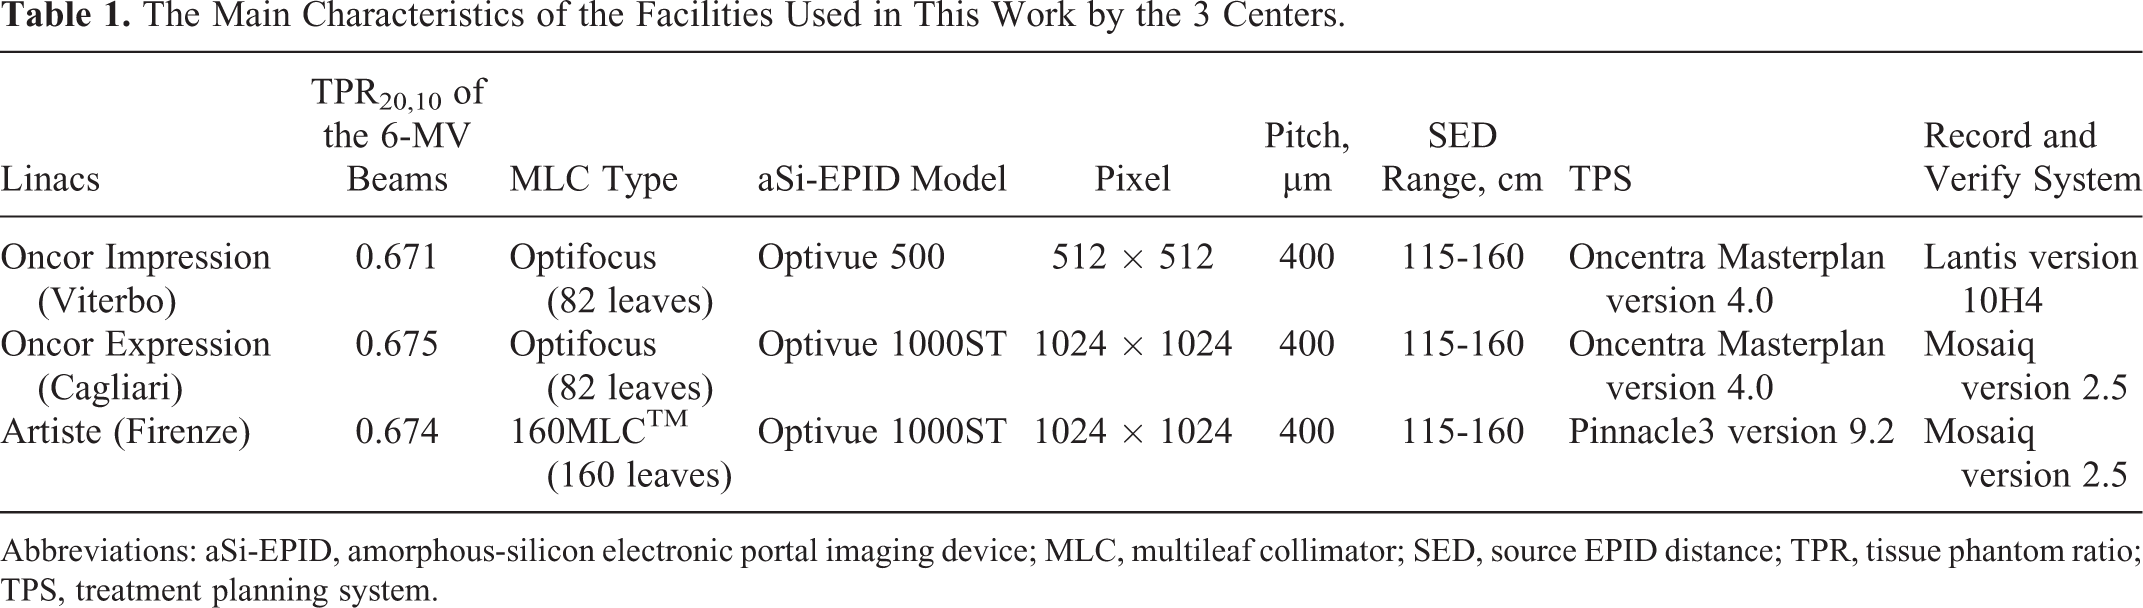
Abbreviations: aSi-EPID, amorphous-silicon electronic portal imaging device; MLC, multileaf collimator; SED, source EPID distance; TPR, tissue phantom ratio; TPS, treatment planning system.
Of the 3 linacs (Oncors), 2 were equipped with an Optifocus fully integrated multileaf collimator (MLC [Siemens Medical Solutions]), consisting in a couple of opposite leaf banks, carrying 41 leaves each, with leaf width equal to 1 cm at the source axis distance (SAD). The third linac, an Artiste, was equipped with an 160 MLC (2 opposite leaf banks, carrying 80 leaves each, each leaf of 0.5 cm width at the SAD).
All 3 linacs are equipped with an Optivue EPID, based on aSi panels XRD 1640 AL7 (PerkinElmer Optoelectronics, Fremont, California), positionable at source EPID distance (SED) ranging between 115 and 160 cm. The flat panel sensor of the XRD 1640 radiation image detector is based on thin film technology. It basically consists of an amorphous silicon thin film transistor—photodiode array, closely coupled to an X-ray scintillator LANEX 21 (Carestream, Rochester NY, USA) with a sensitive layer (pitch) of 400 µm (Table 1).
Although the portal images for open or wedged beams used for 3D-CRT technique can be obtained by integrated signals over the total beam-on time and the images can be used directly for IVD reconstruction, 19 the step-and-shoot IMRT portal images of the Siemens EPIDs are obtained by the superposition of many segmented fields that are individually not weighed for dose or monitor units (MUs). The signal of portal image, for each single segment stored in a Digital Imaging and Communications in Medicine (DICOM) file, was multiplied by the frame number, 19 and this way the sum of the signals from all the segments supplies an integral image weighted in dose.
Intensity-modulated clinical beams of 6 MV were used in the 3 centers for prostate treatments, delivered in step-and-shoot modality. The TPSs used in this work are reported in Table 1, and the dose calculations were performed using the collapsed cone convolution algorithm, with inhomogeneity correction and a dose grid resolution of 2 mm. The dose assigned at the isocenter per fraction and single beam was here named as Diso,TPS.
The DICOM-RT (Dicom version for radiotherapy) files supplied by TPS provided for each beam the MLC positions and the MUs of each segment. This information was used by a homemade software, developed in Matlab code, to obtain a beam integral intensity map (in terms of MUs) with a pixel resolution of 2 × 2 mm2. Assuming the X-ray fluence map is proportional to the MU map, the latter has been used in this work to determine a fluence inhomogeneity (FI) index of the IMRT beam, as defined in Fluence inhomogeneity index section.
Transit Dosimetry
Simulated IMRT Beams
The aim of this work is the extension of a general IVD algorithm (developed and already tested both for open and for wedged 3D-CRT fields) 19 for intensity-modulated beams delivered by Siemens linacs. The method basically relies on correlation functions between EPID transit signals (at SED = 160 cm) and measured doses at the isocenter point in solid water phantoms (SPs).
New correlation functions, specifically characterized for modulated beams, have been obtained irradiating SPs of different thicknesses, w, by a set of simulated IMRT beams. Figure 1 schematically reports the method to obtain IMRT square beams with size L = 6, 10, 14, and 16 cm at the SAD. In detail, a homogeneous square beam (field 1) has been “modulated” by adding either a couple of rectangular off-axis fields (fields 2 and 3) or a single rectangular field (field 4).

(A) Scheme of the beams used to obtain simulated IMRT-beams. A basic L × L square field (field 1) has been added at either (B) 2 off-axis rectangular fields b × L sized (field 2) or (C) a central rectangular field bxL sized. The MU contribution for each field could vary among 10 and 100 MU: This way 6 simulated IMRT-n beams have been obtained (see Table 2). The BCA is marked by symbol (+) and the crossplane direction (x) is also shown. IMRT indicates intensity-modulated radiotherapy; MU, monitor unit.
Rectangular fields are sized b × L, (where b could be equal to 2 or 4 cm), and the MU individual contribution of the combined fields at the simulated IMRT beam is reported in Table 2. This way from each of the 4 basic square beams, 6 IMRT beams were obtained using the MU reported in Table 2, for a total of 24 IMRT-beams.
Figure 2 shows the profiles along the x-axis (Figure 1) of the integral signal St provided by DICOM EPID images for the IMRT-1 and IMRT-3 (Figure 2A) beams, and IMRT-4 and IMRT-6 beams (Figure 2B), obtained for L = 10 cm and b = 2 cm, compared with the open beam profile (Table 2). All the profiles are reported at the SAD.

Integral transit signal St profiles in arbitrary units (au) as obtained by electronic portal imaging device (EPID) images along the x-axis (Figure 1) for the basic open beam 10 × 10 cm2 and b = 2 cm: (A) IMRT-1 and IMRT-3; (B) IMRT-4 and IMRT-6 (Table 2). IMRT indicates intensity-modulated radiotherapy.
MU contributions for combined fields 1, 2, 3, 4 in order to obtain simulated IMRT fields, as illustrated in Figure 1.a

Abbreviations: FI, fluence inhomogeneity; IMRT, intensity-modulated radiotherapy; MU, monitor unit.
aSix simulated IMRT-beams for each basic square field were so obtained. The last column reports the corresponding fluence inhomogeneity index, FI (defined in Fluence inhomogeneity index section) for the case L = 10 cm and b = 2 cm.
Fluence Inhomogeneity Index
An integral IMRT beam presents external boundaries similar to those of conformed beams used for the 3D-CRT, and the difference is in the FI of the MU delivered at the beam segments. A software was developed in Matlab to obtain (1) the integral intensity map in terms of MU and (2) the computation of a fluence inhomogenity (FI) index defined as:

where MUi is the MUs of the N pixels, each one of area ai = 2 × 2 mm2, A is the total surface within the external boundaries of the IMRT beam determined by multiplying the single area, ai, by N, and
A number of different indices have been developed for the assessment of complexity, which is inherent in IMRT treatment plans, aiming to quantify comparisons between planning solutions and prediction about their deliverability in terms of evolution criteria and action levels. 22,23 The FI index in Equation 1 was used because it is formulated using available information about MLC position and MU numbers of each segment, recorded in each DICOM-RT beam file stored in the R&V system of the center.
Measurements for Simulated IMRT Beams
The dose determination by an ion chamber, for typical IMRT fields (where the departure from reference conditions is dominant), can be affected in minimal part by the variations in water–air stopping power ratios and mostly by the specific type of the ion chamber. 24 –26 So accepting an additional uncertainty for ion chambers in absolute dose determination of IMRT fields, specific ion chambers are recommended for pretreatment verifications. Following these indications and using the simulated IMRT beams, the SP mid-plane doses D(w/2, L, FI) at the SAD, in terms of cGy/MU, were obtained by a Semiflex PTW (Freiburg, Germany) ion chamber (0.125 cm3 in volume) along the BCA, in regions where the beams presented negligible dose gradients (as reported in Figure 2). 27 The same irradiation was used to measure the EPID (at SED = 160 cm) transit signals, st (w, L, FI), in terms of arbitary units (au)/MU, averaging the signal values of 8 × 8 central pixels (the same grid resolution of TPS calculation). This way using SP thicknesses w = 12, 22, 32, and 42 cm, the correlation ratios between the transit signals and the midplane doses at the SAD were obtained by

The ratios between FIMRT(w,L,FI) and F(w,L) (this latter ratios obtained for open beams in the same experimental conditions 19 ) supplied the factors

In order to take into account the variations in scattered photon contributions on EPID due to the different EPID to phantom distances, a new set of transit signals measurements were performed, shifting the phantom mid-plane to distances d = ±3 cm and ±5 cm from the SAD. This way, irradiating the SP with the simulated IMRT beams, the ratios fIMRT(w,L,d,FI) between the transit signals with d = 0 and d ≠ 0 were obtained as

and new factors kf were defined as

where f(w,L,d) ratios were obtained in the same experimental conditions of open beams. 19
In this work, the tissue maximum ratios (TMRs) 28 for intensity-modulated beams (TMRMs) have been defined by the ratios:

measured at depths δ and δmax = 1.5 cm (approximately the depth of maximum dose for 6 MV beams) at the SAD.
The measurements were carried out using the PTW Seminflex ion chamber positioned on the BCA in an SP 42-cm thick and irradiated with 6 MV simulated IMRT beams, characterized by the FI index.
The TMRM data obtained by Equation 6 were fitted and used to determine the ratio

with the depths wiso and w/2, both at the SAD.
Reconstruction of Diso and γ-Analysis
Introducing the factors kF (Equation 3), kf (Equation 5), and the TMRM (Equation 7) into the algorithm for 3D-CRT Diso reconstruction, 19 a more general equation suitable for IMRT beams was formulated as follows:

where St is the integral transit signal in au obtained averaging the signals of 8 × 8 central pixels (a macro-pixel, corresponding to an area of 2 × 2 mm2 at the SAD), and the other parameters have been previously defined.
The agreement between the reconstructed dose, Diso, and the planned dose, Diso,TPS, was analyzed for each beam in terms of the ratio

A software package DISO was developed in 2 integrated modules. The first module uses the DICOM files supplied by the computed tomography (CT) scanner and by the TPS to determine the parameters reported in brackets of Equation 8. In particular, CT data are used to measure, along the BCA, the phantom thickness, z, and the isocenter depth, diso. The water-equivalent thicknesses, w, and the depth, wiso, are determined as the product of z and diso with the mean physical density, obtained by the linear relation between the electronic and the physical density.
The FI computation is included in this first DISO module as well as the determination of the equivalent square field size, L. According to the conventional equation L = 2XY/(X+Y), 29 for rectangular static fields, L is calculated considering X as the jaw or MLC bank distance and Y as defined by the jaw setting. In a previous work, 30 the equivalent square field size, L, for 3D-CRT beams was determined using, as X, the mean of all apertures defined by opposing leaves within the field and, as Y, the distance corresponding to the open leaves (leaf width multiplied by the number of unclosed leaves). For step-and-shoot IMRT beams, L is determined as for 3D-CRT beams. 31 In conclusion, all the parameters reported in brackets of Equation 8 were acquired for every IMRT beam in about 30 seconds (before the beginning of the treatment).
Using the DICOM files of portal images collected by the EPID, the second DISO module was developed to obtain in different therapy fractions and in quasi real time (1) the R ratio for each beam, with an acceptance criteria 0.950 ≤ R ≤ 1.050, determined on the basis of the dose uncertainties of the parameters reported in the Equations 8 and 9, 19 and (2) the γ-analysis 32 for the day-to-day EPID images. As reported in the literature, 33-34 the comparison between EPID integral images, obtained for each beam, can be used to verify the presence of changes in patient setup, machine output, and leaf behavior during each treatment. 35,36 In this work. for each IMRT beam, the reference 2D-EPID images obtained in the first therapy fraction (In vivo dosimetry section) were used as a surrogate of signals that the EPID should supply if the plan was carried out with high reproducibility. A global γ-analysis between the reference image and the daily image, with ±3% of the EPID maximum reference signal and ±3 mm distance to agreement over the irradiated area A (defined in equation 1), has been adopted with following pass rates: for the mean γ-value, γmean ≤ 0.5 and for the percentage of points with γ < 1, Pγ < 1 ≥ 95%. The γ-analysis was performed with a cutoff to include only signal values greater than 10% of the maximum EPID signal. However, personalized agreement criteria can be introduced by the user in this DISO module.
In vivo Dosimetry
Thirty patients were treated with 5 or 7 IMRT beams and tested by IVD. The patients, in supine position, were treated with doses ranging between 40 Gy and 65 Gy, delivered to pelvic lymph nodes and prostate, respectively. For each patient, before the first treatment session, 2 square megavoltage beams were used at 0° and 90° gantry angles to obtain setup images to be compared with the corresponding digitally reconstructed radiograph (DRR) images, obtained by the TPS. Once a good match between the square megavoltage and the DRR images was reached, some tattoos were marked on patient, and the portal images (one for each IMRT beam) collected on the first fraction therapy were selected as reference 2D-EPID images for the γ-analysis, if the corresponding R ratios by the central macropixel (Equation 8) were within the tolerance level 0.95 and 1.05. The patient setup in the successive fractions was checked by the comparison between the DRRs and the EPID images obtained before the treatment. In these cases, the patients were treated only if the relative dislocations of the bone markers were within ±3 mm along the 3 spatial directions. For this reason, the computation of the R ratio was carried out in the central macropixel and in other 8 macropixels, around the central one. In particular, by the 9 macropixels (in a region of about ± 3 mm at the SAD), the R value closer to 1 was selected for assessing the compliance with the acceptance criteria 0.950 ≤ R ≤ 1.050. For every patient, 5 tests for each treatment field were carried out, resulting in a total of 900 R ratios and 750 γ-analysis. In particular, the R and γ-analysis tests were carried out in the first 3 fractions to verify the presence of systematic discrepancies and successively 2 tests in the other weeks.
Results
The Parameters for the Reconstruction of Diso Algorithm
The FI index of the 24 simulated IMRT beams ranged between 0.4 and 2.0. Variations in kF (w, L, FI) within ±0.4% (ie, within the measurement reproducibility) were observed for the 3 different 6-MV beams used in this work, and Figure 3 reports the average ratios kF (w = 22,L,FI) by Equation 3 for the IMRT beams (Table 1), with L = 6, 10, 14, and 16 cm. The variations for these ratios as a function of the FI index are the result of the different contributions of the scattered photon components both at the SP mid-plane and at the EPID.

kF (w, L, FI) ratios (Equation 4) as a function of FI index, obtained using the simulated 6-MV IMRT beams (Table 2) with a SP = 22 cm thick and different basic square field L (Figure 1). The data were fitted with linear functions shown in the graph for FI < 1, for FI ≥ 1, and for KF = 1. FI indicates fluence inhomogeneity; IMRT, intensity-modulated radiotherapy.
Figure 4 reports the kf (w = 22 cm, L = 10 cm, d, FI) ratios (Equation 5) determined as a function of FI. For d equal to ±3 cm and ±5 cm, the ratios varied within ±2%, and for the 3 linacs, the ratios resulted the same within the measurement reproducibility (±0.5%). This means that the data reported in Figure 4 are the averaged values.

kf (w = 22, L = 10, d, FI) ratios (Equation 6) obtained for the 6-MV IMRT beams for different d values. The data were fitted with quadratic functions shown in the graph. FI indicates fluence inhomogeneity; IMRT, intensity-modulated radiotherapy.
Figure 5 reports the TMRM (δ, L = 16, FI) obtained by Equation 6, measured in SP irradiated with some simulated IMRT beams with L = 16 cm and characterized by the FI index equal to 0.5, 1.0, and 2.0.

Tissue maximum ratio for intensity-modulated beam (TMRM; δ, L = 16, FI) ratios (Equation 6), measured in solid water phantom (SP; w = 42 cm) irradiated with simulated IMRT beams (L = 16 cm) and characterized by different FI indices. The data were fitted with quadratic functions shown in the graph. FI indicates fluence inhomogeneity; IMRT indicates intensity-modulated radiotherapy.
The ratios kF and kf and TMRM were fitted by polynomial functions that supplied differences between experimental and computed values within the uncertainty of the experimental data.
In vivo Dosimetry
The FI index of the IMRT prostate beams ranged between 0.6 and 1.7, while the equivalent square size ranged between 13 and 15 cm. Figures 6 and 7 report an example of the IVD results for an IMRT beam at 0° as displayed in 2 areas on the left and right of a computer screen view. Figure 6 shows the R results as follows: (A) the patient CT slice with the isocenter point crossed by 7 BCAs, the CT image can be oriented to have the given BCA in vertical position, useful to read the EPID in-plane signal profiles below (C), obtained on different days (in this case with the gantry at 0°); (B) the top-right area allows to correct possible EPID shifts (up to 1mm) between the MLC and the EPID image, and (D) the 5 R ratios obtained on different days, where only the last result R = 1.07 is out of the tolerance levels 0.95 and 1.05, due to an occasional presence of a gas pocket crossed by the BCA.

Results of 5 R tests for an intensity-modulated radiotherapy (IMRT) beam at gantry 0°. (A) The computed tomography (CT) scan oriented to have the beam central axis (BCA) in vertical direction; this allows to examine (B) the area for the multileaf collimator (MLC) and EPID image matching; (C) the in-plane EPID signal profiles, in particular the first R value (red) of the reference image and the last R value (blue) and (D) the R ratio results referred to the tolerance levels 0.95 and 1.05. EPID indicates electronic portal imaging device [Color version of the figure available online].

Results of γ-analysis. (A) Reference 2D-EPID image, (B) current 2D-EPID image, (C) map of points with γ > 1, (D) comparison of in-plane relative signal profiles for image a (red) and image b (blue), and (E) summary of the indices Pγ < 1 and γmean, obtained with agreement criteria 3% and 3 mm.
About 10% of the R tests were out of tolerance levels, essentially because of the presence of gas pockets. When large areas of gas were present in the planning CT scan, in particular along the BCA, R values lesser than 0.95 were observed in the tests due to a replacement of the gas bubble with tissue. In order to account for this problem, a new CT scan was carried out for 1 patient with a very large gas pocket on the CT scan used for planning and a new plan was adopted. On the contrary, values of R > 1.05 were observed due to occasional presence of gas on the BCA, (as the fifth result reported in Figure 6), while the CT scans used for planning were free of gas pockets. However, the average R ratio for all the 900 tests resulted equal to 1.002 ± 0.056 (2 standard deviation), while the average R value obtained for each single patient (considering all the tests of the fields) was well within 5%.
Figure 7 shows the γ-analysis result associated at the R test reported in Figure 6, as follows: (A) the reference 2D-EPID image, (B) a current EPID image, and (C) the map of points where γ > 1. In this case, the map reports the points well concentrated, characteristic of a localized morphological change due to a gas pocket. The presence of a gas region was verified by the 2 square megavoltage beams (0° and 90°) obtained before the treatment to check the patient setup (see In vivo dosimetry section). The position of the crosses reported in (a) and (b) can be shifted in off-axis positions obtaining the normalized signal profiles (d), useful to estimate the percentage of overdosage or underdosage in the areas where γ > 1. For the IVD test reported here, examining the γ-analysis for gantry angles at 100° or 300°, the gas pocket resulted before the isocenter point irradiated at gantry angle 0°, justifying the overdosage values R = 1.07, well evident also in the Figure 7D. In the same test, a false overdosage was observed also at gantry 200°, but in this case, the gas pocket resulted behind the isocenter point and the corresponding R value was not scheduled. Finally the Pγ < 1 and γmean values are reported in a box (e).
Ninety percent of the 750 Pγ < 1 tests resulted in values Pγ < 1 ≥ 95% and values γmean ≤ 0.5, while 10% of tests gave Pγ < 1 values ranging between 75% and 94%, with γmean <0.9. These last results were essentially due to the presence of gas areas, confirmed by (1) the concentrated map of points with γ > 1 (Figure 7C) and (2) the comparison between the normalized signal profiles (Figure 7D) that supplied indication of dose variations up to 10%.
Only 1 patient supplied (for all the fields) systematic R values ranging between 1.08 and 1.10 together with Pγ < 1 values between 75% and 87% and γmean values between 0.7 and 0.9. In these cases, the points with γ > 1 were uniformly distributed in all beam areas. The results obtained in quasi real time in proximity of the linac allowed to carry out, at the end of treatment, a comparison between new megavoltage beams at 0° and 90° gantry angles and the corresponding DRR images. The cause was a craniocaudal shift of the patient setup up to 1 cm. Once the patient setup was corrected, the successive tests supplied the indices within the tolerance levels.
Five occasional interruptions of beams were observed and the MU delivery completed, all the IVD tests confirmed the indices R and γ-analysis within the tolerance levels at the end of the treatment completion. The data reported in Figures 6 and 7 were obtained at the end of the treatment fraction in about 2 minutes needed mostly for the data transfer from the EPID. The software supplies a final patient form with the results of the index R, Pγ < 1, and γmean determined for all the tests and the global average values.
Discussion
Presently, some IVD procedures supply information in terms of 2D or 3D dose distributions in the patient, but these procedures are time consuming and they require a major effort for the staff involved. However, all the current IVD methods yield estimates of dose differences, if some error is present, because the more complex procedures make use of the reference CT scans (used for the planning) and no more actuals to reconstruct the X-ray fluence for dose reconstruction. In the future, an increased use of cone-beam CT imaging will provide daily 3D images, assuring more accurate conditions 37 while again being more time consuming.
As reported by Mijnheer et al, 10 one of the reasons for the limited routine application of IVD is the workload involved in this procedure, and another reason is the confidence of the physicist in quality control methods as the pretreatment tests. 34 –36 Nowadays pretreatment tests can identify many potential errors in dose calculation and data transfer, but it is the opinion of the present and other authors 2 that all treatments with curative intent should be verified through IVD measurements, replacing the pretreatment verification with the in vivo EPID dosimetry.
The aim of this work was to verify the feasibility of a quasi real-time IVD method for Siemens step-and-shoot IMRT beams based on (1) the correlation ratios between the transit signals and the doses in the patient, (2) the γ-analysis of EPID images, and (3) the use of a software interfacing with the R&V system of the center. This preliminary experience, as the one already acquired for the 3D-CRT technique, shows the great utility of obtaining the IVD results in quasi real time and near the linac, where the radiotherapy staff may immediately spot possible errors due to incorrect patient setup 13 or morphological changes that can justify a new or adaptive planning. 20 The IVD procedure is based on an algorithm (Equation 8) that uses the generalized functions, determined by fitting the correlation ratios obtained for the 3D-CRT beams, 19 and introducing the correction factors such as kF (Equation 3) and kf (Equation 5) and the ratios TMRM (Equation 6) determined as a function of the beam complexity index FI. This last index (Equation 1) was formulated using available information about MLC position and MU numbers of each segment, recorded in each DICOM-RT patient file and stored in the R&V system of the centers.
To take into account the patient setup reproducibility (±3 mm) and the high-dose gradients, the ratio R closer to 1 was selected in a region of ± 3mm around the isocenter: This way, once the causes of the dose variations are removed, the average R ratios for all tests of a single patient were well within 5%. Even if the γ-analysis between EPID images is not a 2D dosimetric comparison, we verified that the Pγ < 1 index can be a suitable option to find causes of poor off-axis irradiation reproducibility due to patient setup or morphological variations caused by the presence of gas pockets. However, the present procedure apparently does not provide sufficient accurate information about the different daily contents in hollow organs such as bowels and rectum to give indications of organ motions. Moreover, although the portal images acquired and approved on the first treatment day are suitable options, they can present some disadvantages, since they could be representative of that specific day of treatment. However, in this work, the 5 images of the first therapy fraction were approved as references only after (1) an accurate comparison between the DRR and the megavoltage images (0° and 90°) and (2) an accurate Diso reconstruction at the isocenter point.
In conclusion, by this preliminary experience, the integration of the indices R ratio, within 5%, Pγ < 1 ≥ 95% and γmean ≤ 0.5, supplied very useful information to activate accurate inspections and more adequate IMRT treatment quality controls. However, many efforts are actually needed to select standard tolerance levels for these indices that can be dependent on the pathology and the strategy adopted in the centers. Moreover, to reach this result a major number of tests per patient are needed, and experience in this field has shown that it is possible to investigate how systematic and random dose differences can be obtained by 2D transit signal information. 20,38
Conclusion
The aim of this study was 2-fold. First, the implementation of the IVD procedure for step-and-shoot IMRT was obtained with an easy commissioning for the Siemens linacs equipped with an aSi-EPID. Second, a practical method to supply the IVD results on a computer screen, in quasi real time at the end of the treatment delivery, was also pursued. On the basis of these results, the authors intend to implement the method for other beams qualities supplied by the Siemens linacs.
Footnotes
Authors’ Note
We here certify that regarding this article there are no present or potential conflicts of interest. The work is original and has not been accepted for publication nor is concurrently under consideration elsewhere and will not be published elsewhere without the permission of the Editor and that all the authors have contributed directly to the planning, execution, or analysis of the work reported or to the writing of the article.
Declaration of Conflicting Interests
The author(s) declared no potential conflicts of interest with respect to the research, authorship, and/or publication of this article.
Funding
The author(s) disclosed receipt of the following financial support for the research, authorship, and/or publication of this article: This work was financially supported by the “Istituto Nazionale di Fisica Nucleare” (INFN), project DISO, 2011-2013.