
Abstract
Electrochemotherapy (ECT) is a local anticancer treatment based on the combination of chemotherapy and short, tumor-permeabilizing, voltage pulses delivered using needle electrodes or plate electrodes. The application of ECT to large skin surface tumors is time consuming due to technical limitations of currently available voltage applicators. The availability of large pulse applicators with few and more spaced needle electrodes could be useful in the clinic, since they could allow managing large and spread tumors while limiting the duration and the invasiveness of the procedure. In this article, a grid electrode with 2-cm spaced needles has been studied by means of numerical models. The electroporation efficiency has been assessed on human osteosarcoma cell line MG63 cultured in monolayer. The computational results show the distribution of the electric field in a model of the treated tissue. These results are helpful to evaluate the effect of the needle distance on the electric field distribution. Furthermore, the in vitro tests showed that the grid electrode proposed is suitable to electropore, by a single application, a cell culture covering an area of 55 cm2. In conclusion, our data might represent substantial improvement in ECT in order to achieve a more homogeneous and time-saving treatment, with benefits for patients with cancer.
Introduction
Electrochemotherapy (ECT) is a highly effective local therapy used in the treatment of cutaneous and subcutaneous tumors. 1 This treatment is based on the combination of the electroporation and the administration of a chemotherapeutic drug (bleomycin or cisplatin). Electroporation is a phenomenon due to the exposure of the cell to an external electric field that results in an additional component of the voltage across the cell membrane. This induced transmembrane voltage produces structural rearrangements of the lipids in the membrane bilayer resulting in the formation and stabilization of pores across the membrane. The electroporation permits the transmembrane transport of poorly permeant molecules into cytosol. 2 –11 The cell membrane electroporation is a reversible phenomenon, nevertheless if electric field intensity exceeds a certain electroporation threshold, the cell membrane can be irreversibly damaged finally leading to cell death. 12 –14 The ECT is currently used in clinical practice to treat melanoma, locally advanced and metastatic soft tissue sarcomas, and chest wall recurrence from breast cancer. 15 –17
In clinic, the standard application of ECT requires that electric fields are applied to the tumor by means of electrodes. Several kinds of needle electrodes are commonly used, depending on the anatomical area to treat. One of the most used electrode is the 7-needle electrode, 18 –20 in which the needles are arranged on the vertices and in the center of a hexagonal that covers an area of 1 to 2 cm2. In order to treat larger body surface, up to tens of cm2, in our previous study a grid electrode has been proposed. 21 In the last years, new designs of larger electrodes, including arrays of parallel needles or composition of triangular configurations, mounted on rigid support and used to cover larger surfaces, have been presented. 22 –24 A different approach has been proposed in the grid electrode: the design of a prototype of grid electrode including a solution for its connection to a voltage pulse generator and the evaluation of its electroporation efficiency in a cellular model has been reported in 21. With this solution detailed in the previous study, 21 an area of some tens of cm2 can be treated by means of a grid of equispaced needle electrodes suitably supplied in order to limit the treatment time. In the first design of grid electrode, 21 needles have been positioned at the vertex of adjacent equilateral triangles with a distance of 1 cm among them.
The goal of this study is to analyze the electroporation efficiency of a grid electrode with a lower number of needles and a larger distance among them (13 needles placed at 2 cm distance between each pair of needles instead of 54 needles at 1 cm) than the configuration previously tested, 21 in order to propose a more suitable and tolerated grid electrode for clinical use. To this aim, a multidisciplinary approach has been used to evaluate the electroporation efficiency of the grid electrode: numerical models, which use finite elements method to solve electromagnetic problems and in vitro tests based on a cellular model. A computational model including 2 needles has been proposed in order to study the effect of the needle distance on the electric field distribution. The aim of the 2-needle simplified model is to compare the electric field generated by means of 2 needles placed at a distance of 2 cm with the one generated by needles at a distance of 1 cm. Furthermore, a more complex model, including more needle pairs, has been used to evaluate the effect due to the parallel supplying of more needle pairs. In this case, the intensity of the electric field that appears between non-adjacent needles has been evaluated. Finally, in order to verify the numerical results, experiments of electroporation on human osteosarcoma cell line have been performed. 25
Materials and Methods
Numerical computation and in vitro tests have been used to evaluate the electric field generated by the grid electrode with needles distant 2 cm. The electric field intensity has been verified first considering the effect of the needles’ distance taking into account a single needle pair. The experimental tests on cell cultures evaluated the electroporation efficiency obtained using both a single needle pair with a distance of 2 cm and the whole grid electrode.
Experimental Device
The prototype of the grid electrode is a plastic disc with a diameter of 8 cm where some stainless steel needle electrodes have been implanted. In Figure 1, 2 models of grid electrode are shown: the model A has 54 needles with a distance d between 2 needles of 1 cm, whereas the model B has 13 needles with a distance d of 2 cm. Needles are 1.2 cm long with a diameter of 0.5 mm and a tip diameter of 0.2 mm for both the models. Model A has been previously tested and results have been reported in 21.

The prototype of grid electrode with d = 1 cm (A) and d = 2 cm (B).
The needles have been suitably connected to a voltage pulse generator in order to supply all the possible pairs of adjacent needles one at time. Some corresponding pairs are parallel connected, as proposed in Ref 21, in order to reduce the treatment time.
Computational Model
Numerical model has been used to evaluate both the effect of needle distance and the effect of multiple needle pairs supplied at the same time as a function of electric field intensity in a tissue model. At first, the numerical analysis has been performed using a simple simulation 2-needle model to evaluate the effect of needle distance in terms of the electric field intensity generated. A more complex model, that includes more needle pairs, has been used to evaluate the electric field distribution that appears between non-adjacent needle pairs.
At first, the effect of the needle distance has been studied by means of a 3-dimensional numerical model of a needle pair using finite element analysis. 26 These types of models have been already proposed by some research groups in the past. 2,27 –31 A simple model of needles inserted in homogeneous tissue was proposed previously. 2,18,27 –29,31 –35
Figure 2 shows the model geometry, a parallelepiped (eg, sizes 5 × 3.5 × 3.5 cm3) with 2 cylinders that simulate the stainless steel needles, 1.2 cm long and 0.5 mm diameter. The gray parallelepiped represents a homogeneous material characterized by the electrical resistivity of the tissue in this example is 5 Ωm (conductivity of 0.2 S/m). Some values of the resistivity of biological tissues have been previously reported.
27,36
In order to evaluate the electric field intensity generated by means of a couple of needles, a static conduction problem has been solved imposing a constant electric voltage, equal and opposite in sign, on the surface of the 2 needles (V1 = Va/2 and V2 = −Va/2, Va = 1000 or 2000 V).
37
The applied voltage corresponds to the maximum voltage of the rectangular pulse generated by the pulse generator device (rectangular pulses with a period of 10 ms [frequency 100 Hz] and a pulse length of 100 µs) between 0 V and V (V). The following boundary value problem is solved on electric scalar potential, V
26,27,37
–39
:


Problem geometry of numerical model: a parallelepiped representing the tissue where 2 needles are implanted.
Finally, the effect of parallel connection of more needle pairs has been studied using the model in Figure 3. This figure shows a set of needles suitably placed in order to form an equispaced grid where more needle pairs have been parallel supplied. For instance, for the pairs evidenced with the continuous line, the applied voltage to each needle of the pair has been indicated. It is evident that a voltage difference between the needle pairs evidenced with the dotted line also exists. This voltage difference generates an electric field between non-adjacent needle pairs. The secondary electric field has lower intensity than the one between adjacent needles because the distance between the needles is double and the applied voltage difference is the same. In Figure 3, it can be noticed that other needle pairs, not highlighted with lines, have the same voltage difference V2 − V1. For these needle pairs, the distance is larger than the ones of the pairs pointed out in Figure 3, and the contribution to the electric field is lower.

Problem geometry of numerical model: grid of needle electrodes were 5-needle pair parallel supplied are evidenced by continuous lines. Dotted lines show not-adjacent needles when a voltage difference occurs.
In Vitro Experimental Tests
In vitro experimental tests have been performed on human osteosarcoma cell line MG63 cultured in monolayer. 25,40 The new grid electrode, with 2 cm equispaced needles, developed at the Industrial Engineering Department of Padova University, Italy, was connected to a voltage pulses generator designed by Igea S.p.A. (Carpi, Modena, Italy). 19,41 This voltage pulse generator produced rectangular pulses between 0 and Va, where Va is determined using Equation 3 and varies between 700 and 3000 V. Named E1 and E2 the needles of a pair, the equipment allows to generate a sequence of a minimum 10 pulses imposing zero voltage to the needle E1 and the voltage Va to the needle E2. It is well known that membrane electropermeabilization is affected by the number of pulses delivered, and in clinical practice, 8 pulses are applied during ECT. 25,42 The voltage pulse generator used in this study provides packets of not less than 10 pulses and this minimum number cannot be modified. 19,20
Cell Maintenance and Electroporation Procedure
All the experiments were carried out on human osteosarcoma cell line MG63 (obtained by American Type Culture Collection, Manassas, Virginia). MG63 cells were cultured in Dulbecco modified Eagle medium containing 2% glutamine supplemented with 10% fetal bovine serum, 2% penicillin and streptomycin at 37°C, and 5% CO2 (all cell culture products were purchased by Life Technologies, Paisley, United Kingdom). Twenty-four hours before the electroporation procedure, MG63 cells were plated in Petri dishes (cell growth area approximately 55 cm2; Iwaki Asahi Techno Glass, Japan) at nearly 100% confluence (4 × 10⁴ cells/cm2). Immediately before the delivery of voltage pulses, the growth medium was replaced with the electroporation buffer (10 mmol/L K2HPO4/KH2PO4, 1 mmol/L MgCl2, and 250 mmol/L sucrose pH 7.4) containing 30 µmol/L of the fluorescent dyes propidium iodide (PI; Sigma, St Louis, Missouri), which cannot permeate the cell membrane and is generally excluded from viable cells.
In the cell culture, to detect electroporated cells and to discriminate among them reversibly and irreversibly electroporated cells, the fluorescent dyes PI and Calcein blue AM (CB) were used, as described in previous studies. 21,25 The double staining of the cells with PI and CB and their visualization under fluorescence microscopy provided precise information about the extent and localization of the electroporation around and between the needle electrodes. Moreover, it gives information about the induction of reversible or irreversible electroporation. Specifically, among the electroporated cells (which appeared red with fluorescence microscopy, because it is positive to PI), it has been possible to discriminate between viable cells (ie, exposed to reversible electroporation, which appeared blue because it is positive to CB) from those dead (ie, exposed to irreversible electroporation, which do not appear blue colored because it is negative to CB). 21,25
Voltage pulses (10 rectangular pulses with an amplitude of 2000 V, a pulse period of 10 ms, a pulse length of 100 µs, and a repetition frequency of 100 Hz 20,43,44 ) were delivered to the cells by means of the model B of grid electrode (Figure 2B) which was connected to the pulse generator. After pulse delivery, the cells were maintained in the same position for 2 minutes at room temperature to avoid any mechanical stress for the cells. Then, the electroporation buffer was discharged, and CB was added to the culture plates as previously described. 21 The cells were then observed under fluorescence microscopy.
Fluorescence Microscopy
Fluorescence has been visualized using the Nikon Eclipse TE 2000-E microscope (Nikon Instruments Spa, Sesto Fiorentino, Italy) equipped with a digital camera (DXM 1200F; Nikon Instruments Spa). Three images (phase contrast, red, and blue fluorescence) were captured for each observed field. The images were captured under 40× objective magnification.
To evaluate the electroporation efficiency as a function of the distance from the needles, the fluorescence intensity of cells stained with PI was obtained by extracting the red component from digitally acquired RGB images, using image processing and analysis program ImageJ (National Institutes of Health, Bethesda, Maryland, USA). 45
The distance of electroporation, defined as the distance from a specific needle of the electrode at which at least 70% of cells were electroporated, is referred as mean ± standard deviation. The experiments have been repeated at least 3 times.
Potato Tissue Test
In order to verify the electroporation effects of the electrode with d = 2 cm in the depth of the tissue, a preliminary and only qualitative test has been performed in potato tissue. In fact, it is well known that just after the application of voltage pulses, the treated tissue appears dark. 21,46,47
Potatoes were electroporated using the 2 electrodes in Figure 1 applying a sequence of 10 voltage pulses at each possible electrode pair. In particular, for the electrode with d = 1 cm, the applied voltage difference was 1000 V, whereas for the one with d = 2 cm was 2000 V. Potato tissue electroporated and not electroporated has been preserved at room temperature and has been observed 24 hours after the treatment. The potato treated by means of voltage pulses appears dark only in the electroporated area, whereas any color change did not occur exposed at room temperature for 24 hours the not-electroporated sample, indicating that the dark color is due to the electroporation and not to the cut.
Results
Results obtained using numerical models and experimental setup have been presented here.
Simulation Results
The electric field intensity has been computed considering the following two different needles and voltage configurations:
d = 1 cm, Va = 1000 V. d = 2 cm, Va = 2000 V.
Figure 4 reports the color maps of electric field intensity obtained supplying a couple of needles with a distance d equal to 1 or 2 cm according to the voltage of the configurations (a) and (b). It is to note that the colored scale is the same. The distance reported in Figure 4 evidence that in the case of d = 2 cm, the surface covered by the same electric field intensity with respect to the case of needles with d = 1 cm is larger.
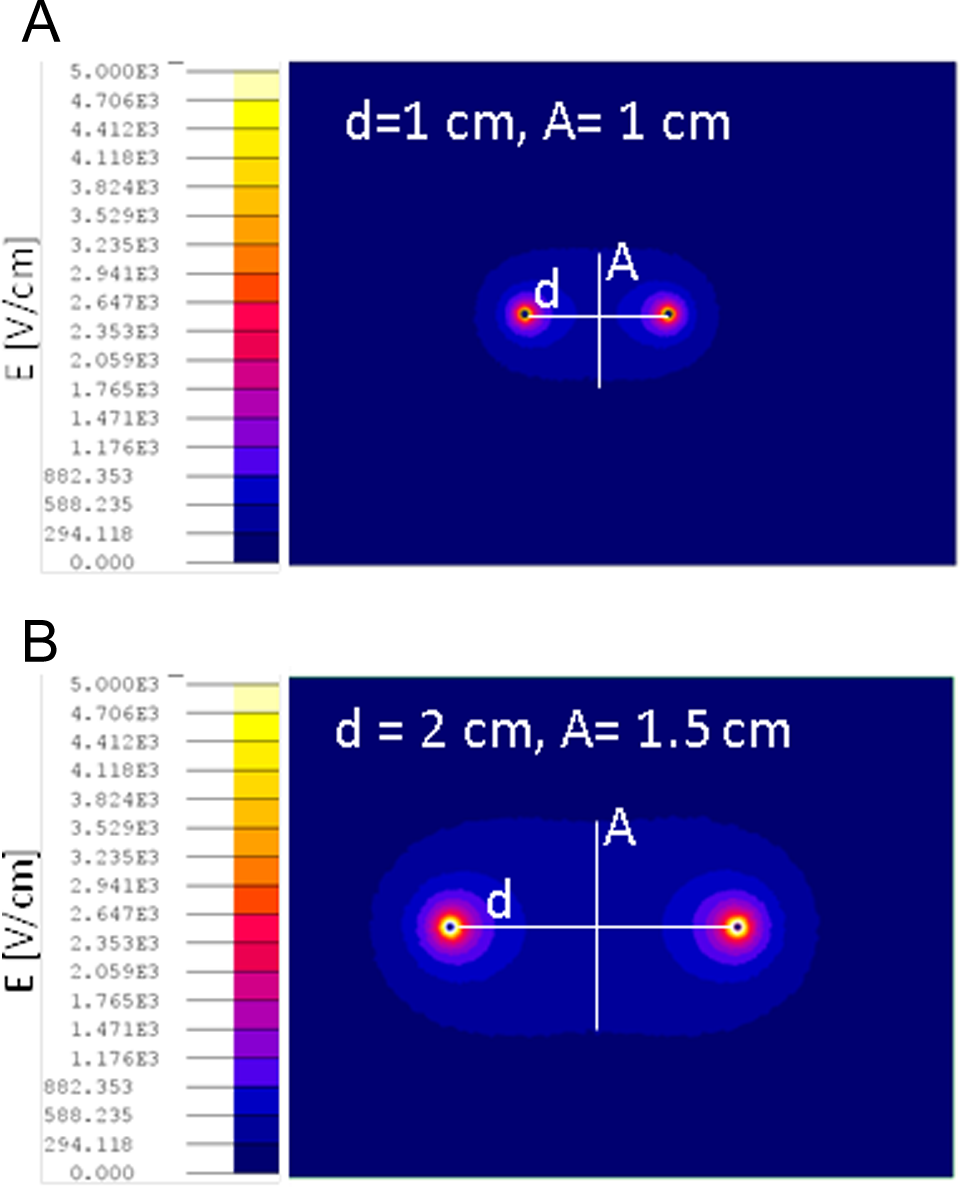
Colored maps of electric field intensity for a needle pair supply according to the cases (A) d = 1 cm, Va = 1000 V and (B) d = 2 cm, Va = 2000 V. d = distance of the needles, A = length of the line A. The size of the line A “measures” the amplitude of the electric field in the center of the needles pair (the color scale is the same in both figures).
Given the problem symmetry, the electric field sampled along some parallel lines (A, B, and E) are shown in Figure 5A. Figure 6A to C show the electric field generated by 2 needle pairs, one with the distance d between the needles of 1 cm and the other one with the distance of 2 cm. It can be pointed out that:
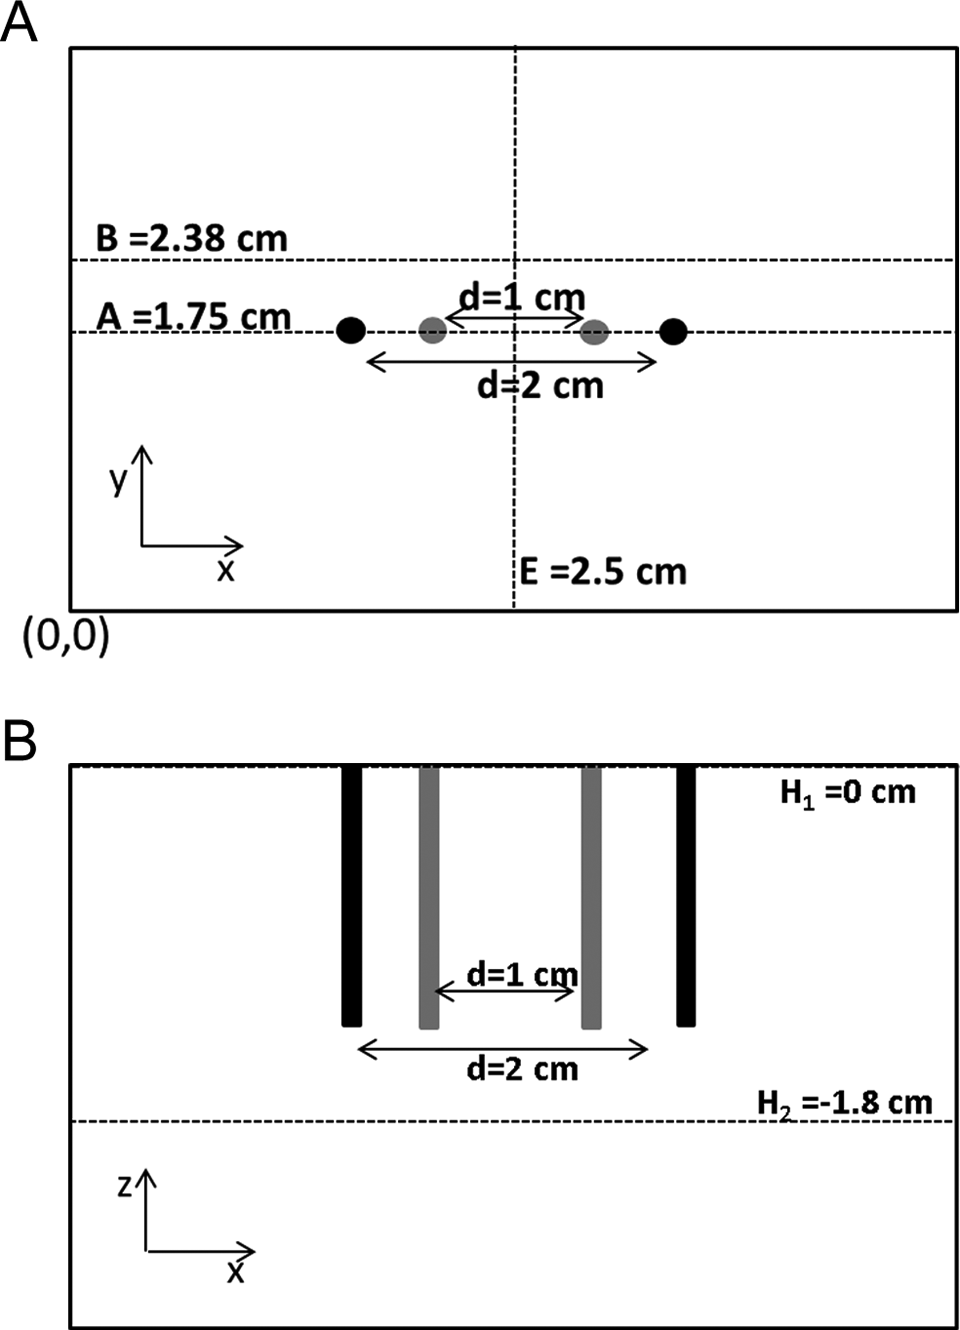
Schematic of lines where the electric field has been sampled. A, Horizontal layer and (B) vertical layer (figures not in scale).

Electric field sampled at depth H1 along lines (A) A, (B) B and at depth H2 along lines (C) A and (D) B.
in the center of the whole system, in the crossing point of lines A and E, at depth H1 (on the surface), the electric field intensity produced by the needle pair with d = 1 cm is higher than the one generated for d = 2 cm (Figure 6A). In this point the difference in electric field is 100 V/cm;
along line A at depth H1, the electric field intensity close to the needle is higher when d is 2 cm. The same behavior has been seen also along line B (Figure 6B);
along lines A and B at depth H2 (18 mm), the field generated by the pair with d = 2 cm is always greater than the one generated by the needle pair with d = 1 cm (Figure 6C and D).
Figure 7 shows the field intensity as a function of the y-coordinate along line E in Figure 5A. The electric field values are evaluated for the 2 examined cases at the depth H1 and H2 reported in Figure 5B. It can be noted that the electric field intensity at depth H1 (Figure 7A) is higher than at depth H2 (Figure 7B) for y between 1.61 and 1.89 cm, whereas outside this range the electric field intensity is lower. Considering the needle pair with d = 2 cm at depth H2 (z = 1.8 cm), the electric field intensity is higher than the one generated by the needle pair with d = 1 cm (Figure 7B).

Electric field sampled along the line E in Figure 5A at the depth (A) H1 and (B) H2.
The numerical results suggest that with a needle distance d = 2 cm supplied at 2000 V, the electric field distribution in the middle of needle pairs is comparable to the one obtained using a needle pair with d = 1 cm supplied at 1000 V. These results show that the grid electrode with d = 2 cm can be suitable for the electroporation of cell membranes.
Finally, Figure 8 reports the colored map of the electric field intensity obtained supply in parallel 5 needle pairs as evidenced in Figure 3. An electric field with lower intensity than the one between adjacent couples of needles appears between needle pair placed in the area evidenced by dotted lines in Figure 3.

Colored maps of electric field intensity generated by 5-needle pairs parallel supplied.
Experimental Results
In this section, in vitro experimental results obtained using the model B electrode prototypes of the grid electrode are presented. The tests on MG63 cells are concerning the experimental conditions d = 2 cm and V = 2000 V.
We have analyzed the effect of electroporation in 2 different contexts: when only 1 pair of needles has been supplied (Figure 9) and when all the pairs of needles have been sequentially supplied (Figures 10 and 11). In both the conditions investigated, the cell density was the same (4 × 10⁴ cells/cm2).

Effect of electroporation on MG63 cells obtained by using the electrode in Figure 1B in which only needles 1 and 4 were activated (as shown in the scheme on the left). The panel shows the microscope images captured in the area included between the needle 1 up to the needle 4. The red fluorescence indicates cells positive to PI (cells electroporated); blue fluorescence indicates cells positive to Calcein blue (CB; cells viable); contrast phase images (grey) show the position of needle 1 and 4 in the cell culture. The graph shows the PI fluorescence intensity profile corresponding to the purple line inserted in the panel. PI indicates propidium iodide.

A, Direction along which the cell culture has been examined between needles 1-A up to the end of the Petri. B, Effect of electroporation on MG63 cells obtained by using the electrode in Figure 1B in which all the needles pairs were sequentially activated. The panels show the microscope images captured in the area included in the direction between needles 1 and A up to the end of the Petri, as indicated in the schema in (A). The red fluorescence indicates cells positive to PI; blue fluorescence indicates cells positive to Calcein blue (CB); and contrast phase images (grey) show the position of needles 1 and needle A in the cell culture. The graphs show the PI fluorescence intensity profile corresponding to the purple line inserted in the panel. PI indicates propidium iodide.
Effects of 2 Needles on Cell Electroporation
In the first experimental condition, when only the needles 1 and 4 of the model B grid electrode were activated, cells around and between the 2 needles resulted in positive PI staining, indicating that electroporation occurred. Specifically, the distance of electroporation from the needle 1 toward needle 4 at which we observed at least the 70% of cells positive to PI was 3.74 ± 0.40 mm and the distance of electroporation from needle 4 toward needle 1 was 10.53 ± 1.17 mm. This result was confirmed also by the analysis of fluorescence intensity of PI obtained by ImageJ, 45 calculated on a hypothetical line crossing the needles 1 and 4, as reported in Figure 9.
Calcein blue images show that except for a limited region around needle 4 (3.93 ± 0.92 mm from the needle 4 toward needle 1), all the cells electroporated were viable, indicating that a mainly reversible electroporation of the cells was obtained. The difference in the amplitude of irreversible electroporation, as it appears in Figure 9, could be due to a positive voltage applied to needle 4 and a zero voltage applied to needle 1. In particular, the dark area in blue images is larger around the positive electrode.
Effects of More Needles on Cell Electroporation
In the second experimental condition, when all the pairs of needles have been sequentially supplied, all cells were positive to PI staining, suggesting that electroporation affected the whole cell culture in the Petri dish (Figure 11B). In particular, in the cells located under and around each needle, the fluorescence intensity of PI increased and correspondingly, in the same cells, a reduction in positivity to CB was observed (Figure 11B). This indicated that in the region around each needle, irreversible electroporation occurred. Compared with the previous experimental condition (only 1 pair of needles activated), in this case, we observed a greater region of irreversible electroporation around the needles (9.36 ± 0.87 mm near to the needle 4 of the electrode and 3.51 ± 0.65 mm near to needle 1). Similar to what is observed in Figure 9, a difference between the amplitude of the area of irreversible electroporation around the positive and negative needle is evidenced (ie, a positive voltage applied to needle 4 and a zero voltage applied to needle 1).

A, Direction along which the cell culture has been examined between needles 1 and 4 up to the end of the Petri dish. B, Effect of electroporation on MG63 cells obtained by using the electrode in Figure 1B in which all the needles pairs were sequentially activated. The panels show the microscope images captured in the area included in the direction between needles 1 and 4 up to the end of the Petri dish. The red fluorescence indicates cells positive to PI; blue fluorescence indicates cells positive to Calcein blue (CB); and contrast phase images (grey) show the position of needle 1 and 4 in the cell culture. The graphs show the PI fluorescence intensity profile corresponding to the purple line inserted in the panel. PI indicates propidium iodide.
This could be probably due to the sequential activation of all the needle pairs. Figures 10B and 11B show the images captured from the central electrode (needle 1) and moving toward the bottom edge (Figure 11A) or toward the right edge (Figure 10A) of the Petri dish. These results indicated first that the grid electrode (d = 2 cm) supplied at 2000 V is able to electropore the whole cell culture in the Petri dish (55 cm2). Second, the electroporation is reversible except for the region around the needles, where the cell membranes are irreversibly electroporated and the cells are dead.
We have also observed on the cells the effect of the electroporation when 2 needle pairs not adjacent were supplied as shown in Figure 12A. Specifically, we have investigated the region between the 2 pairs of needles and Figure 12B shows the images captured along the diagonal direction evidenced by the arrow in Figure 12A. In Figure 12B, the effect of the parallel supplying 2 needle pairs is shown (needles supplied as in Figure 12A) and evidenced in the red intensity graph. These results indicate that the electroporation generated by 2 distant needle pairs supplied in parallel decreases dependently from the distance between the needle pairs.

A, Direction along which the cell culture has been examined between needles 2 and 5. B, The images of a cell culture examined along the diagonal direction indicated by arrow from needle 1 to needle 5 in (A) show the effect of electroporation on MG63 cells obtained by using the electrode in Figure 1B in which 2 couples of needles, named C1 and C2, are supplied in parallel as reported in the schema in (A). The panels show the microscope images captured in the area included along the direction investigated. The red fluorescence indicates cells positive to PI; blue fluorescence indicates cells positive to Calcein blue (CB). The graphs show the PI fluorescence intensity profile along the purple line inserted in the panel. PI indicates propidium iodide.
Effect on the Depth Using Potato Model
A photograph of a potato not-electroporated (control) shown after 24 hours is in Figure 13A. In Figure 13B and C, the photographs of the vertical sections of the 2 potatoes treated using the 2 electrodes in Figure 1 are shown. In all the cases, the tissue is dark in the electroporation area. The ruler indicates the length of the needles (1.2 cm), and it can be observed that the dark color covers an area wider than the needle length in the case of the grid electrode with needles distance d = 2 cm (in Figure 1B). Differently, the dark area produced by the grid electrode with needles distance d = 1 cm (in Figure 1A) extends itself until the needle length. In particular, it is to be noted that in the case of the electrode with d = 1 cm, supplied at 1000 V, the electroporation depth is 1.2 cm (Figure 13B), whereas for the electrode with d = 2 cm, supplied at 2000 V, the depth of electroporation is 1.8 cm (Figure 13C). This is in agreement with the simulation results for which the electric field produced by a needle pair with d = 2 cm is higher than the one produced for d = 1 cm, with a depth greater than the needle length.

A, Potato tissue not electroporated after 24 hours. Effect of 10 V pulses on potatoes using the following 2 different electrodes: (B) electrode in Figure 1A supplied at 1000 V shows an electroporation depth of 1.2 cm and (C) electrode in Figure 1B supplied at 2000 V shows an electroporation depth of 1.8 cm.
The test on potatoes tissue allows evaluating whether the electroporation occurred in the area of coverage, although it cannot discriminate between reversible or irreversible electroporation. Moreover, the obtained results are limited for the difference in tissue in terms of electroporation threshold. Potato cells have a different electroporation electric field threshold with respect to animal cells. Nevertheless, this simple test allows a simple visualization of the effect in the depth of a needle distance d = 1 cm or d = 2 cm as well as it has been evidenced in simulation.
Discussion
In this study, we have used a multidisciplinary approach to evaluate, from a numerical model and from a biological viewpoint, the electroporation efficacy obtained delivering voltage pulses by means a grid electrode with a new disposition of the needles compared with the one previously tested. 21 The main clinical advantages that can be obtained using a grid electrode with needles distant 2 cm are the reduction in the number of needles per cm2 to insert in the patient and the possibility to cover larger body surfaces without displacing manually the electrode. This aspect is very important in clinical application since it allows reducing the total treatment time.
Computational results allow predicting the effect of needle distance in terms of the intensity of the electric field. The simplified 2-needle model can be useful to predict the electric field intensity distribution in a homogeneous tissue. The more complex model, which includes more needles pairs that can be supplied in parallel, is able to show the interaction between non-adjacent needle pairs activated at the same time.
The results obtained from the simplified computational model show that the electric field intensity generated by needle pairs with greater interneedles distance and higher applied voltage difference (2 cm and 2000 V) is stronger in the proximity of needles compared with the electric field intensity generated by a couple of needles with smaller distance and voltage drop (d = 1 cm and 1000 V). Moreover, results indicate that using needle pairs with d = 2 cm, the electric field intensity covers a larger surface and a reaches a greater depth. In fact, the area with the same intensity of electric field is larger in the case of needle with d = 2 cm (see Figures 4, 6, and 7) with reference to the case with d = 1 cm.
The numerical models developed in this study can predict the electric field intensity in homogeneous tissues when a voltage difference is applied between a needle pair. However, the electroporation effect occurring in the cells or in the tissues depends on cell characteristics because cells have different conductivity, shape, orientation, size, and electroporation threshold. 27,48 –52 Other authors have proposed numerical models that take into account the electrical properties of the tissue as a function of the local electric field. 27,51,52 Nevertheless, in this work, simulation results are useful to characterize and compare different electrodes in terms of distribution of electric field. To this aim, a simple homogeneous model gives adequate information. However, the numerical models presented in this study are not able to predict the effect of cell electroporation. For this reason, in vitro tests were performed to verify and confirm the cells simulation results obtained in the numerical models. Although the cellular monolayer used in in vitro testing analyzed the effects of electroporation at a cellular level, a limitation of this study is the inability to test the electroporation effects in a tissue, where the tridimensional interactions among the cells and between cells and extracellular matrix can be taken into account.
The in vitro results obtained on human MG63 cell line confirm that when all the needle pairs are sequentially activated, the electroporation permeated the whole cell culture in the Petri dish, covering an area of 55 cm2. However, in this condition, the cell culture was homogeneously electroporated with limited regions of irreversible electroporation around the needles. As it has been reported a strong dependence between the cells’ electroporation and the density of the cells, 50,53,54 in our in vitro experiments, we have maintained the same cell density (near to confluence) for all the experimental conditions investigated. In this way, differences in the results were independent from the cell density but due to the different conditions tested. In fact, considering a diameter of 25 to 30 µm for MG-63 cells, 55 the volume fraction of cells 56,57 in monolayer is 0.52 to 0.75 that gives an effective electric field that is 84% to 95% of the applied one. From these data it was determined that by applying 1000 V/cm the transmembrane voltage is 3.15 to 8.56 V. This transmembrane voltage is larger with respect to the typical one to form cell membrane pores 58 (ie, 0.2-1 V).
Therefore, the grid voltage pulses applicator with 2-cm spaced needle electrodes ensures electroporation efficiency, which is comparable to that obtained with the needle electrodes currently used in clinical practice but with the advantage to cover, in each application, a body surface area wider than the one covered by standard electrodes.
The main limit of the proposed numerical models is related to the use of homogeneous electrical properties of tissues without any dependence on the electric field intensity, nevertheless simulation and experimental results are in good agreement. In fact, comparing simulation results with the ones of the in vitro tests, it is confirmed that the area of irreversible electroporation is larger using electrodes with d = 2 cm than electrodes with d = 1 cm. This finding is in accordance with the computed electric field intensity that is higher near the needles for the pair 2 cm distant instead 1 cm (Figures 6A, 9, and 10 and data previously reported in Ref 21).
The new grid electrode potentially allows for the treatment of large, tumor-infiltrated, skin surfaces; while reducing the number of needle insertions into tissue, it limits treatment invasiveness and improves patient tolerability. Interestingly, in order to treat tumor lesions covering a large body surface, the introduction of this new device in the clinical practice could be time saving during an ECT procedure, since it requires a single electrode placement, instead of multiple, juxtaposed, electrode application with conventional, small-size pulse applicators. This, in turn, may allow to better exploit the time interval (ie, 20 minutes, according to standard operative procedures 20 ) of bleomycin distribution into tissues and therefore to achieve higher drug concentration into tumor cells and ultimately to improve tumor response.
Although the results found in this study need to be further validated at tissue level and in more advanced tumor models, if they will be proved suitable, they might represent substantial improvement in clinical application to achieve a more homogeneous and time-saving treatment during ECT, with benefits for patients with cancer.
Footnotes
Acknowledgments
Authors are grateful to Dr Elena Serena and Prof Nicola Elvassore of the Department of Industrial Engineering of Padova University, Italy, for the images at fluorescence microscopy used to test the electrode with d = 2 cm on cells. Moreover, authors are grateful to Dr Fabiana Federica Ferro for simulation results and Dr Mosè Castiello and Dr Francesco Scandola for the realization of the electrodes. Authors are grateful to Igea S.p.A. (Carpi, Modena, Italy), for the loan of the pulse generators used in this study. The research was partially made possible thanks to the networking efforts of the COST TD1104 action (![]() ).
).
Declaration of Conflicting Interests
The author(s) declared no potential conflicts of interest with respect to the research, authorship, and/or publication of this article.
Funding
The author(s) disclosed receipt of the following financial support for the research, authorship, and/or publication of this article: Project granted by CPDA138001 (Padua University).