
Abstract
Electrochemotherapy is an emerging local treatment for the management of superficial tumors and, among these, also chest wall recurrences from breast cancer. Generally, the treatment of this peculiar type of tumor requires the coverage of large skin areas. In these cases, electrochemotherapy treatment by means of standard small size needle electrodes (an array of 0.73 cm spaced needles, which covers an area of 1.5 cm2) is time-consuming and can allow an inhomogeneous coverage of the target area. We have previously designed grid devices suitable for treating an area ranging from 12 to 200 cm2. In this study, we propose different approaches to study advantages and drawbacks of a grid device with needles positioned 2 cm apart. The described approach includes a numerical evaluation to estimate electric field intensity, followed by an experimental quantification of electroporation on a cell culture. The electric field generated in a conductive medium has been studied by means of 3-dimensional numerical models with varying needle pair distance from 1 to 2 cm. In particular, the electric field evaluation shows that the electric field intensity with varying needle distance is comparable in the area in the middle of the 2 electrodes. Differently, near needles, the electric field intensity increases with the increasing electrode distance and supply voltage. The computational results have been correlated with experimental ones obtained in vitro on cell culture. In particular, electroporation effect has been assessed on human breast cancer cell line MCF7, cultured in monolayer. The use of 2-cm distant needles, supplied by 2000 V, produced an electroporation effect in the whole area comprised between the electrodes. Areas of cell culture where reversible and irreversible electroporation occurred were identified under microscope by using fluorescent dyes. The coupling of computation and experimental results could be helpful to evaluate the effect of the needle distance on the electric field intensity in cell cultures in terms of reversible or irreversible electroporation.
Keywords
Introduction
Electrochemotherapy (ECT) is a clinical treatment that acts as local therapy for some superficial types of tumors. It is based on the combination of short voltage pulses delivered by using needle electrodes and a chemotherapy drug. 1 -5 In clinical practice, ECT therapy is applied by means of standard electrodes, 7 needles, with distance of 7.3 mm hexagonally arranged, which applies the electric field in a volume close to 3 cm3 (depending on needle length), following the classical standard protocol for the application of voltage pulses described in the articles by Marty et al and Mir et al. 6,7
Currently, ECT is applied in clinical practice to treat melanoma, skin tumors, and breast cancer recurrences on the chest wall. 1,2,4,6 -8 The ECT therapy is characterized by a little time interval after chemotherapy drug injection in which voltage pulses can be applied effectively. For instance, the standard operative procedures prescribe the voltage pulse application in the 20-minute time interval after the chemotherapy drug (eg, bleomycin) injection. 6,7 Nevertheless, the application of ECT to skin tumors of large surface, for example, 200 cm2, as it can occur in the treatment of breast cancer recurrence on the chest wall, is time-consuming due to the small volume treated by the standard electrode with an area close to 2 cm2 (π·r2 = πċ[0.73 cm]2 = 1.67 cm2). In fact, in current clinical practice, the electrode is time by time placed at different points of body surface until the tumoral region is entirely covered by the electric field. 9,10 For instance, to cover an area of 200 cm2, the electrode has to be moved at least 120 times. 10 The problem of large surface treatment in the classical clinical practice is due to the short time interval in which the drug is available after its injection. This time interval is limited to 20 minutes. Currently, the delivery of a sequence of 96 pulses with a period of 200 microseconds (pulse duration 100 microseconds at 5 kHz 6,7 ), using existing voltage pulse generator, requires at least 20 milliseconds only for pulse delivery. 10 However, at this time, it is necessary to add the time to move electrode, to charge capacitance (eg, 5-6 seconds), and to manually activate discharge, which for each 96-pulse sequence has to be considered at least 20 seconds long. In this way, in order to treat a surface of 200 cm2, the time interval required is at least 40 minutes. 10
The use of pulse applicators with large surface and with few and more spaced needle electrodes could be useful in clinical practice, since they could allow the treatment of large and spread tumors without moving the electrode several times. Moreover, this kind of device can limit the duration of the procedure. 9 -13 For instance, a prototype of a large applicator is the grid surface electrode proposed in rigid and flexible versions in the study by Campana et al, 12,14 foreseeing needle pairs with a distance of 2 cm apart. In this case, 7 needles hexagonally arranged can treat an area of π r2 = π(2 cm)2 = 12.5 cm2. Moreover, in the proposed grid device, some 7-needle groups hexagonally arranged are combined in order to form a grid as in the study by Ongaro et al, Campana et al, and Dughiero et al. 11,12,15 In this case, some needle pairs are parallelly connected in order to be supplied at the same time. Some drawback of the device can be the low needle parallelism of adjacent needles due to the thorax curvature. Nevertheless, considering the application of this device for the breast cancer recurrence on the chest wall, which can require to treat large area and for which the needle penetration is limited by the chest wall, the needles approaching are limited by the needle length that can effectively penetrate into the skin. In fact, this tumor type growth shows a superficial pattern and tissue involvement is limited to the first 4 to 5 mm from the superficial skin layer. Then, needle insertion can be limited to only a few millimeters.
Some prototypes of this device, with 52 needles, 1 cm distance or 13 needles, 2 cm distance organized in hexagons (Figure 1), have been already tested in potato phantom in order to verify qualitatively electroporation feasibility. 12,14 In Figure 1, the triangle substructure has been evidenced.

Geometry of the 8-cm-diameter electrode with 52 needles with distance = 1 cm, 13 needles with distance = 2 cm, and the triangle substructure.
In this work, the effect of a grid electrode with needles at 2 cm distance has been investigated in terms of electric field distribution and cell electroporation in order to purpose a large electrode with a reduced number of needles. Moreover, in vitro test has been performed in order to quantify and compare cell electroporation among the needles at distances of 1 and 2 cm. In addition, since the geometry of the electrode is based on hexagons and each hexagon is the superposition of 6 equilateral triangles (Figure 1), the electroporation in a triangle has been analyzed in in vitro tests.
Materials and Methods
Finite Element Method (FEM) simulation models are used to evaluate the electric field intensity in simplified geometries. In particular, a 2-needle model suitably supplied has been simulated in order to evaluate the electric field intensity with 2 different needle distance. The second model simulates a 3-needle geometry that is a submodel of complete electrodes with a diameter of 8 cm with needles at equilateral triangle vertex. The same geometric configurations with 2 and 3 needles have been analyzed in in vitro tests in order to evaluate the occurrence of the electroporation in all the treated area.
Computation Model
Two simple 3-dimensional (3-D) numerical models including 2 needles or more needles (1.2 cm long, 0.5 mm diameter, and an inter-needle distance, d) inserted in a parallelepiped of homogeneous conductive material have been used to evaluate the electric field intensity as a function of needle distance. The 2-needle model is shown in Figure 2A, 9,16 whereas the more needle models (8 cm diameter) are shown in Figure 1. The electrodes in Figure 1 includes 52 needles with distance d = 1 cm or 13 needles with distance d = 2 cm. In the complete electrode, only 3 needles have been activated, which is highlighted in Figure 1, and the electric field in the triangle has been analyzed in order to evaluate its intensity in the triangle center. The 3 needles have been activated 2 by 2, and 3 different pairs have been considered (needles 1 and 2, needles 1 and 3, and needles 2 and 3).

Three-dimensional (3-D) numerical model for the 2-needle case 9 : (A) problem geometry and (B) electric field intensity sampling line.
Electric field due to a voltage applied between the needles has been computed using finite element analysis as proposed by more research groups. 11,17 -21 The electric field intensity has been computed by means of finite element simulator (Flux 3-D [http://www.cedrat.com/software/flux/] or COMSOL [https://www.comsol.it/]), solving a static conduction problem on electric scalar potential, V, imposing a constant voltage (eg, for needle distance d = 1 cm, the applied voltage is 1000 V, whereas for d = 2 cm, it is 2000 V) on the surface of the 2 needles, 17,22 and considering a conductivity dependent on electric field. 17,23,24

and a tangent condition of electric field lines on the external boundary:

The model for nonlinear conductivity of the sample used for the computation is 24

with σ0 = 0.04 S/m, σ1 = 0.12 S/m, k v = 0.0004 m/V, E th = 11 500 V/m, case 1, 24 or with σ0 = 0.2 S/m, σ1 = 0.8 S/m, k v = 0.0004 m/V, E th = 9000 V/m, case 2 (epidermis 19,25 ). Moreover, for the sake of comparison with previous evaluations (eg, see Ongaro et al 9,11 ), the electric field strength considering a constant conductivity (0.2 S/m) has also been reported. In this evaluation, the needle distance d has been varied in a range of interest for the device (from 1 to 2 cm, including d = 1.5, 1.7, and 1.9 cm) and the applied voltage has been tuned to the more appropriate value as in the study by Ongaro et al. 11
The electric field has been sampled on the parallelepiped surface along the line shown in Figure 2B as in the study by Ongaro et al. 9,11 For the sake of simplification, the proposed model does not consider the effect of the progressive conductivity increment due to successive pulses (effect already described in literature. 16,23,26,27 ) Nevertheless, as the more accurate models, as the ones that consider the electric field variation during electroporation, 17,23,28 it considers the conductivity as a function of the electric field strength. 24
For the sake of comparison with previous analysis (see eg, Ongaro et al 11 ), the percentage difference, Δ%, between the electric field was computed using different coefficients in the model for conductivity described by Equation (3), E(σ(E)), and the one computed considering a constant conductivity, E(σcost):

Experimental Tests
In vitro experimental tests have been performed on human breast cancer cell line MCF7 (American Type Culture Collection, Manassas, Virginia) cultured in monolayer. The needle pairs at a distance of 1 or 2 cm and the triangle with needles at a distance of 2 cm were connected to a voltage pulse generator designed by Igea S.p.A. (Carpi, Italy). 29
At least 3 experiments have been performed for each experimental condition. Data were expressed as mean (standard deviation, SD). Statistical differences between the mean were determined by Student t test. P values <.05 were considered statistically significant.
Cell Maintenance and Electroporation Procedure
MCF7 cells were cultured in Dulbecco’s modified Eagle’s medium: Nutrient Mixture F-12 containing 2% glutamine supplemented with 10% fetal bovine serum, 2% penicillin and streptomycin at 37°C, and 5% CO2 (all cell culture products were purchased from Life Technologies, Paisley, United Kingdom). Twenty-four hours before the electroporation procedure, MCF7 cells were plated in petri dishes (cell growth area approximately 55 cm2; Iwaki Asahi Techno Glass, Shizuoka, Japan) at nearly 100% confluence (1 × 10⁵ cells/cm2). Immediately before the delivery of voltage pulses, the growth medium was replaced with the electroporation buffer (10 mM K2HPO4/KH2PO4, 1 mM MgCl2, and 250 mM sucrose pH 7.4) containing 30 μM of the fluorescent dyes propidium iodide (PI; Sigma, St Louis, Missouri), which cannot permeate the cell membrane and is generally excluded from viable cell.
In the cell culture, to detect electroporated cells and to discriminate among reversibly and irreversibly electroporated cells, the fluorescent dyes PI and calcein blue AM (CB) were used. 11,14,16 The double staining of the cells with PI and CB and their visualization under fluorescence microscopy provided precise information about the extent and localization of the electroporation around and between the needle electrodes and about the induction of reversible or irreversible electroporation. Specifically, among the electroporated cells (which appeared red at fluorescence microscopy, because positive to PI), it has been possible to discriminate between viable cells (ie, exposed to reversible electroporation, which appeared blue because positive to CB) from those dead (ie, irreversible electroporated cells appeared not blue colored because negative to CB). 11,14,16
Voltage pulses (8 rectangular pulses, in 2 sequences of 4 pulses inverting needle polarity, with an amplitude of 1000 V if the needle distance is d = 1 cm and 2000 V if d = 2 cm, a pulse period of 10 milliseconds, a pulse length of 100 microseconds, and a repetition frequency of 100 Hz) 7,30 were delivered to the cells by means of the model B of grid electrode (Figure 2B), which was connected to the pulse generator. In a second series of experiments, the number of pulses was increased at 24, and this condition was tested on needle at a distance 2 cm.
After pulse delivery, the cells were maintained in the same position for 2 minutes at room temperature to avoid any mechanical stress for the cells. Then, the electroporation buffer was discharged, and CB was added to the culture plates as previously described. 14 The cells were then observed under fluorescence microscopy.
Fluorescence Microscopy
Fluorescence has been visualized using the Nikon Eclipse TE 2000-E microscope (Nikon Instruments Spa, Sesto Fiorentino, Italy) equipped with a digital camera (DXM 1200F; Nikon Instruments Spa). Three images (phase-contrast, red and blue fluorescence) under 4× objective magnification were captured for each observed field. The electroporation efficiency has been evaluated as a function of the distance from the needles by the red fluorescence intensity of cells stained with PI, extracting from the RGB images the red component, using ImageJ (available at link https://imagej.nih.gov/ij/). The distance of electroporation, defined as the distance from a specific needle of the electrode at which at least the 80% of cells were electroporated, is referred to as mean value (SD).
The percentage of electroporated cell has been computed processing PI and phase-contrast images at 100× final magnification using ImageJ. The red and black and white images have been superposed. A set of N s squares, for example, N s = 5 squares, in each image has been identified. In each square, all the cells have been identified and counted. It results in the total number of cells, N t, and the number of red cells, N r. The percentage of electroporated cell was the ratio between N r and N t and N r/N t. For each images, N s squares have been processed and the average between the N s ratio N r/N t has been computed as identified as “percentage of electroporated cells” per image.
Results
Computation Results
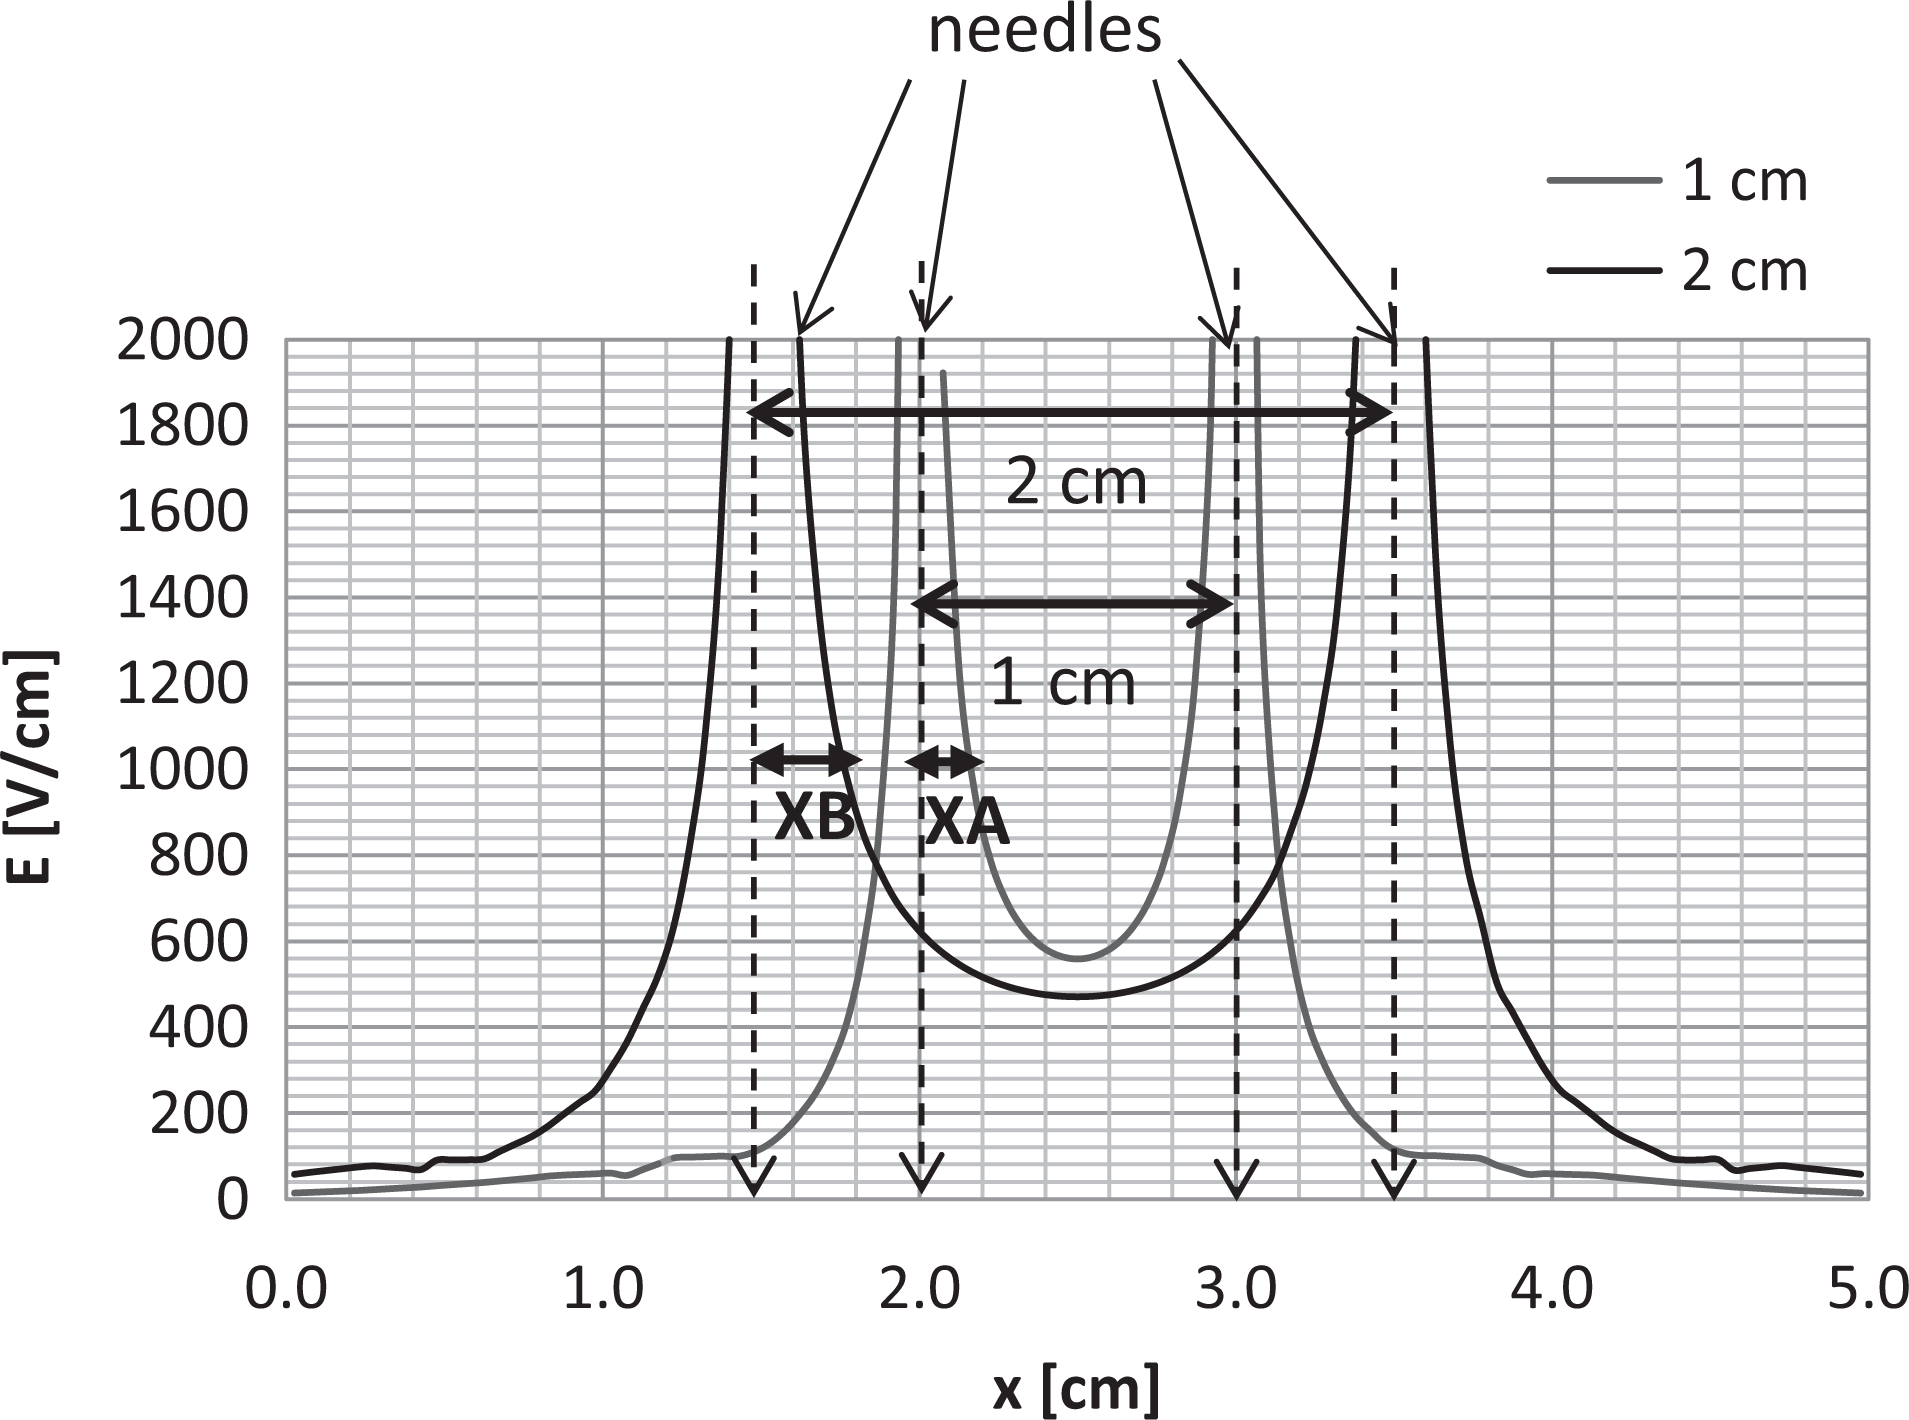
Figure 3 shows the electric field intensity for pairs of needles with a distance d = 1 cm and d = 2 cm as a function of the x-coordinate as reported by Ongaro et al. 9 The field is computed using the FEM model and sampled along the line evidenced in Figure 2B. For the pair with d = 1 cm, the applied voltage is 1000 V, for d = 2 cm, it is 2000 V, and for the other d distance it is proportional to the distance. Table 1 reports the value of the electric field intensity in the center of needles corresponding to a minimum as highlighted in Figure 3. In all the cases, the electric field overcame the threshold of 400 V/cm. It appears that the basal tissue conductivity and the value for electroporated cells as well as its dependence on the electric field modify the resulting electric field distribution as evidenced by Sel et al. 31 Moreover, Table 1 reports also the percentage difference, Δ% computed using Equation (4), between the electric field computed using nonlinear conductivity described by Equation (3) and the one computed considering a constant conductivity. In the cases reported in Table 1, the percentage differences with respect to the constant conductivity case are small and between 1% and 4%. In all these cases, the electric field overcame the electroporation threshold identified between 350 and 400 V/cm. 32
Electric Field Intensity in the Center of Needles (V/cm) With Varying Needle Distance.

Table 2 reports the distances at which an electric field of 1000 V/cm occurs. In particular, considering the electric field intensity near the needles and the value of 1000 V/cm, as marked in Figure 3, the segments XA and XB represent the distance from the needles for which the electric field intensity is higher than 1000 V/cm. As reported in Table 2, these segments have different lengths for different conductivity models. In all the examined cases, XA is shorter than XB. Therefore, the electric field intensity for d = 2 cm is higher than 1000 V/cm for a larger area close to the electrode. Thus, increasing the needle distance, it is larger the distance for which the electric field intensity is over a prescribed threshold.
Amplitude of the Segment XA and XB in Figure 3 for Which the Field Intensity Is at 1000 V/cm.a
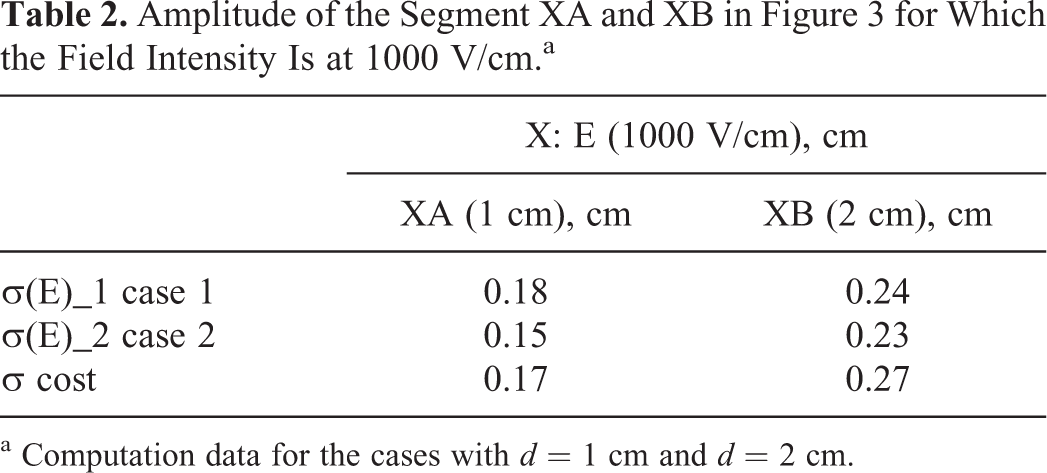
a Computation data for the cases with d = 1 cm and d = 2 cm.
Figure 4 shows the equi-level lines of the electric field in (V/cm) on the model surface generated by a needle pair with d = 1 cm or d = 2 cm (conductivity as in the case 2 on Figure 4A and B) and suitable applied voltage (1000 V for d = 1 cm and 2000 V for d = 2 cm) considering a nonlinear conductivity as in Equation 3 and for the sake of comparison a constant conductivity (Figure 4C and D). In particular, Figure 4 shows that in the center of the model the electric field is higher than 400 V/cm in every case. This electric field intensity is in the range of 300 and 500 V/cm, which was identified in the literature as the target range for efficient electroporation in tumor tissues. 32,33

Two-needle configuration. Electric field map in V/cm for nonlinear model and case 2 considering: (A) d = 1 cm, V = 1000 V and (B) d = 2 cm, V = 2000 V and considering constant conductivity: (C) d = 1 cm, V = 1000 V and (D) d = 2 cm, V = 2000 V. Circles represent needle positions and the arrow evidences the 400 V/cm electric field level.
Figure 5 shows the equi-level lines of the electric field in (V/cm) on the model surface generated by 3 needles organized in equilateral triangles (Figure 1), considering d = 1 cm and d = 2 cm (conductivity as in case 2 in Figure 5A and B). In particular, they show that, in the center of the triangle with d = 1 cm, the electric field intensity is higher than 400 V/cm, whereas in the triangle with d = 2 cm in the center, the electric field is between 300 and 400 V/cm. Then, in both configurations, the electric field intensity is in the range identified as target for tumor tissue electroporation (300-500 V/cm). 32,33 The case with constant conductivity (Figure 5C and D) is shown for the sake of comparison with previous analysis reported in Ongaro et al. 11 In this case, considering d = 2 cm and an applied voltage of 2000 V (Figure 5D), the computed electric field in the center of triangle appears lower than 300 V/cm. This effect is mitigated considering a more accurate description of the conductivity. Moreover, in experiments, it is well-known that conductivity depends also on the number of pulses applied, since the opening of pores on the cell membrane increases the tissue conductivity. 24,34,35

Three-needle configuration. Electric field map in V/cm for nonlinear model and case 2 considering: (A) d = 1 cm, V = 1000 V and (B) d = 2 cm, V = 2000 V.
Considering other needle distances as shown in Table 3, the more the distance d increases, the more electric field decreases in the center of the triangle. In particular, for d = 2 cm, the electric field is the lowest among the analyzed cases.
Electric Field Intensity in (V/cm) in the Center of 3-Needle Model Considering Constant Conductivity and the Model (3) With Different Coefficient Values.

Considering the 3-needle configuration and the case of d = 1 cm, in the case of d = 1 cm, the electric field in the center of the system is 511 V/cm, whereas for d = 2 cm, the electric field is about 425 V/cm. Data are reported in Table 3 including also other needle distances.
Considering other needle distances, the electric field in the center of the triangle decreases, increasing the needle distance, and in the case of d = 2 cm is the lowest between the analyzed d values. Considering the nonlinear model, the electric field in the center of the triangle is close to the electroporation range (350-450 V/cm) that identifies the electroporation threshold 32 for all the needle distances. Moreover, for increasing distances until 1.9 cm, the electric field is over 350 V/cm. For the case where needles are 2 cm distant, the electric field is very close to 350 V/cm (eg, between 347 and 354 V/cm).
Experimental Results
The effects of needle distance have been investigated also in in vitro test for the needle distance d = 1 cm and d = 2 cm. In these cases, the electric field assumes the higher and lower values in the middle of the needle pair and in the center of the triangle, respectively. In the first experimental condition, the needles at a distance of 1 cm were supplied by means of a voltage of 1000 V. Figure 6A shows the effect of electroporation on the cells in the area between 2 needles of 1 cm distance. The cells were positive to PI staining, indicating that electroporation occurred. As indicated in the graph under the panel with PI-stained cells, more than 80% of the cells are electroporated arriving at 97% in the central point (Table 4). Thus, the electroporation occurs from needle 1 to needle 2, including all the area between the 2 needles. The staining of the cells with CB showed that irreversible electroporation occurs in a limited area around needle 1 (radius 1.03 [0.29] mm) and needle 2 (radius 1.27 [0.36] mm).

Fluorescence images of MCF7 cells cultured in monolayer electroporated using a pair with needles (A) 1 cm distant, (B) 2 cm distant with 4 + 4 pulses, and (C) 2 cm distant with 24 + 24 pulses. The panel shows the reconstructed microscope images captured in the area including the 2 needles. The red fluorescence indicates cells positive to propidium iodide (PI; cells electroporated); blue fluorescence indicates cells positive to calcein blue AM (CB; cells viable); stars indicate the position of needle in the cell culture.
Percentage of Electroporated Cells at Different Experimental Conditions.

%EP = percentage of electroporated cells
Considering a needle pair with a distance of 1 cm and the electric field intensity obtained with numerical models, it appears that, at the distance of 1.03 and 1.27 mm, where the irreversible electroporation occurs, the computed electric field intensity is close to 1500 and 1150 V/cm, respectively, considering the model with constant conductivity. In case of nonconstant conductivity, the electric field intensity at the same distances from needles is 1240 V/m.
In the second experimental condition in which the needles are distanced by 2 cm and supplied by means of a voltage of 2000 V, cells around and between the needles resulted positive to PI staining, indicating that electroporation was occurred (Figure 6B and C). Specifically, starting from needle 1, the distance of electroporation toward needle 2 at which at least the 80% of cells were positive to PI was 4.50 (0.71) mm. The same distance of electroporation was obtained from needle 2 toward needle 1. This means that between the 2 needles of 2 cm distance, there was a central region (11 mm) where less than 80% of the cells were electroporated. Calcein blue AM images show that, except for a limited region around the needles (needle 1: 1.42 [0.35] mm and needle 2: 1.65 [0.42] mm), all the cells electroporated were viable, indicating that a mainly reversible electroporation of the cells was obtained. In this case, in which needles are 2 cm in distance, the electric field intensity obtained with numerical models at the distance of 1.42 and 1.65 mm, where the irreversible electroporation occurs, is close to 1950 and 1550 V/cm, respectively, considering the model with constant conductivity. This field intensity is 1420 V/m if the model with nonlinear conductivity is considered.
As not all the region comprised between 2 needles at a distance of 2 cm supplied with 2000 V showed more the 80% electroporated cells, in order to increase electroporation efficiency and to assure complete electroporation between the needles, we increased the number of pulses delivered, maintaining the same voltage supplied. For this reason, in the third experimental condition, the needles at a distance of 2 cm were supplied with 24 + 24 pulses, instead of 4 + 4 pulses. In this condition, we obtained more than 90% electroporated cells in the whole area between the 2 needles with a 93% of electroporation between the needles, as it has been shown in Figure 6C. Further, irreversible electroporation occurred around the needles (needle 1: 2.90 [0.57] mm and needle 2: 3.21 [0.55] mm). In this last case, the electric field intensity obtained with numerical models at the distance of 2.90 and 3.21 mm, where the irreversible electroporation occurs, is close to 950 and 830 V/cm, respectively. This fact shows that an increment in the number of pulses decreases the electric field strength at which the irreversible electroporation occurs.
As the functional unit of the grid electrode is based on hexagonal geometry, we have enlarged the area investigated microscopically, considering a triangle, as a portion of the hexagon. The 3 needles at the vertex of the triangle have been supplied 2 by 2 considering the 3 pairs. Each needle pair has been supplied by 24 + 24 voltage pulses, inverting the polarity of the generator after the first 24 pulses. The experimental condition (2000 V 24 + 24 pulses) found to be more efficient for needle pairs was applied also to the triangle.
Considering each couple of needles in the triangle, we have obtained similar results among them and we have shown in Figure 7 a representative panel of the region included between needles 1 and 2 (2 cm) of the triangle, as well as the microscopic images corresponding to the central area (D) of the triangle. As shown in the Figure 7 and reported in Table 4, the 99% of cells resulted in electroporation between the needles and even 90% of the cells were electroporated in the central point of the triangle, indicating that all the area included in the triangle was electroporated at least for 90% and the cells were alive.
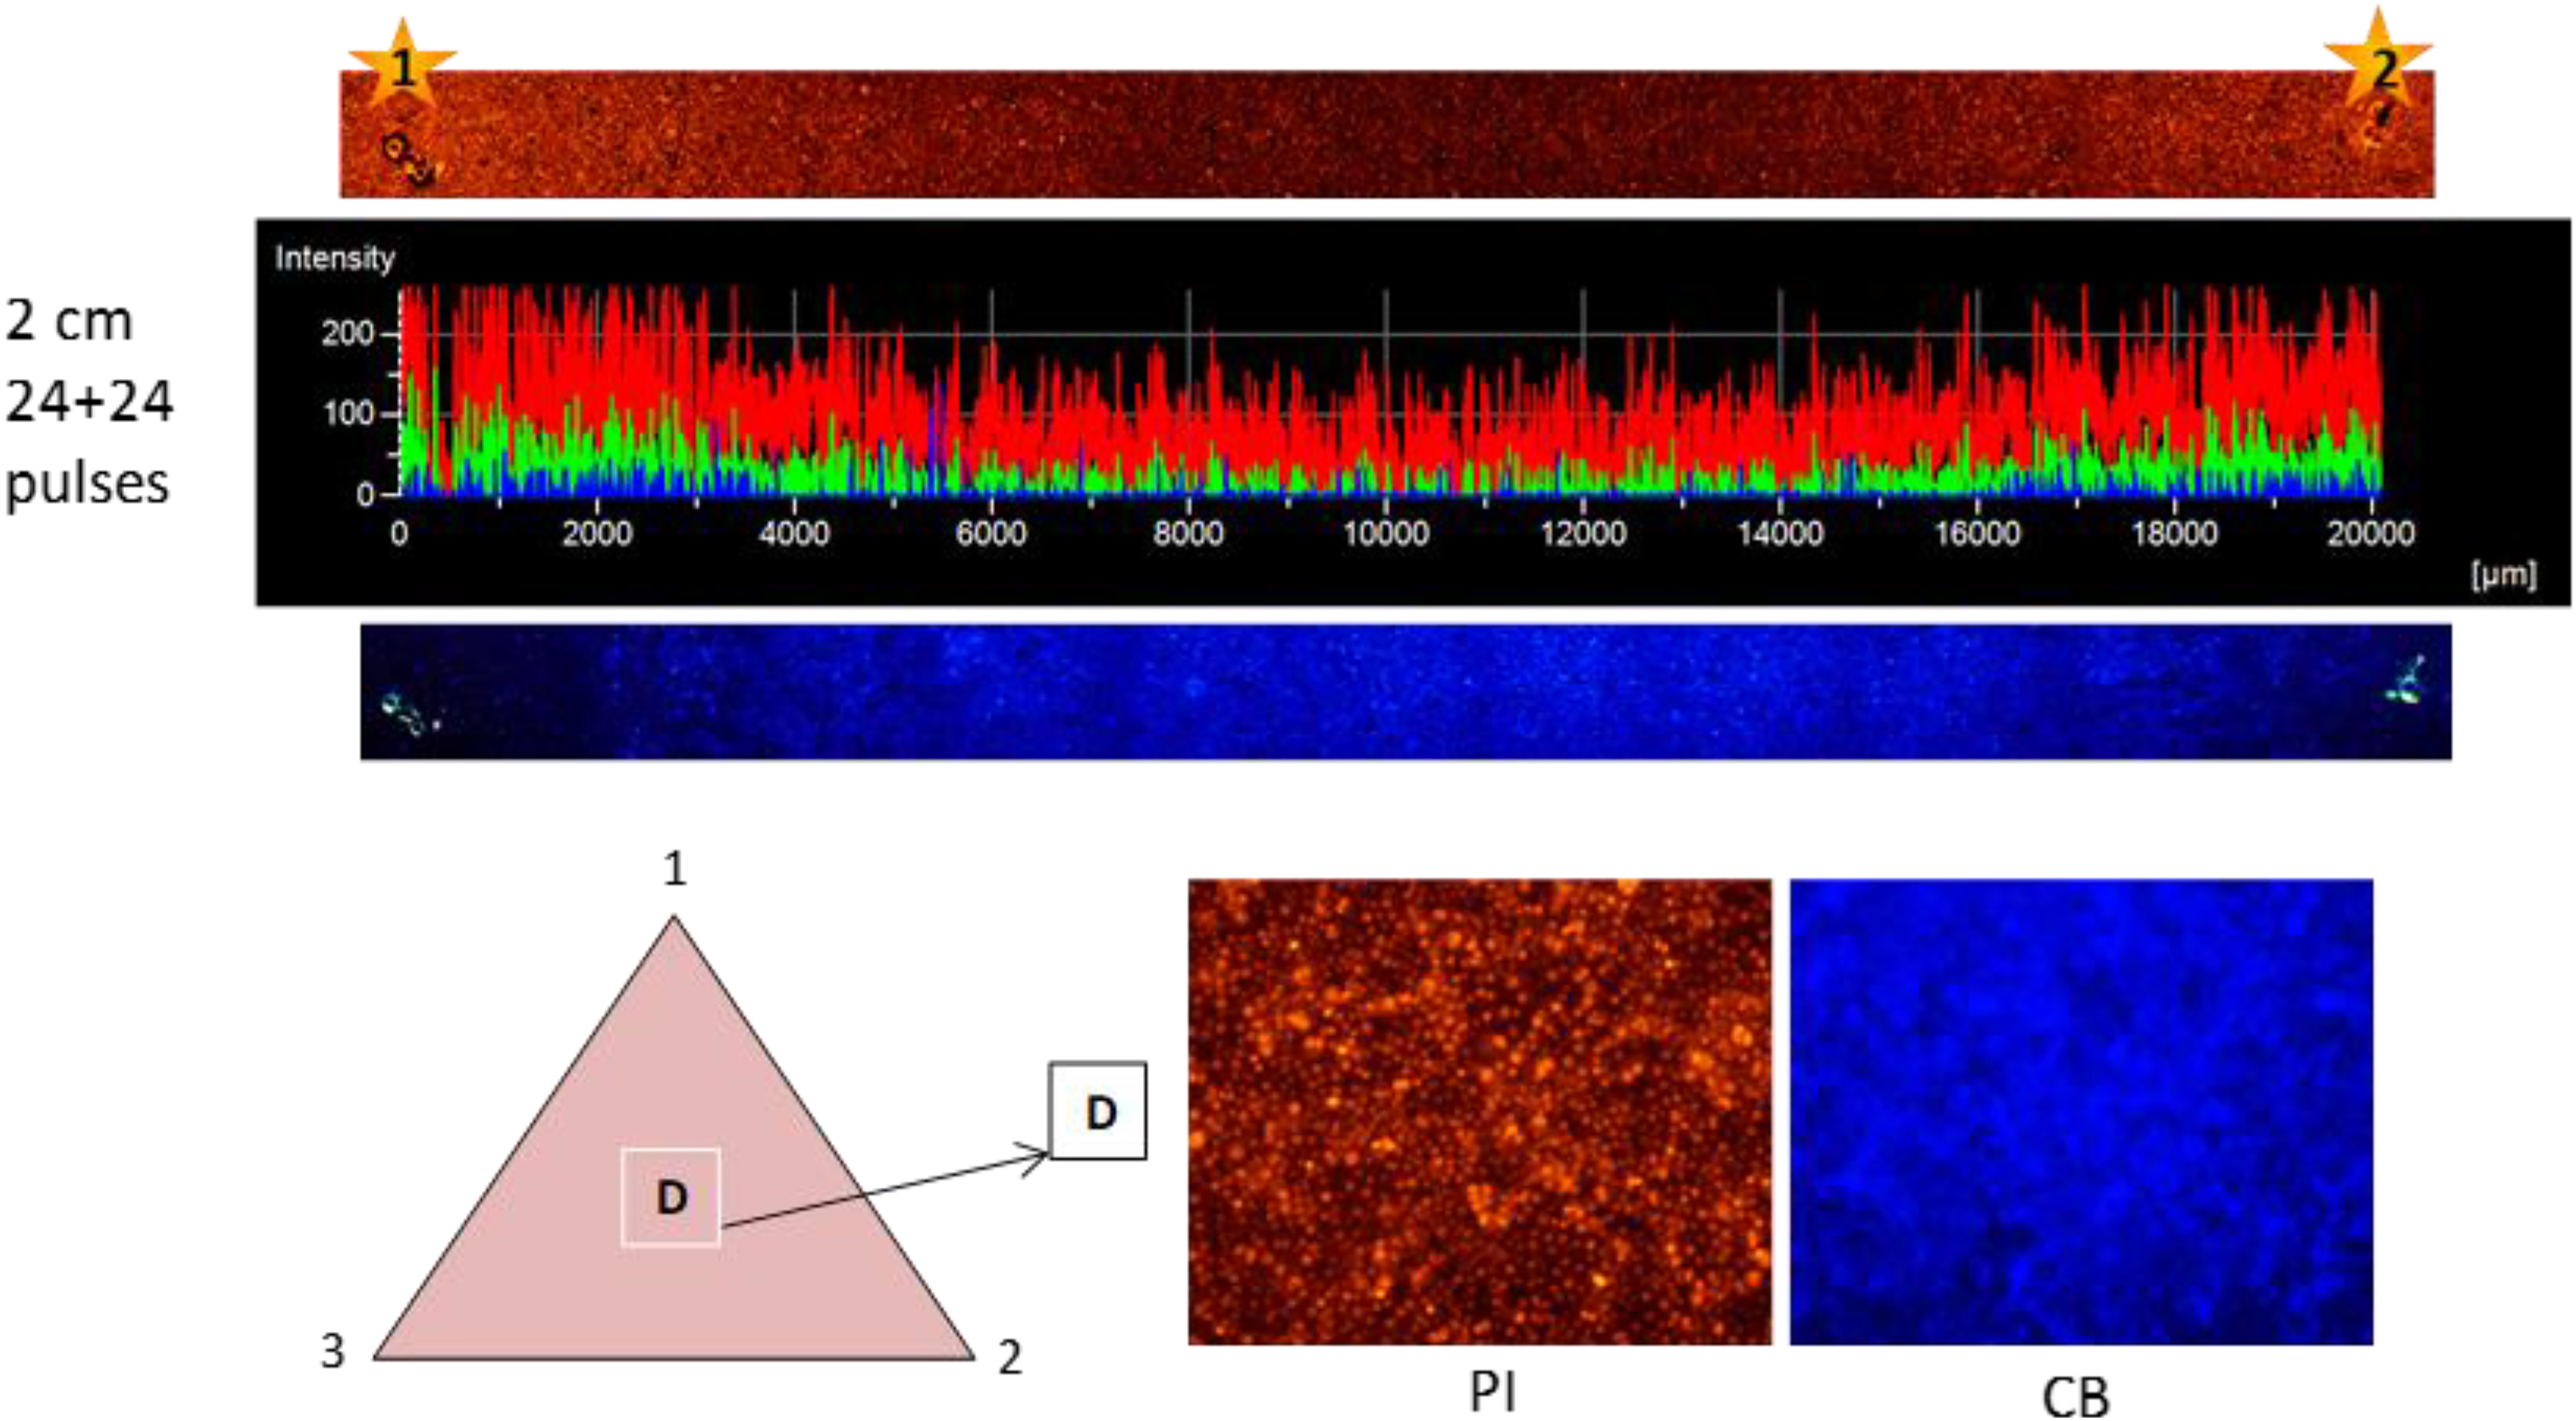
Fluorescence images of MCF7 cells cultured in monolayer electroporated using triangles with needles 2 cm distant. Needles supplied with 24 + 24 pulses at 2000 V. Red fluorescence indicates cells positive to propidium iodide (PI; cells electroporated); the graph shows the PI fluorescence intensity as a function of the distance between the needles; blue fluorescence indicates cells positive to calcein blue AM (CB; cells viable).
Discussion
The numerical models can predict the electric field intensity in a simple model of homogeneous tissue when a voltage is applied between a needle pair. Experiments in cells cultured in monolayer show the effect in terms of electroporation occurred near the needles and in the center of the pairs. These experiments confirm the higher electric field intensity near the electrode when needles are more distant than 1 cm. Even if the simulation model did not consider the inhomogeneity of electrical characteristic of tissue due to the dependence on electric field intensity, 17,23 which is a characteristic of real tissue, 36,37 nevertheless, simulation results using a simple homogeneous model are useful to compare different electrodes in terms of distribution of electric field. The use of a more complex model for conductivity shows a higher electric field in the center model and comparable electric field near electrodes. Comparing electric field maps found using constant conductivity and a nonlinear conductivity on electric field, it appears that in the center of the model the electric field is lower in the case of the constant conductivity is used. The use of a conductivity dependent on the electric field intensity is reasonable, since cells electroporated and the macroscopic effect is an increment of the tissue conductivity. Then, it is reasonable that the electric field is higher with respect to the one found considering the simplest model with constant conductivity. Moreover, considering 2 different coefficient sets in the conductivity model (Equation 3), it appears that the computed electric field in the model center is not so much different. In the 2 needle models, it appears that the minimum of the electric field overcame the field intensity of 400 V/cm that is inside the electroporation range identified between 350 and 400 V/cm. 32 Furthermore, also in the center of the triangle, the electric field is inside this electroporation range since the minimum electric field computed using the nonlinear model is 391 V/cm. Because of the 3-needle geometry, the electric field in the triangle center is lower than the one in the center of a needle pairs, and the protocol design in terms of voltages and pulse number has to be accurately tuned. Nevertheless, the complex models have the drawback that the coefficients of the conductivity model are not well known and only rough estimation can be used. In fact, Tables 1 and 3 show that the computed electric field in the same points of the model can be different with varying model coefficients and the conductivity model. In order to investigate more parameter combinations and not just the needle distance, a more accurate optimization problem, for example, using suitable algorithms such as the genetic ones, 22,38 -40 should be implemented. Although in vitro test using cells in monolayer permits to analyze the effects of electroporation at a cellular level, however, the cellular model does not take into account the tridimensional characteristics of a tissue. In particular, the problem of inclined needles is a complex problem that needs an in-depth study using simulations and suitable experiments similar to the one proposed by the authors in a previous work. 41 Moreover, this experimental model is simplified with respect to the tissue structure and it did not consider that electroporation of cell membranes in a tissue depends also on other cell characteristics (eg, conductivity, shape, orientation, size, etc). 19,35,42 However, the in vitro tests reported in this study permit to verify and confirm directly on cell culture the effects of electroporation hypothesized by numerical modeling.
The proposed device based on an arrangement of 7-needle groups with an inter-needle distance of 2 cm could be useful to increases the area treated by means of a single 96-pulse sequence. Considering an area of 12.5 cm2, the standard 7 needles, with a distance of 0.73 cm apart (surface of 1.67 cm2), could be applied at least 8 times to be sure to cover all the 12.5 cm2 area and the 96-pulse sequence repeated 8 times. Considering a 20-second time interval to move electrode, charge voltage generator capacitances, and activation of 1 96-pulse sequence, this area could be treated in 2 minutes and 40 seconds using standard 7-needle electrode. Conversely, the same area of 12.5 cm2 could be treated using the device with 13 needles at 2 cm distance and a single sequence of 96 pulses. Then, the large area electrode could be useful in reducing the number of voltage pulse applications and the time required for the electroporation delivery. In vitro test confirmed that it is possible to obtain the electroporation of the whole area covered by a grid electrode with needles at 2 cm distance. On the other hand, to ensure that at least 90% of the cells were electroporated in the whole area interested by the electrode, an increased number of pulses delivered was required.
The use of this kind of electrode can lead to several benefits for the patients such as to avoid the doubling of the chemotherapy bolus if the cancer lesion to treat is large (due to time limit in bioavailability of bleomycin), with a consequent reduction in adverse effects due to the chemotherapeutic drug administration.
The area of irreversible electroporation could lead to cell death around the insertion point of needles. However, further studies in 3-D models are required to better quantify the size of irreversible electroporation around needles, before to apply these electrode for clinical use. Nevertheless, in recent years, irreversible electroporation has been proposed as therapy to treat tumor mass. 43 -48
Conclusion
This study combines simulation results, obtained by numerical models, with experimental results on cells cultured in monolayer. The aim of this article is the validation of the 3-needle configuration evaluating the electric field at the center of the triangle. Moreover, from electric field intensity simulated by means of the numerical models, it was possible to predict the amplitude of the area where irreversible electroporation can occur. In fact, increasing the applied voltage to the needles, the irreversible electroporation increased. This article offers a comparison between computational data and experimental data. These results were confirmed in vitro by the cellular model. Experiments have shown that increasing the number of pulses per sequence, for example, up to 48, the area between electrodes in 2-needle configuration has been electroporated at 100% near needles and more than 90% in the middle. For a triangle structure, the same electroporation percentage compared to that in the case of 2 needles has been found. In particular, in the center of the triangle, the electroporation was at the 90%.
Footnotes
Acknowledgments
Declaration of Conflicting Interests
The author(s) declared no potential conflicts of interest with respect to the research, authorship, and/or publication of this article.
Funding
The author(s) disclosed receipt of the following financial support for the research, authorship, and/or publication of this article: This project was granted by CPDA138001 (Padua University).